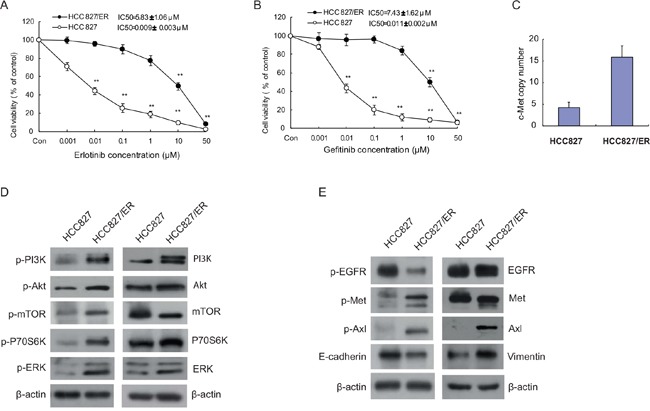
Figure 1. Cytotoxicity of EGFR-TKIs and molecular profiles in parental HCC827 and resistant cell line HCC827/ER.

Cells were treated with the indicated concentrations of erlotinib (A) and gefitinib (B) for 72 h in medium containing 1% FBS. Cell viability was determined using an MTT assay, and IC50 values were calculated using Graphpad Prism software 5.0. Results were expressed as the percentage of living cells compared to the control, error bars indicate SD of three independent measurements. *p <0.05, *p <0.01 vs control group. (C) The Met gene copy number of HCC827 and HCC827/ER cells was measured by real-time PCR using Taqman probes. (D) Basal expression of EGFR downstream signaling molecules in HCC827 and HCC827/ER cells was evaluated by Western blotting. (E) Protein expression of EGFR, bypass signal molecules c-Met and Axl, and epithelial-to-mesenchymal transition (EMT) markers in HCC827 and HCC827/ER cells. Protein (20 μg) from cell lysates was subjected to Western blot analysis. The results are representative of at least three independent experiments.
