
Figure 3. Effect of IL-15 on expression of different NK cell receptors.
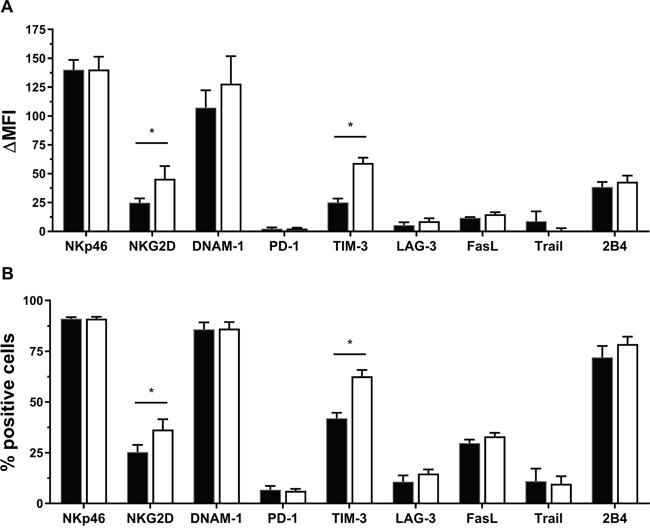
(A) Differences in mean fluorescence intensity (ΔMFI) between the receptor and corresponding isotype are shown for both unstimulated (not stim.) and IL-15 stimulated NK cells. (B) Differences in percentage positive cells (% Overton) are shown for both unstimulated (not stim.) and IL-15 stimulated NK cells Analysis was performed with flow cytometry. Data is depicted as mean (± SEM) for eight donors (except for TRAIL, n = 7). *, p < 0.05. Wilcoxon Signed Ranks Test (2-tailed).