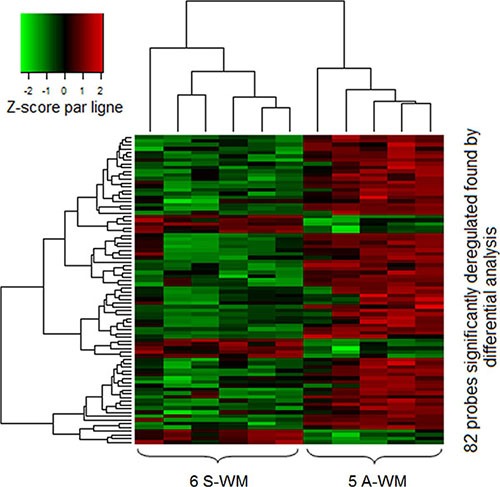
Figure 1. GEP identifies a signature that allows to differentiate A-WM from S-WM.

Gene expression data were normalized using the Robust Multi-array Average (RMA) algorithm. Then we performed differential analysis on a first series of 11 patients; 82 probes (corresponding to 48 genes) were significantly identified. The heatmap shows the spectrum of normalized expression values with a Z-score: red indicates a high level of mRNA expression and green indicates a low level of expression. Each row represents one of the 82 probes and each column a WM sample. In this unsupervised classification, patients with A-WM clustered separately from patients with S-WM.
