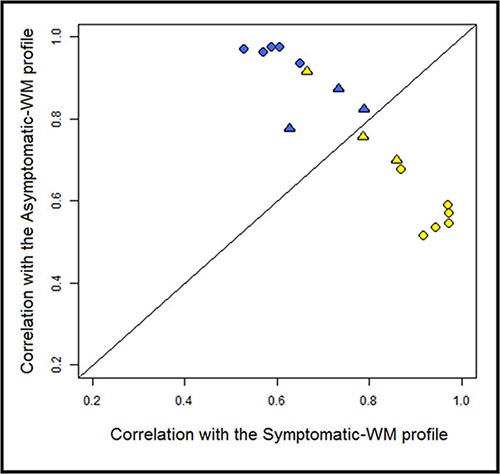
Figure 2. Correlation plot of the transcriptional profile for A-WM and S-WM.

The correlation coefficients for each of the WM samples with the average expression of the 82 probes in either A-WM or S-WM samples were calculated and are shown on the vertical axis and horizontal axis, respectively. The line of equal correlation was chosen as threshold. Patients positioned above the threshold were classified as A-WM; patients below the threshold were classified as S-WM. The blue dots correspond to the A-WM, the yellow ones to the S-WM. The circles correspond to the first 11 patients and the triangles to the 6 patients from the independent set.
