
Figure 5.
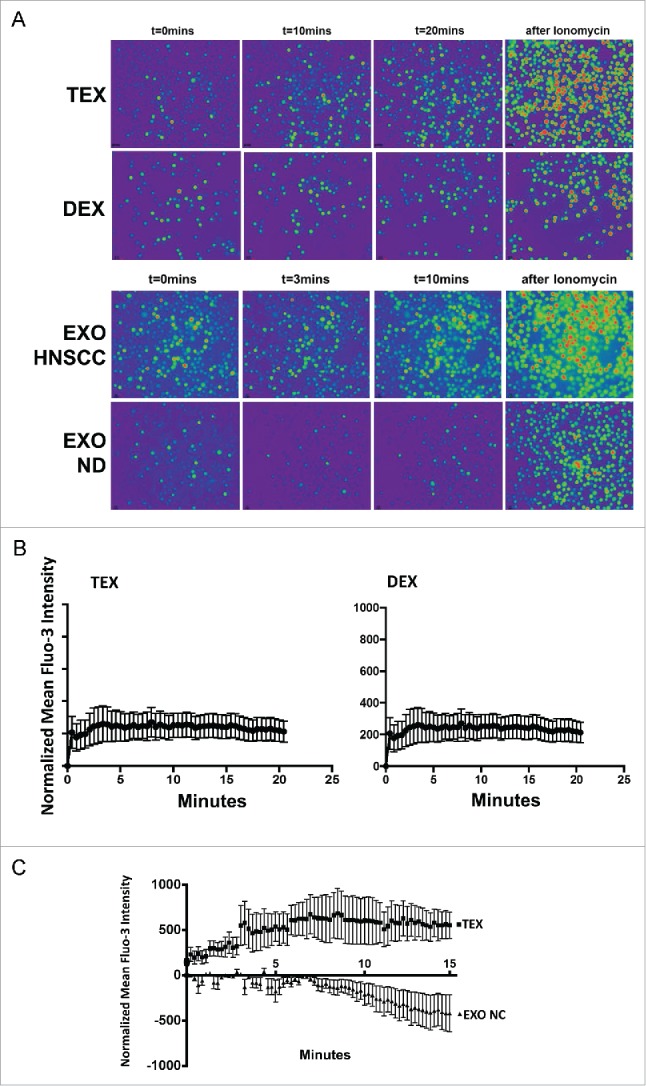
Ca2+ flux in human T cells co-incubated with TEX, DEX, or EXO. In (A), T cells co-incubated with exosomes were labeled with Fluo-3 and examined in a Nikon A1 microscope as indicated in Methods. Ionomycin, which induces strong Ca2+ flux, was used as a positive control. T cells were imaged at different times after Fura-2 addition. The upper panel compares effects of TEX and DEX. The lower panel compares effects of EXO isolated from plasma of a representative HNSCC patient vs. EXO isolated from ND's plasma. In (B), Fluo-3 intensity levels in T cells co-incubated with TEX or DEX. The data are from a representative experiment of 3 performed with T cells of different donors. Note the strong and prolonged signal in T cells co-incubated with TEX and the absence of signaling in T cells co-incubated with DEX. In C, Fluo-3 intensity levels in CD4+T conv cells co-incubated with EXO from the plasma of HNSCC patient with active disease (AD) or with EXO from ND's plasma. Note the strong, prolonged signal induced by patients' EXO vs. an absence of signal with ND's EXO. Shown are representative Ca2+ flux data obtained from four to six experiments performed with T cells of different subjects.