
Figure 1.
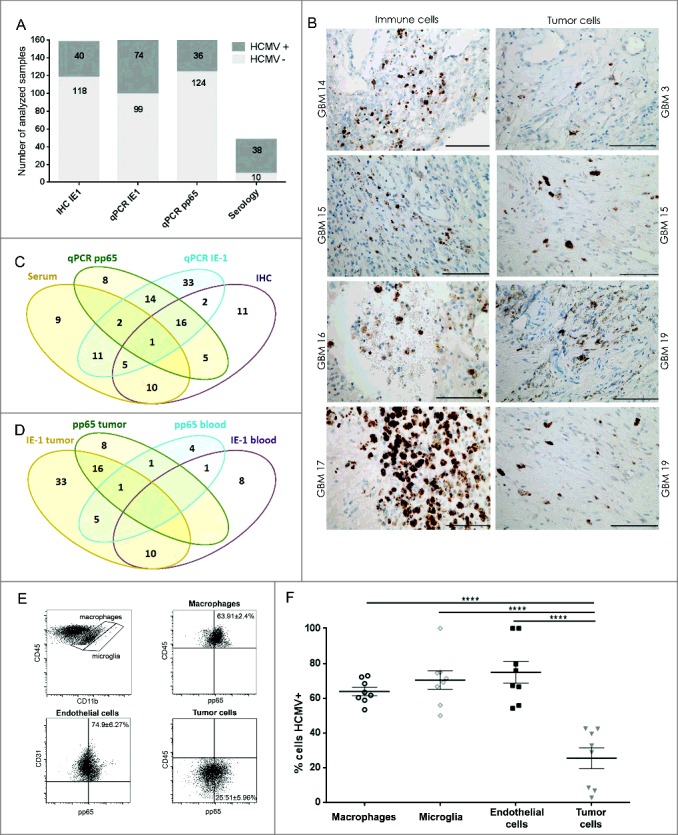
HCMV positivity in GBM determined comparatively by serology, qPCR and IHC. GBM patients were investigated for presence of HCMV pp65 and IE-1 expression by (A) qPCR, IHC and serology (dark gray bars = positive samples and light gray bar = negative samples) and (B) IE-1 expression on macrophage/myeloid derived cells (left panel) and on tumor cells (right panel). Magnification 400X, Scale bar 100 μm. (C) Venn diagram showing comparative HCMV serology (IgG), qPCR (pp65), qPCR (IE-1) and IHC (IE-1) detection in GBM tissue and blood. (D) Venn diagram showing comparative HCMV pp65 and IE-1 qPCR in GBM patients' blood and tumor. (E) Representative dotplots showing (left to right) macrophages (CD45brightCD11bbright) and microglia (CD45dimCD11bbright) within tumor biopsies cells; pp65 vs. CD45 within macrophages of tumor biopsies; pp65 vs. CD31 within CD45− tumor biopsy cells; and pp65 vs. CD45 within CD45− tumor biopsy cells. (F) % mean ± SEM of pp65+ cells within CD45brightCD11bbright macrophages, CD45dimCD11bbright microglia, CD45-CD31+ endothelial cells and CD45- tumor cells. (2-way ANOVA, Bonferroni's multiple comparison, ****P < 0.0001). IHC = immunonohistochemistry; IE-1 = immediate early -1.