
Figure 2.
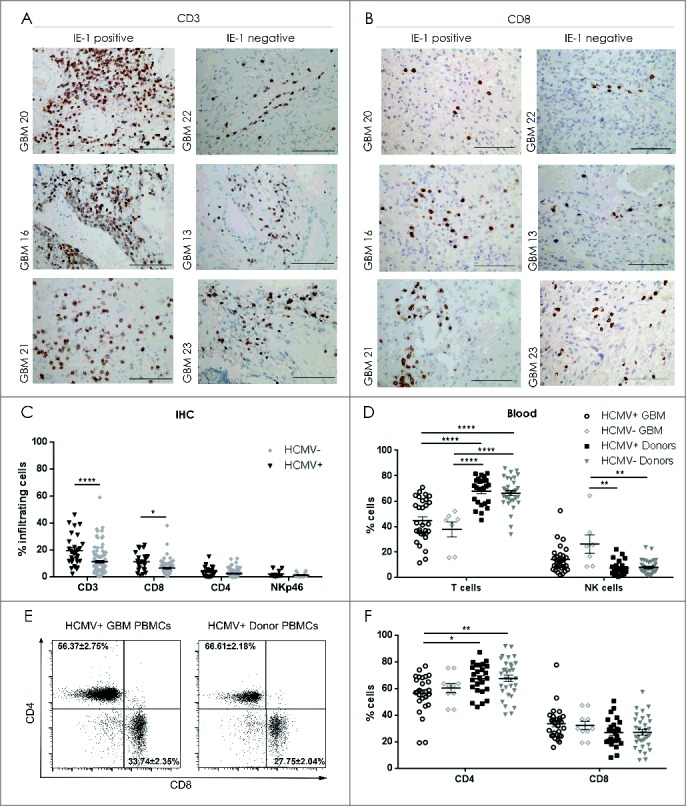
Decreased NK cells in blood and increased CD8+ T cells in tumor of HCMV+ patients. Representative IE-1+ or IE-1− tumors determined by IHC showing (A) CD3 positivity and (B) CD8+ T cell infiltration. Magnification 400X, Scale bar 100µm. (C) % mean ± SEM of T cell (CD3+), Th cells (CD4+), CTLs (CD8+) and NK cells (NKp46+) infiltrating the IE-1+ or IE-1− tumors determined by IHC, n = 138. (D) % mean ± SEM of CD3+T cells and CD3−CD56+ NK cells in peripheral blood of HCMV+ and HCMV− GBM patients and donors determined by flow cytometry. (E) Representative dotplots showing CD4+ vs. CD8+ T cell populations in seropositive patient and healthy control donor. (F) % mean ± SEM of CD4+ and CD8+ T- cells in peripheral blood of HCMV+ and HCMV− patients (n = 26) and donors (n = 56). Two Way ANOVA, Bonferroni's multiple comparison *P < 0.05, **P < 0.01, and ****P < 0.0001.