

ABSTRACT
An important question is how chemotherapy may (re-)activate tumor-specific immunity. In this study, we provide a phenotypic, functional and genomic analysis of tumor-specific CD8+ T cells in tumor (P815)-bearing mice, treated or not with cyclophosphamide. Our data show that chemotherapy favors the development of effector-type lymphocytes in tumor bed, characterized by higher KLRG-1 expression, lower PD-1 expression and increased cytotoxicity. This suggests re-engagement of T lymphocytes into the effector program. IFN-I appears involved in this remodeling. Our findings provide some insight into how cyclophosphamide regulates the amplitude and quality of tumor-specific immune responses.
KEYWORDS: CD8+ T cells, cyclophosphamide, effector function, exhaustion, tumor-specific immunity
Introduction
One of the major observations in the past years is that the success of chemotherapy depends on the immune system. This conclusion was at first considered as counterintuitive as, depending on the dose, chemotherapeutic treatment is toxic to metabolically active cells, such as cells of the immune system which are constantly generated in the bone marrow and the thymus.1 However, experimental evidence in humans and mice clearly demonstrates that chemotherapy may boost immune rejection of tumors.2-4
The identification of the cellular and molecular mechanisms underlying the potentiating effect of chemotherapy on tumor immune rejection is critical, as it may highlight novel immunotherapeutic approaches. A number of indirect effects of chemotherapeutic agents have been reported on the tumor cells themselves, on immune cells (such as regulatory T cells and antigen-presenting-cell subsets) as well as on the stroma.5,6 The direct effect of chemotherapy on T lymphocytes is less clear, although lymphopenia is likely to affect T cell function/survival through the availability of specific niches and homeostatic cytokines.7-9
To address this question, we examined the cellular and transcriptional changes associated with chemotherapy. Our previous studies have highlighted the role of CD8+ T cells specific for a previously identified tumor neo-antigen, which is named P815E or P1E and results from a point mutation in the MsrA gene,10 in the regression of ectopically transplanted P815 mastocytoma. The proportion of these cells, which recognize the P1E/H-2Kd complex increased from approximately 30% to over 50% of CD8+ T lymphocytes, whereas the proportion of CD8+ T cells specific for the MAGE-type antigen P1A (encoded by the cancer-germline gene P1A) in the context of H-2Ld decreased concomitantly, indicating that cyclophosphamide altered the repertoire of CD8+ T cells recognizing tumor antigens.11
We monitored the expression of selected genes expressed by P1E-specific CD8+ T cells infiltrating progressing vs. regressing (after cyclophosphamide) P815 tumors. Single cell PCR (polymerase chain reaction) and flow cytometry analyses revealed that administration of cyclophosphamide favored the development of effector cells with strong cytotoxic capacity, suggesting that chemotherapy treatment may remodel the quality and/or effector activity of tumor-specific CD8+ T cells.
Results
Transcriptomic analysis of P1E-specific CD8+ T cells infiltrating P815 in mice treated or not with cyclophosphamide
We compared the transcriptional profile of CD8+ T cells infiltrating regressing or progressing P815 mastocytomas in mice that were treated or not with cyclophosphamide (CTX) 8 d earlier, respectively (Fig. 1A and B). We analyzed CD8+ T cells specific for the “mutated” antigen P1E, as their infiltration in tumor bed correlated with tumor rejection.
Figure 1.

Cyclophosphamide treatment favors the emergence of a phenotypically distinct subset of tumor infiltrating, P1E-specific CD8+ T cells. DBA/2 mice were inoculated s.c. with 2 × 10⁶ P815 P1.HTR tumor cells and treated i.p. with CTX (3 mg) or PBS 10 d later. Tumor infiltrating (P1E/H-2Kd)+ CD8+ T cells were single-cell sorted 8 d post-drug treatment and transcriptional profiles determined using a targeted approach. (A) Effect of CTX on tumor growth. Data are representative of four independent experiments with 8–11 mice per group. Statistical significance was determined by the Mann–Whitney test. (B) Mean of tumor volume 8 d after CTX injection. Data display the summary of four independent experiments with 8–11 mice per group. Statistical significance was determined by the Mann–Whitney test. (C) Graph of Scatter Plot correlation obtained with the GenEx qPCR analysis software, showing the expression levels of 56 genes for 90 single cells isolated from 1 CTX-treated mouse (n = 45) and 1 untreated mouse (n = 45). (D) Principal component analysis (PCA) with a selection of 23 genes based on single-cell qPCR data from tumor-infiltrating (P1E/H-2Kd)+ CD8+ T cells. Each symbol represents an individual cell. p = 0.01556. (E) Gene-expression heatmap, obtained after two-way hierarchical clustering using the GenEx qPCR analysis software, showing gene-expression profiles for 40 cells per sample from 3 individual mice per group. *p < 0.05; **p < 0.01; ***p < 0.001; ****p < 0.0001; ns, not significant.
We used P1E/H-2Kd tetramers to sort P1E-specific CD8+ T cells as single cells and analyze the expression of 85 genes known to regulate T cell proliferation and function. By hierarchical clustering analysis, we compared 45 cells from a tumor-bearing, untreated mouse with an equivalent number of cells purified from a CTX-treated animal (Fig. S1A). Hierarchical clustering clearly divided the cells into two groups which included several subgroups of (P1E/H-2Kd)+ CD8+ T cells from CTX-treated and untreated mice, suggesting distinct gene-expression profiles of tumor-infiltrating lymphocytes (TILs) from progressing and regressing tumors. The violin plots illustrate the expression of individual genes in both populations (Fig. S1B). We then undertook a more restricted analysis to identify the genes permitting to clearly distinguish these populations and avoid statistical bias. We excluded 29 genes from the analysis based on their low occurrence (expression by 40% or less of the single-cell samples) and established correlations between gene expression profiles of tumor-infiltrating (P1E/H-2Kd)+ CD8+ T cells and CTX treatment. The scatter plot analysis indicated that, among the 56 selected genes, 25 genes were overexpressed whereas only one gene was downregulated after CTX treatment (Figs. 1C and S1C).
A principal component analysis (PCA, a multivariate analysis) was used to statistically reduce dimensions (in our case, the number of genes) of data through the identification of linear combinations of original data ranked following their importance. The data are represented into the two most important principal components (PCs), PC1 and PC2. Fig. 1D shows a gene expression space which is 56 dimensional (each corresponding to an individual gene), with each point representing an individual cell. Each component has contributions from all 56 genes since the components cut across this 56D space. PC1 explained 85.13% of the observed variance whereas PC2 explained 2.45%. The projection of the gene expression patterns into PC1 and PC2 led to the identification of two distinct populations of cells based on the expression of 23 genes (Fig. 1D), discriminating (P1E/H-2Kd)+ CD8+ T cells infiltrating progressing vs. regressing tumors.
To validate these observations, groups of 40 pooled tumor-infiltrating (P1E/H-2Kd)+ CD8+ T cells were sorted from control and CTX-treated mice and gene expression was quantified by conventional qPCR after specific pre-amplification. The choice of tested genes was based on the ranking obtained with PCA single-cell analysis and their role in the regulation of CD8+ T cell function. A hierarchical clustering analysis confirmed the unsupervised segregation of tumor-infiltrating (P1E/H-2Kd)+ CD8+ T cells into two distinct populations, according to the treatment (Fig. 1E). Collectively, these data indicate that key transcripts associated with effector status (such as Granzymes, FasL, Eomes and Blimp-1) and proliferation (such as Ki-67) were upregulated in (P1E/H-2Kd)+ CD8+ T infiltrating regressing tumors.
Tumor-specific (P1E/H-2Kd)+ CD8+ T cells acquire features of effector cells in response to cyclophosphamide treatment
The increased expression of Granzyme K, Eomes, Ki-67 and FasL suggested that effector CD8+ T lymphocytes harboring stronger killing capacity developed after chemotherapy. We therefore tested the tumor-specific cytotoxic activity in vivo and showed that approximately 25% of P1E-expressing target cells were lysed in CTX-treated mice (in 48 h), as compared with 10% in untreated tumor-bearing mice (Fig. 2A, right panel). As a control, the lysis of P1A peptide-pulsed target cells remained low (less than 5%) in P815-bearing mice treated or not with CTX (Fig. 2A, left panel). In accordance with the enhanced lysis of P1E-pulsed target cells, (P1E/H-2Kd)+ cells from the draining lymph node and the tumors expressed increased levels of perforin (Fig. 2B and C).
Figure 2.
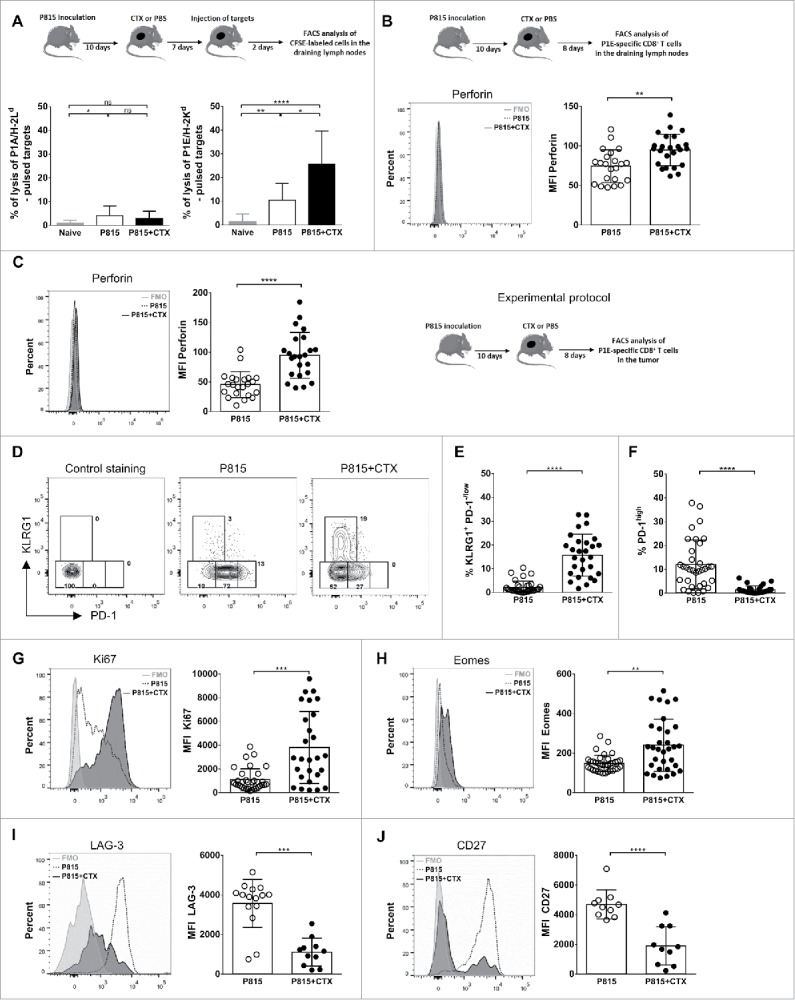
Tumor-specific CD8+ T cells acquire features of terminal effector cells following cyclophosphamide treatment. DBA/2 mice were inoculated s.c. with 2 × 10⁶ P815 P1.HTR tumor cells and treated i.p. with CTX (3 mg) or PBS 10 d later. Cells were harvested and analyzed 8 or 9 d after CTX injection. (A) The P1A- and P1E-specific cytotoxic activities were assayed in vivo in draining lymph nodes using CFSE-labeled target cells, pulsed or not with P1A or P1E peptides. Data from six independent experiments with 2–4 mice per group are expressed as percentage of lysis. Statistical significance was determined by the Kruskal–Wallis test. (B, C) Perforin expression on (P1E/H-2Kd)+ CD8+ T cells from (B) draining lymph nodes or (C) tumor. Data are representative of single individuals in each treatment group (left panels) or display the MFI of individual determinations from three independent experiments with 6–9 mice per group (each data point represents one mouse, right panels). Statistical significance was determined by the Mann–Whitney test. (D–F) Representative flow cytometry plots (B) and quantification of KLRG1+ PD-1−/low cells (C) or PD-1high cells (D) among tumor infiltrating (P1E/H-2Kd)+ CD8+ T cells. Data are representative of (B) single individuals in each treatment group or (C, D) the percentage of positive cells for the indicated markers from individual determinations of five independent experiments with 4–8 mice per group (each data point represents one mouse). Statistical significance was determined by the Mann–Whitney test. (G–J) Ki67 (E), Eomes (F), LAG-3 (G) and CD27 (H) expression on tumor infiltrating (P1E/H-2Kd)+ CD8+ T cells. Data are representative of single individuals in each treatment group (left panels) or display the MFI of individual determinations from three to six independent experiments with 3–8 mice per group (each data point represents one mouse, right panels). Statistical significance was determined by the Mann–Whitney test. FMO = full minus one, means that all antibodies were present in the staining cocktail, except those of interest. *p < 0.05; **p < 0.01; ***p < 0.001; ****p < 0.0001; ns, not significant.
Based on a consensus nomenclature defined for murine and human CD8+ T cell phenotypes,12-14 we monitored the expression of the surface markers killer cell lectin-like receptor G1 (KLRG-1) and programmed cell death (PD)-1, and of the transcription factor Eomes, known to regulate effector functions. Flow cytometry analysis of tumor-specific CD8+ T cells infiltrating the tumors revealed an inverse association of KLRG-1 expression with the exhaustion marker PD-1, suggesting differential programming of exhausted and terminal effector cells during chemotherapy (Fig. 2D). A summary of all experiments performed indicated that a substantial increase in the proportion of KLRG-1+ cells among (P1E/H-2Kd)+ cells infiltrating the tumor after chemotherapy (Fig. 2E). Of note, the expression of PD-1 was strongly reduced after treatment, with a 8-fold reduction of the proportion of PD-1hi cells (Fig. 2F). Finally, (P1E/H-2Kd)+ cells infiltrating regressing tumors were highly proliferative (Fig. 2G) and displayed phenotypical markers associated with effector function, such as increased expression of the T-box transcription factor Eomes (required for late IFN-γ and perforin expression15) and decreased expression of the receptors LAG-3 (an inhibitory receptor) and CD27 (a hallmark of naive and memory cells) (Fig. 2G–J). The analysis of non-P1E-reactive (tetramer negative) tumor-infiltrating CD8+ T lymphocytes revealed similar phenotypic alterations (Fig. S2), a likely consequence of the recruitment of lymphocytes reacting to distinct P815-derived tumor antigens.16 Alternatively, the cytokinic environment in the tumor may trigger the phenotypic shift of infiltrating lymphocytes independently of their specificity.
We next monitored the development of P1E-specific effector cells in draining lymph nodes (LNs) 8 d after cyclophosphamide (or PBS) injection. These cells downregulated the lymph node-homing molecule CD62L and upregulated the expression of CXCR3, a chemokine receptor directing cells toward inflammatory chemokines CXCL9, 10 and 11. Of note, these phenotypic changes were restricted to P1E/Kd-specific T lymphocytes (Fig. 3A and B) and correlated with strong cell proliferation (Fig. 3C).
Figure 3.
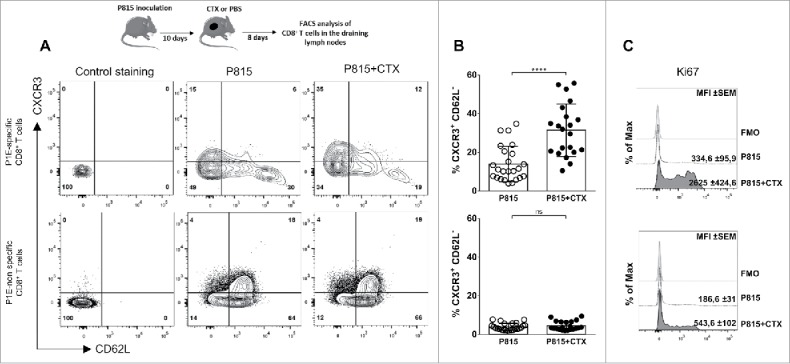
P1E-specific CD8+ T cells acquire functional properties in the draining lymph nodes following cyclophosphamide treatment. DBA/2 mice were inoculated s.c. with 2 × 10⁶ P815 P1.HTR tumor cells and treated i.p. with CTX (3 mg) or PBS 10 d later. Cells were harvested and analyzed 8 d after CTX injection. Representative flow cytometry plots (A) and quantification of CXCR3+ CD62L− cells (B) from draining lymph nodes (P1E/H-2Kd)+ or − CD8+ T cells. (C) Histograms of Ki67 expression on CXCR3+ CD62L− cells among (P1E/H-2Kd)+ or − CD8+ T cells. Values indicate mean fluorescence intensity (MFI) and standard error. Data are representative of (A, C) single individuals in each treatment group or (B) display individual determinations from three independent experiments with 6–8 mice per group (each data point represents one mouse). Statistical significance was determined by the unpaired t test. FMO = full minus one, means that all antibodies were present in the staining cocktail, except those of interest. *p < 0.05; **p < 0.01; ***p < 0.001; ****p < 0.0001; ns, not significant.
Collectively, these observations show that lymph node-resident (P1E/Kd)+ and tumor-infiltrating CD8+ T lymphocytes exhibited different phenotypic and functional properties in PBS vs. cyclophosphamide-treated mice, suggesting differential programming of exhausted and effector cells, respectively.
Role of the cytokinic environment
We next examined the potential contribution of homeostatic cytokines which have been shown to favor the differentiation of effector-type CD8+ T lymphocytes. qPCR analysis for IL-7 and IL-15 was performed on total regressing and progressing tumors and draining LNs. The level of IL-7 mRNA was increased by 2-to-3-fold in draining LNs and in the tumor after CTX treatment, whereas IL-15 mRNA levels were increased by 17-fold in tumors but remained unchanged in LNs (Fig. 4A). However, injection of neutralizing anti-IL-7 and/or anti-IL-15 mAbs did not alter tumor growth (Figs. 4B, D and S3A) and did not prevent tumor rejection (Figs. 4C, D and S3B) after cyclophosphamide treatment. These data, although difficult to interpret because of the lack of experimental evidence for the neutralizing capacity of the mAbs, may suggest that IL-7 and/or IL-15 were not critical for cyclophosphamide-induced tumor destruction.
Figure 4.
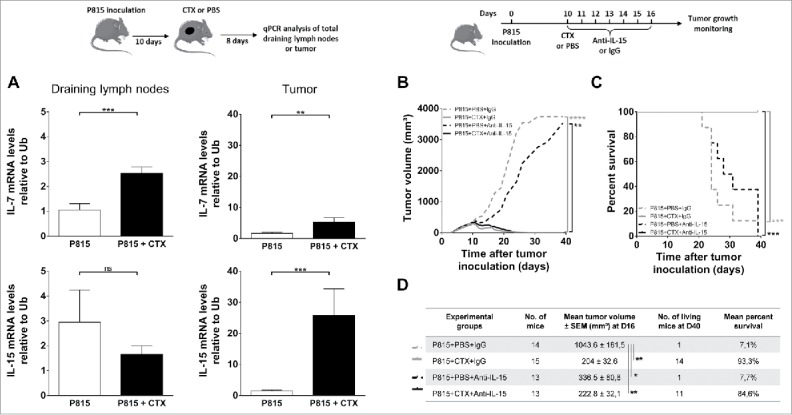
Role of homeostatic cytokines in CTX-induced tumor rejection. DBA/2 mice were inoculated s.c. with 2 × 10⁶ P815 P1.HTR tumor cells and treated i.p. with CTX (1.5 or 3 mg) or PBS 10 d later. Draining lymph nodes and tumor cells were harvested and analyzed 8 d after CTX injection. (A) Relative mRNA levels of IL-7 and IL-15 to Ubiquitin in draining lymph nodes and tumors. Data represent the mean ± SEM from three to five experiments with 2–7 mice per group. Statistical significance was determined by the Mann–Whitney test. (B–D) Effect of IL-15 blockade on tumor growth (B, D) and survival (C, D). 10 d after tumor inoculation, mice were treated i.p. with CTX (1.5 mg) or PBS, and blocking antibodies to IL-15 or rat isotype-matched control Igs (25 µg every other day from day 10 to 16). Data are representative of (B, C) one experiment or (D) display the summary of two independent experiments with 6–9 mice per group. Statistical significance was determined by the Kruskal-Wallis (B, D) or Log-rank tests (C). *p < 0.05; **p < 0.01; ***p < 0.001; ****p < 0.0001; ns, not significant.
Another cytokine candidate was IFN (interferon)-I, as (i) it acts as a fate determining differentiation factor for CD8+ T cells and (ii) a link has been established between IL-15 and IFN-I in potentiating the cross-presenting capacity of dendritic cells.17,18 Supporting a potential role for IFN-I, the expression of IRF7 mRNA in the tumor, but not in the draining LNs, was increased by 10-fold in CTX-treated mice (Fig. 5A). Administration of neutralizing anti-IFNAR1 inhibited partially the CTX-induced control of P815 growth, decreasing its therapeutic efficacy in approximately 50% of treated mice, but did not affect survival significantly (Fig. 5B–D). Injection of anti-IFNAR1 alone did not change tumor growth, indicating that the beneficial effect of IFN was dependent on CTX treatment (Fig. S3C and D).
Figure 5.

Role of the cytokinic environment in CTX-induced tumor rejection. DBA/2 mice were inoculated s.c. with 2 × 10⁶ P815 P1.HTR tumor cells and treated i.p. with CTX (1.5 or 3 mg) or PBS 10 d later. Draining lymph nodes and tumor cells were harvested and analyzed 8 d after CTX injection. (A) Relative mRNA levels of IRF7 to Ubiquitin in draining lymph nodes and tumors. Data are from three to four independent experiments with 2–6 mice per group. Statistical significance was determined by the Mann–Whitney test. (B–E) Effect of IFNAR1 blockade on tumor growth (B, D), survival (C, D) and proportion of P1E-specific cells among CD8+ T cells in draining lymph nodes or tumors (E). 10 d after tumor inoculation, mice were treated i.p. with CTX (1.5 mg) or PBS, and with blocking antibodies to IFNAR1 or rat isotype-matched control Igs (500 µg at day 10, followed by 250 µg at days 12, 14 and 17). 8 d after the beginning of the treatment, the frequencies of (P1E/H-2Kd)+ cells were analyzed ex vivo by flow cytometry (E). Data are representative of (B, C) one experiment or (D, E) display the summary of 3–5 independent experiments with 3–13 mice per group. Statistical significance was determined by the Kruskal–Wallis (B, D, E) or Log-rank tests (C). (F) Normalized PD-1 expression on tumor infiltrating (P1E/H-2Kd)+ CD8+ T cells. Data are representative of five independent experiments with 3–13 mice per group. Statistical significance was determined by the Kruskal–Wallis test. MFI is expressed as arbitrary units normalized for each experiment and arbitrarily set at 100. (G) Representative flow cytometry plots showing KLRG1 vs. PD-1 expression by tumor infiltrating (P1E/H-2Kd)+ CD8+ T cells (two independent experiments with 6–13 mice per group). *p < 0.05; **p < 0.01; ***p < 0.001; ****p < 0.0001; ns, not significant.
The proportion of (P1E/H-2Kd)+ among CD8+ T lymphocytes was significantly decreased in tumors of mice treated with anti-IFNAR1 mAb and CTX, as compared with mice treated with CTX alone, pointing to a role for IFN-I in their expansion/recruitment in the tumor bed (Fig. 5E). Noteworthy, the expression of PD-1 on (P1E/H-2Kd)+ CD8+ T cells was upregulated significantly in the group treated with anti-IFNAR1 mAb and CTX (as compared with CTX alone), whereas the expression of KLRG-1 remained unchanged in the same conditions (Fig. 5F and G). Collectively, these observations define a functional relationship between IFN-I and CTX treatment in modulating T cell function/exhaustion.
Discussion
To define the mechanism(s) by which CTX boosts immune rejection of tumors, we took advantage of a murine model (P815 mastocytoma originally induced by methylcholanthrene in DBA/2 mice), which allows the identification of two subsets of CD8+ T lymphocytes recognizing distinct peptide/MHC complexes and responding differentially to chemotherapy. Our data indicate that CTX selectively potentiates the immune response specific for the “mutated” P1E antigen by inducing the differentiation of (P1E/H-2Kd)+ CD8+ T lymphocytes displaying features of terminal effector cells. IFN-I is at least partially required for optimal effector function of (P1E/H-2Kd)+ CD8+ T cells in the tumor bed, as its neutralization in vivo limits the CTX-induced control of mastocytoma growth, reduces their infiltration in the tumor and upregulates their PD-1 expression. Whether this beneficial effect of IFN-I on CD8+ T cell phenotype is linked to its known potentiating effect on immunogenic cell death and/or cross-presentation (for review, see Ref. [19]) or to another mechanism will require further investigation.
Our observations demonstrate that chemotherapy may remodel the tumor-specific immune response, although additional experiments using various chemotherapeutic regimens and several murine tumor models are required to support this conclusion. In the tumors of untreated mice, (P1E/H-2Kd)-specific CD8+ T cells expressed phenotypic features of dysfunctional T cells, i.e. high levels of PD-1, LAG-3 and TIGIT and limited capacity to kill. A novel subset arose after CTX treatment, distinguishable by higher expression of KLRG-1 and lower expression of PD-1. Several reports characterize KLRG-1hi cells as terminal effector cells, as opposed to exhausted and memory cells.12,14,20,21 The suppressive role of PD-1 has been amply documented,22,23 whereas the function of KLRG-1 remains elusive. Intriguingly, KLRG-1 has been shown to bind cadherins and associate with SHIP-1,24 and its signaling has been associated with CD8+ functional defects,25 suggesting a negative regulatory function.
It is noteworthy that the infiltration of (P1E/H-2Kd)+ effector cells into regressing tumors correlated with an enhanced proportion of (P1E/H-2Kd)+ CXCR3+ CD62L− cells in the draining LNs, a phenotype of effector cells ready to home to peripheral inflammatory sites. The efficient immune response induced by cyclophosphamide treatment probably results from combined effects, linked to lymphopenia and inflammation, such as (i) immunogenic death of tumor cells (enhancing tumor antigen presentation); (ii) increased number of inflammatory monocytes; (iii) apoptosis of antigen-specific exhausted lymphocytes in tumor bed (which are barely detectable until day 7 after treatment, not depicted); (iv) increased proliferation of tumor-specific lymphocytes in tumor and draining LNs; (v) expression of chemokines within the tumor, favoring the recruitment of activated (CXCR3+ CD62L−) P1E-specific T cells (this report and11). An interesting hypothesis would be a direct effect of cyclophosphamide on T cells displaying different sensitivity to the apoptotic effect of cyclophosphamide. Our observations (not depicted), however, did not show a differential expression of the detoxifying enzyme ALDH.26
Our data are in accordance with a previous report showing that CTX induced type I IFN in vivo, resulting in enhanced expansion and survival of CD44hi T cells,27 and further show that the phenotype of tumor-specific CD8+ T lymphocytes is profoundly affected. The increased proportion of tumor-specific CD8+ T cells and the downregulation of PD-1 appeared dependent, at least partially, on IFN-I. The role of IFN-I in tumor immune resistance has been recently highlighted (for a review, see Ref. [28]). A type-I IFN signature has been shown to correlate with (i) enhanced T cell infiltration in melanoma patients and expression of chemokine genes29; (ii) increased cross-priming by APCs,18,30 an observation in line with our recent report of a 100-fold increase in the proportion of (presumably inflammatory) dendritic cells in tumor draining LNs after CTX treatment11; (iii) enhanced persistence and effector functions of cytotoxic cells.31
Although our observations do not support a role for IL-7 and IL-15, it is conceivable that lymphopenia may boost tumor-specific immunity through the availability of “empty niches” and/or the production of immunostimulatory cytokines (for a review, see Ref. [32]).
The change in the tumor-specific CD8+ T cell repertoire, as reported previously (see Fig. 3B in11), was intriguing. The proportion of (P1E/H-2Kd)-specific CD8+ T cells increased by 2-fold reaching 40% of all CD8+ T cells in tumors, whereas the proportion of (P1A/H-2Ld)-specific CD8+ T lymphocytes declined after CTX injection. Of note, the proportion of (P1A/H-2Ld)+ CD8+ T cells was higher in mice genetically deficient for P1A (not depicted), but still decreased after CTX, indicating that the thymic negative selection was not solely responsible for the alteration of the repertoire. These observations concur with the notion that tumor antigens encoded by a mutated gene may represent more suitable targets for an efficient antitumor immunity, a hypothesis supported by experimental observations in patients. Indeed, the success of the PD-1 blockade therapy was associated with neoantigen-specific T cells responses.33,34
A major objective of immunotherapy is to induce durable immune memory. We have shown previously that a single injection of CTX rendered 100% of mice resistant to a second lethal injection of P815.11 Of note, a recent study by Wherry and colleagues indicates that T cells re-invigorated after PD-1 blockade became re-exhausted and failed to become memory T cells, due to epigenetic stability.35 Whether CTX programs tumor-specific cells into effector as well as memory cells is presently unclear and requires further investigation. The comparison of the cell fate induced by chemotherapy vs. checkpoint blockade may help to clarify this issue.
In conclusion, our observations indicate that CTX treatment favors immune rejection of P815 tumors quantitatively (by inducing the expansion of tumor-specific CD8+ T cells and their trafficking to tumor bed,11) and qualitatively (by programming selected tumor-specific cells into effector/memory cells, this report).
Materials and methods
Mice
DBA/2 Ola Hsd mice were purchased from Envigo (Horst, The Netherlands). Mice were housed under specific pathogen-free conditions and used at 6–9 weeks of age. The experiments were performed in compliance with the relevant laws and institutional guidelines and were approved by the Local Committee.
Antigens
P1A (LPYLGWLVF) and P1E (GYCGLRGTGV) peptides were provided by Dr. Catherine Uyttenhove (UCL, Belgium).
Tumor inoculation and in vivo treatment
The murine mastocytoma cell line P815 (clone P1.HTR) was provided by Dr. Catherine Uyttenhove (UCL, Belgium). DBA/2 mice were injected subcutaneously (s.c.) with 2⋅106 P815 cells in the flank. When indicated, mice were injected intraperitoneally (i.p.) with cyclophosphamide (CTX) monohydrate (Sigma-Aldrich, 150 mg/kg, at day 10 after tumor inoculation) and/or with : anti-mouse IFNAR-1 (clone MAR1-5A3, BioXCell, 500 µg at day 10 after tumor inoculation, followed by 250 µg at days 12, 14 and 17), anti-mouse IL-7Rα (clone A7R34, BioXCell, 450 µg every other day from day 10 to day 16 after tumor inoculation), anti-mouse IL-15 (clone AIO.3, eBioscience, 25 µg every day from day 10 to day 16 after tumor inoculation). Control mice were injected with rat IgG (Sigma-Aldrich).
Tumor monitoring
Mice were monitored every 2 d for tumor growth for at least 1.5 mo after tumor inoculation. Tumor volume (mm3) is expressed as (A × B2)/2, where A and B represent tumor length and width, respectively.
Flow cytometry
Tumors were treated with DNAse I and Liberase (Roche) and viable cells were enriched on density gradient Lymphoprep (Stemcell technologies). Lymph node or tumor cells were incubated with previously established, optimal concentrations of P1A/H-2Ld-PE or P1E/H-2Kd-PE (provided by Pr. Stefan Constantinescu and Didier Colau (UCL, Belgium)) conjugated tetramers and directly conjugated monoclonal antibodies from BD Biosciences: anti-CD8α (clone 53–6.7), TCRβ (clone H57–597), CD27 (clone LG.7F9), CD62L (clone MEL-14), CD183 (clone CXCR3-173), KLRG-1 (clone 2F1), LAG-3 (clone C9B7W), PD-1 (clone J43). Non-specific, Fc-mediated interactions were blocked by the addition of unconjugated, purified anti-murine CD16/CD32 (2.4G2, BioXCell) to the staining media. Cells were then fixed in buffer containing 1% paraformaldehyde and analyzed by flow cytometry (FACS Canto II, BD Biosciences). For intracellular staining, cells were incubated with a fixing solution (Fixation/Permeabilization from eBioscience) and stained with directly conjugated monoclonal antibodies anti-Eomes (clone Dan11mag) and anti-Ki67 (clone B56). Analyses were performed with the FlowJo Software (Tree star).
In vivo CTL assay
Splenocytes from naive DBA/2 mice were pulsed or not with P1A (10 µg/mL) or P1E (10 µg/mL) peptides for 1 h at 37°C. Cells were then labeled with 5,6-carboxyfluorescein diacetate succinimidyl ester (CFSE, Sigma) at a concentration of 5 µM (pulsed) or 0.5 µM (unpulsed) and injected at a 1:1 ratio (total of 4.107 cells) i.v. in tumor-bearing mice treated or not with CTX. Naive mice were injected as controls. CFSE+ cells were analyzed by flow cytometry 48 h later in LNs draining the tumor. The percentage of antigen-specific lysis in vivo was calculated as follows: (1-[(number of CFSEhigh cells/number of CFSElow cells) divided by (number of CFSEhigh cells naive/number of CFSElow cells naive)]) × 100.
Quantitative RT-PCR
RNA was extracted using the TRIzol method (Invitrogen) and reverse transcribed with Superscript II reverse transcriptase (Invitrogen) according to the manufacturer's instructions. Quantitative real-time RT-PCR was performed using the SYBR Green Master mix kit (ThermoFisher) and StepOne Plus system (Applied Biosystems). Amplification reactions were conducted for 40 PCR cycles (each cycle: 95°C for 15 sec, 60°C for 1 h). The following RT PCR primers were used: IL-7, forward 5′-GCAGACCATGTTCCATGTTTC, and reverse 5′-ACAGGCAGCAGAACAAGGAT; IL-15, forward 5′-CCAGCTCATCTTCAACATTGA, and reverse 5′-AGCACGAGATGGATGTATTCC; IRF7, forward 5′-TGCAGTACAGCCACATACTGG, and reverse 5′-CCTCGTAAACACGGTCTTGC; Ubiquitin, forward 5′-CGTCTGAGGGGTGGCTATTA, and reverse 5′-TAAATTGGGGCAAGTGGCTA. Transcript amounts were calculated by using a standard curve and normalized to Ubiquitin-transcripts used as a housekeeping gene.
Measurement of single-cell gene-expression levels
Single P1E/H-2Kd-specific, TCRβ and CD8-expressing T cells were sorted using a FACSAria (BD Biosciences) into 96 well-plate containing 5 µL Cellulyser Micro lysis buffer (TATAA Biocenter). After cell sorting, samples were centrifuged and stored at −20°C. Samples were reverse-transcribed into cDNA using the cDNA synthesis kit Grand Script cDNA synthesis kit (TATAA Biocenter) (22°C for 5 min, 42°C for 30 min, 85°C for 5 min and 4°C for hold). Samples were then stored at −20°C. 90 samples were centrifuged and a mix containing all primers of interest was added to a final primer concentration of 40–50 nM. Samples were preamplified using the TATAA Preamp GrandMaster Mix 2X (TATAA Biocenter) for one denaturation step (95°C for 3 min) and 20 PCR cycles (each cycle: 95°C for 20 s, 60°C for 3 min and 72°C for 20 s). The resultant preamplified single-cell cDNA was directly stored at −80°C until analysis. Each cDNA sample was diluted 80 times and 4.5 µL of each sample then combined with 5.5 µL of a mixture containing 5 µL SsoFast EvaGreen Supermix with low ROX (BioRad) and 0.5 µL 20X DNA Binding Dye (Fluidigm). Each Fw and Rev primers (10 µM) of interest (3 µL) were mixed with 3 µL 2X Assay Loading Reagent (Fluidigm) into another 96 well plate to achieve final primer concentration of 500 nM in qPCR. After priming the BioMark 96.96 IFC chip (Fluidigm) with oil, 5 μL of each assay and 5 μL of each sample were pipetted into their respective inlets on the IFC and the loading was run by choosing; HX: LoadMix (136X). After loading, the IFC chip was placed into the BioMark HD and the thermal protocol was selected (GE Fast 96 × 96 PCR+Melt v2.pcl); 30 PCR cycles each composed of one denaturation phase at 96°C for 5 s and one annealing phase at 65°C for 20 s were performed. The used RT PCR primers can be obtained upon request.
Data collection and analysis for gene-expression comparison
Single-cell PCR data were analyzed using the Fluidigm real-time PCR analysis software (Fluidigm) and GenEx software. The experiment was composed of two positive controls containing 100 cells and two negative controls without cell which were analyzed. Hierarchical clustering, Scatter Plot correlation and PCA were performed by using GenEx software. Violin Plot was obtained by “R” software. 94 genes that were considered to be important for T cell differentiation, proliferation, apoptosis, exhaustion, transcription and cytokine production were examined. Four genes (CD3e, CD8α, CD4 and Ub) were considered for internal positive and negative controls, but Ub was not finally chosen because its expression was not stable. Nine genes (IL-6, IL-6Rα, IL-9, CD44, VEGFR1, VEGFR2, CD62L, CXCR3 and CD103) were excluded from the analysis because these genes were not expressed in any of the single-cell samples. Hierarchical clustering and Violin Plot were performed for the remaining 85 genes. 29 additional genes (IL-2, CD73, KLRG-1, HIF-3a, c-Maf, CD57, CD38, GOS2, IL-10, CD4, BTLA, PGC-1b, IL-7R, IFNb1, CD19, IL-2Ra, HIF-2a, IL-12Rb2, IL-15Ra, CCR7, Bcl6, TFAM, IFNAR1, Got1, Fas, CD160, FOXO-1, Ulk1, TCF7) were excluded from the analysis because these genes were not expressed in more than 40% of the single-cell samples. Scatter Plot correlation and PCA were performed for the remaining 56 genes that were differentially expressed in single cells.
Statistical analyses
Data sets were tested for Gaussian distribution using the D'Agostino-Pearson normality test. Statistical significance was determined by parametric tests: unpaired t test for two-tailed data and ANOVA test followed by selected comparison by Tukey's multiple comparison tests. Statistical significance was determined by nonparametric tests: Mann–Whitney test for two-tailed data and Kruskal–Wallis test followed by selected comparison by Dunn's multiple comparison tests. Survival was analyzed by the Kaplan–Meier method using Log-rank test. (*p < 0.05; **p < 0.01; ***p < 0.001; ****p < 0.0001; ns, no significantly different.)
Supplementary Material
Disclosure of potential conflicts of interest
No potential conflicts of interest were disclosed.
Acknowledgments
The authors thank Stanislas Goriely (ULB) and Pierre Coulie (UCL) for interesting suggestions, Fabienne Andris, Guillaume Oldenhove, Aurélie Detavernier, Martina Fontaine and Valérie Acolty (ULB) for valuable help, Thierry Voet (KUL) for giving us access to IFC Controller HX and BioMark HD facility, Koen Theunis (KUL) for his help with Fluidigm instruments and Caroline Abdelaziz (ULB) and Véronique Dissy (ULB) for mouse husbandry.
Funding
This work was supported by grants from the Fonds National de la Recherche Scientifique (FNRS), the Fondation Rose et Jean Hoguet, the Fondation contre le Cancer, the Interuniversity Attraction Pole (IAP) Program, the European Regional Development Fund (ERDF) and the Walloon Region.
References
- 1.Abu Eid R, Razavi GSE, Mkrtichyan M, Janik J, Khleif SN. Old-school chemotherapy in immunotherapeutic combination in cancer, a low-cost drug repurposed. Cancer Immunol Res 2016; 4:377-82; PMID:27196429; https://doi.org/ 10.1158/2326-6066.CIR-16-0048 [DOI] [PubMed] [Google Scholar]
- 2.Suzuki E, Sun J, Kapoor V, Jassar AS, Albelda SM. Gemcitabine has significant immunomodulatory activity in murine tumor models independent of its cytotoxic effects. Cancer Biol Ther 2007; 6:880-5; PMID:17582217; https://doi.org/ 10.4161/cbt.6.6.4090 [DOI] [PubMed] [Google Scholar]
- 3.Denkert C, Loibl S, Noske A, Roller M, Muller BM, Komor M, Budczies J, Darb-Esfahani S, Kronenwett R, Hanusch C et al.. Tumor-associated lymphocytes as an independent predictor of response to neoadjuvant chemotherapy in breast cancer. J Clin Oncol 2010; 28:105-13; PMID:19917869; https://doi.org/ 10.1200/JCO.2009.23.7370 [DOI] [PubMed] [Google Scholar]
- 4.Fridman WH, Galon J, Pagès F, Tartour E, Sautès-Fridman C, Kroemer G. Prognostic and predictive impact of intra- and peritumoral immune infiltrates. Cancer Res 2011; 71:5601-5; PMID:21846822; https://doi.org/ 10.1158/0008-5472.CAN-11-1316 [DOI] [PubMed] [Google Scholar]
- 5.Galluzzi L, Buqué A, Kepp O, Zitvogel L, Kroemer G. Immunological effects of conventional chemotherapy and targeted anticancer agents. Cancer Cell 2015; 28:690-714; PMID:26678337; https://doi.org/ 10.1016/j.ccell.2015.10.012 [DOI] [PubMed] [Google Scholar]
- 6.Hanoteau A, Henin C, Moser M. The interplay of immunotherapy and chemotherapy, a novel approach. Méd Sci M/S 2016; 32:353-61; PMID:27137692; https://doi.org/ 10.1051/medsci/20163204013 [DOI] [PubMed] [Google Scholar]
- 7.Ge Q, Hu H, Eisen HN, Chen J. Different contributions of thymopoiesis and homeostasis-driven proliferation to the reconstitution of naive and memory T cell compartments. PNAS 2002; 99:2989-94; PMID:11880642; https://doi.org/ 10.1073/pnas.052714099 [DOI] [PMC free article] [PubMed] [Google Scholar]
- 8.Gattinoni L, Finkelstein SE, Klebanoff CA, Antony PA, Palmer DC, Spiess PJ, Hwang LN, Yu Z, Wrzesinski C, Heimann DM et al.. Removal of homeostatic cytokine sinks by lymphodepletion enhances the efficacy of adoptively transferred tumor-specific CD8+ T cells. J Exp Med 2005; 202:907-12; PMID:16203864; https://doi.org/ 10.1084/jem.20050732 [DOI] [PMC free article] [PubMed] [Google Scholar]
- 9.Goldrath AW, Bogatzki LY, Bevan MJ. Naive T cells transiently acquire a memory-like phenotype during homeostasis-driven proliferation. J Exp Med 2000; 192:557-64; PMID:10952725; https://doi.org/ 10.1084/jem.192.4.557 [DOI] [PMC free article] [PubMed] [Google Scholar]
- 10.Bilsborough J, Van Pel A, Uyttenhove C, Boon T, Van den Eynde BJ. Identification of a second major tumor-specific antigen recognized by CTLs on mouse mastocytoma P815. J Immunol 1999; 162:3534-40; PMID:10092811; http://www.jimmunol.org/content/162/6/3534 [PubMed] [Google Scholar]
- 11.Rahir G, Wathelet N, Hanoteau A, Henin C, Oldenhove G, Galuppo A, Lanaya H, Colau D, Mackay CR, Van den Eynde B et al.. Cyclophosphamide treatment induces rejection of established P815 mastocytoma by enhancing CD4 priming and intratumoral infiltration of P1E/H-2K(d) -specific CD8+ T cells. Int J Cancer 2014; 134:2841-52; PMID:24249003; https://doi.org/ 10.1002/ijc.28617 [DOI] [PubMed] [Google Scholar]
- 12.Sarkar S, Kalia V, Haining WN, Konieczny BT, Subramaniam S, Ahmed R. Functional and genomic profiling of effector CD8 T cell subsets with distinct memory fates. J Exp Med 2008; 205:625-40; PMID:18316415; https://doi.org/ 10.1084/jem.20071641 [DOI] [PMC free article] [PubMed] [Google Scholar]
- 13.Wiesel M, Crouse J, Bedenikovic G, Sutherland A, Joller N, Oxenius A. Type-I IFN drives the differentiation of short-lived effector CD8+ T cells in vivo. Eur J Immunol 2012; 42:320-9; PMID:22102057; https://doi.org/ 10.1002/eji.201142091 [DOI] [PubMed] [Google Scholar]
- 14.Apetoh L, Smyth MJ, Drake CG, Abastado J-P, Apte RN, Ayyoub M, Blay J-Y, Bonneville M, Butterfield LH, Caignard A et al.. Consensus nomenclature for CD8(+) T cell phenotypes in cancer. Oncoimmunology 2015; 4:e998538; PMID:26137416; https://doi.org/ 10.1080/2162402X.2014.998538 [DOI] [PMC free article] [PubMed] [Google Scholar]
- 15.Cruz-Guilloty F, Pipkin ME, Djuretic IM, Levanon D, Lotem J, Lichtenheld MG, Groner Y, Rao A. Runx3 and T-box proteins cooperate to establish the transcriptional program of effector CTLs. J Exp Med 2009; 206:51-9; PMID:19139168; https://doi.org/ 10.1084/jem.20081242 [DOI] [PMC free article] [PubMed] [Google Scholar]
- 16.Boissonnas A, Fetler L, Zeelenberg IS, Hugues S, Amigorena S. In vivo imaging of cytotoxic T cell infiltration and elimination of a solid tumor. J Exp Med 2007; 204:345-56; PMID:17261634; https://doi.org/ 10.1084/jem.20061890 [DOI] [PMC free article] [PubMed] [Google Scholar]
- 17.Schiavoni G, Sistigu A, Valentini M, Mattei F, Sestili P, Spadaro F, Sanchez M, Lorenzi S, D'Urso MT, Belardelli F et al.. Cyclophosphamide synergizes with type I interferons through systemic dendritic cell reactivation and induction of immunogenic tumor apoptosis. Cancer Res 2011; 71:768-78; PMID:21156650; https://doi.org/ 10.1158/0008-5472.CAN-10-2788 [DOI] [PubMed] [Google Scholar]
- 18.Greyer M, Whitney PG, Stock AT, Davey GM, Tebartz C, Bachem A, Mintern JD, Strugnell RA, Turner SJ, Gebhardt T et al.. T cell help amplifies innate signals in CD8(+) DCs for optimal CD8(+) T cell priming. Cell Rep 2016; 14:586-97; PMID:26774484; https://doi.org/ 10.1016/j.celrep.2015.12.058 [DOI] [PubMed] [Google Scholar]
- 19.Zitvogel L, Galluzzi L, Kepp O, Smyth MJ, Kroemer G. Type I interferons in anticancer immunity. Nat Rev Immunol 2015; 15:405-14; PMID:26027717; https://doi.org/ 10.1038/nri3845 [DOI] [PubMed] [Google Scholar]
- 20.Olson JA, McDonald-Hyman C, Jameson SC, Hamilton SE. Effector-like CD8+ T cells in the memory population mediate potent protective immunity. Immunity 2013; 38:1250-60; PMID:23746652; https://doi.org/ 10.1016/j.immuni.2013.05.009 [DOI] [PMC free article] [PubMed] [Google Scholar]
- 21.Chu HH, Chan S-W, Gosling JP, Blanchard N, Tsitsiklis A, Lythe G, Shastri N, Molina-París C, Robey EA. Continuous effector CD8(+) T cell production in a controlled persistent infection is sustained by a proliferative intermediate population. Immunity 2016; 45:159-71; PMID:27421704; https://doi.org/ 10.1016/j.immuni.2016.06.013 [DOI] [PMC free article] [PubMed] [Google Scholar]
- 22.Ahmadzadeh M, Johnson LA, Heemskerk B, Wunderlich JR, Dudley ME, White DE, Rosenberg SA. Tumor antigen-specific CD8 T cells infiltrating the tumor express high levels of PD-1 and are functionally impaired. Blood 2009; 114:1537-44; PMID:19423728; https://doi.org/ 10.1182/blood-2008-12-195792 [DOI] [PMC free article] [PubMed] [Google Scholar]
- 23.Odorizzi PM, Pauken KE, Paley Ma, Sharpe A, Wherry EJ. Genetic absence of PD-1 promotes accumulation of terminally differentiated exhausted CD8+ T cells. J Exp Med 2015; 212:1125-37; PMID:26034050; https://doi.org/ 10.1084/jem.20142237 [DOI] [PMC free article] [PubMed] [Google Scholar]
- 24.Tessmer MS, Fugere C, Stevenaert F, Naidenko OV, Chong HJ, Leclercq G, Brossay L. KLRG1 binds cadherins and preferentially associates with SHIP-1. Int Immunol 2007; 19:391-400; PMID:17307799; https://doi.org/ 10.1093/intimm/dxm004 [DOI] [PubMed] [Google Scholar]
- 25.Henson S, Franzese O, Macaulay R, Libri V, Azevedo R, Kiani-Alikhan S, Plunkett F, Masters J, Jackson S, Griffiths S et al.. KLRG-1 signalling induced proliferative dysfunction and defective Aktser473 phosphorylation in highly differentiated human CD8+ T cells. Blood 2009; 113:1-3; PMID:19406987; https://doi.org/ 10.1182/blood-2009-01-199588 [DOI] [PubMed] [Google Scholar]
- 26.Kanakry CG, Ganguly S, Luznik L. Situational aldehyde dehydrogenase expression by regulatory T cells may explain the contextual duality of cyclophosphamide as both a pro-inflammatory and tolerogenic agent. Oncoimmunology 2015; 4:e974393; PMID:25949893; https://doi.org/ 10.4161/2162402X.2014.974393 [DOI] [PMC free article] [PubMed] [Google Scholar]
- 27.Schiavoni G, Mattei F, Di Pucchio T, Santini SM, Bracci L, Proietti E, Belardelli F. Cyclophosphamide induces type I interferon and augments the number of CD44 hi T lymphocytes in mice: implications for strategies of chemoimmunotherapy of cancer. Blood 2000; 95:2024-30; PMID:10706870; http://www.bloodjournal.org/content/95/6/2024 [PubMed] [Google Scholar]
- 28.Corrales L, McWhirter SM, Dubensky TW, Gajewski TF. The host STING pathway at the interface of cancer and immunity. J Clin Invest 2016; 126:2404-11; PMID:27367184; https://doi.org/ 10.1172/JCI86892 [DOI] [PMC free article] [PubMed] [Google Scholar]
- 29.Harlin H, Meng Y, Peterson AC, Zha Y, Tretiakova M, Slingluff C, McKee M, Gajewski TF. Chemokine expression in melanoma metastases associated with CD8+ T-cell recruitment. Cancer Res 2009; 69:3077-85; PMID:19293190; https://doi.org/ 10.1158/0008-5472.CAN-08-2281 [DOI] [PMC free article] [PubMed] [Google Scholar]
- 30.Fuertes MB, Kacha AK, Kline J, Woo S-R, Kranz DM, Murphy KM, Gajewski TF. Host type I IFN signals are required for antitumor CD8+ T cell responses through CD8α+ dendritic cells. J Exp Med 2011; 208:2005-16; PMID:21930765; https://doi.org/ 10.1084/jem.20101159 [DOI] [PMC free article] [PubMed] [Google Scholar]
- 31.Sikora AG, Jaffarzad N, Hailemichael Y, Gelbard A, Stonier SW, Schluns KS, Frasca L, Lou Y, Liu C, Andersson HA et al.. IFN-a enhances peptide vaccine-induced CD8+ T cell numbers, effector function, and antitumor activity. J Immunol 2009; 182:7398-407; PMID:19494262; https://doi.org/ 10.4049/jimmunol.0802982 [DOI] [PMC free article] [PubMed] [Google Scholar]
- 32.Hanoteau A, Moser M. Chemotherapy and immunotherapy: a close interplay to fight cancer? Oncoimmunology 2016; 5:e1190061; PMID:27622046; https://doi.org/ 10.1080/2162402X.2016.1190061 [DOI] [PMC free article] [PubMed] [Google Scholar]
- 33.Gros A, Parkhurst MR, Tran E, Pasetto A, Robbins PF, Ilyas S, Prickett TD, Gartner JJ, Crystal JS, Roberts IM et al.. Prospective identification of neoantigen-specific lymphocytes in the peripheral blood of melanoma patients. Nat Med 2016; 22:433-8; PMID:26901407; https://doi.org/ 10.1038/nm.4051 [DOI] [PMC free article] [PubMed] [Google Scholar]
- 34.Rizvi NA, Hellmann MD, Snyder A, Kvistborg P, Makarov V, Havel JJ, Lee W, Yuan J, Wong P, Ho TS et al.. Mutational landscape determines sensitivity to PD-1 blockade in non-small cell lung cancer. Science 2015; 348:124-8; PMID:25765070; https://doi.org/ 10.1126/science.aaa1348 [DOI] [PMC free article] [PubMed] [Google Scholar]
- 35.Pauken KE, Sammons MA, Odorizzi PM, Manne S, Godec J, Khan O, Drake AM, Chen Z, Sen D, Kurachi M et al.. Epigenetic stability of exhausted T cells limits durability of reinvigoration by PD-1 blockade. Science 2016; 2807:1-10; PMID:27789795; https://doi.org/ 10.1126/science.aaf2807 [DOI] [PMC free article] [PubMed] [Google Scholar]
Associated Data
This section collects any data citations, data availability statements, or supplementary materials included in this article.