

Summary
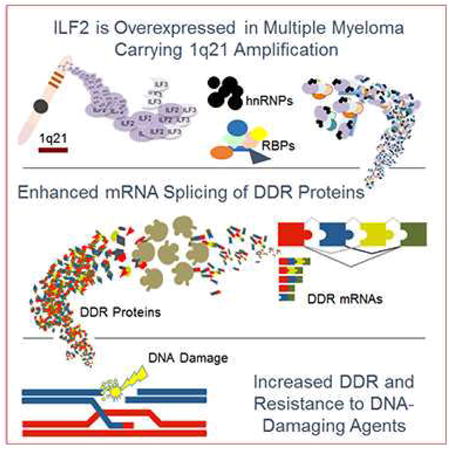
Amplification of 1q21 occurs in approximately 30% of de novo and 70% of relapsed multiple myeloma (MM) and is correlated with disease progression and drug resistance. Here, we provide evidence that the 1q21 amplification-driven overexpression of ILF2 in MM promotes tolerance of genomic instability and drives resistance to DNA-damaging agents. Mechanistically, elevated ILF2 expression exerts resistance to genotoxic agents by modulating YB-1 nuclear localization and interaction with the splicing factor U2AF65, which promotes mRNA processing and the stabilization of transcripts involved in homologous recombination in response to DNA damage. The intimate link between 1q21-amplified ILF2 and the regulation of RNA splicing of DNA repair genes may be exploited to optimize the use of DNA-damaging agents in patients with high-risk MM.
Graphical abstract
Marchesini et al. show that in multiple myeloma the overexpression of ILF2, resulting from chromosome 1q21 amplification, drives resistance to DNA-damaging agents partly by interaction with the splicing factor U2AF65 to promote the processing and stabilization of transcripts involved in homologous recombination.
Introduction
Multiple myeloma (MM) is a malignancy of terminally differentiated plasma cells that arise from the transformation of germinal center or post–germinal center B cells and home to and expand in the bone marrow (BM). The identification of the genetic elements driving disease initiation and progression and the way in which such genetic alterations functionally contribute to specific aspects of disease pathobiology, prognosis, and treatment responses (Chapman et al., 2011) has yielded significant therapeutic advances, with a near doubling of the median overall survival rate over the past decade (Kumar et al., 2014; Mahindra et al., 2012; Pozzi et al., 2013). However, some genetic alterations, especially the t(4;14), t(16;20), and t(14;16) translocations, the loss of the short arm of chromosome 17, and the amplification of chromosome 1q21, remain associated with a poorer outcome and represent independent adverse predictors of shorter progression-free and overall survival (Decaux et al., 2008; Grzasko et al., 2013; Kumar et al., 2009; Shaughnessy et al., 2007). High-risk smoldering and symptomatic MMs with these genetic alterations represent a subpopulation of newly diagnosed disease, but these subclasses of MM are overrepresented at relapse and contribute strongly to MM-related mortality (Nair et al., 2009; Neben et al., 2013).
The 1q21 amplification, which occurs in approximately 30% of de novo and 70% of relapsed MM, is among the most frequent chromosomal aberrations in MM and is considered a very high-risk genetic feature that is highly correlated with disease progression and drug resistance (An et al., 2014; Hanamura et al., 2006; Klein et al., 2011; Nemec et al., 2010; Wu et al., 2007b). The 1q21 amplicon spans a region of approximately 10-15 Mb and contains a large number of candidate genes (Carrasco et al., 2006) with known or suspected relevance to disease pathogenesis, including MUC1, MCL1, PDZK1, IL6R, BCL9, CKS1B, PSMD4, UBAP2L, and UBE2Q1 (Inoue et al., 2004; Mani et al., 2009; Shaughnessy et al., 2011; Stephens et al., 2012; Treon et al., 2000; Zhan et al., 2007; Zhang et al., 2002). To date, a clear understanding of the crucial driver oncogenes in the 1q21 amplicon has not been achieved; moreover, the absence of focal amplifications has supported the view that multiple drivers may contribute to poorer outcome and response to various therapeutic regimens. The identification of critical 1q21 cancer-relevant genes may yield potential therapeutic targets and provide a rationale for precision therapy for these patients who do not benefit from current treatments.
Here, we conducted a systematic shRNA screen to identify 1q21 candidate drivers whose extinction results in the selective death and/or growth inhibition of MM cells carrying the 1q21 amplification.
Results
1q21 shRNA Screen Identifies ILF2 as a MM-Critical Gene
To identify 1q21 MM-critical genes, we conducted a high-resolution analysis of recurrent copy number alterations and expression profiles in a collection of 254 MM samples included in the Multiple Myeloma Research Consortium database. To define the discrete minimal common 1q21 region that is recurrently amplified in MM, we used Genomic Identification of Significant Targets in Cancer (GISTIC2) (Mermel et al., 2011), a systematic method that identifies regions of the genome that are recurrently amplified or deleted across a set of samples (Figure 1A, Table S1). The integration of GISTIC2 and expression data from 246 matched MM samples yielded 78 1q21 genes that are either amplified or overexpressed (Table S1). These genes were enlisted into an in vitro screening strategy that employed a single-shRNA-per-96-well approach and a green fluorescent protein (GFP)-competitive cell growth assay to identify 1q21 genes whose loss of function resulted in the selective death and/or growth inhibition of MM cells carrying the 1q21 amplification (JJN3 cell line) but not MM cells without the 1q21 amplification (OCI-MY5 cell line) (Figure 1B) (Hanamura et al., 2006). Notably, both the JJN3 and OCI-MY5 cell lines overexpress c-MAF and lack p53, which are themselves associated with a more aggressive clinical course of the disease (Hanamura et al., 2006).
Figure 1. 1q21 shRNA Screen Identifies ILF2 as a MM-Critical Gene.
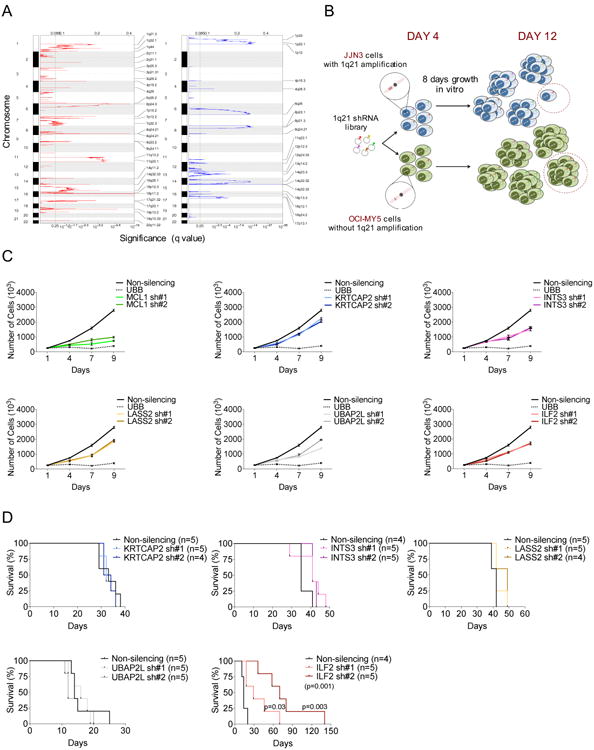
(A) GISTIC2 was used to identify chromosomal regions showing significant amplification (left) or deletion (right) in 254 MM patients. The green line indicates the significance threshold (q value of 0.25).
(B) Schematic representation of the screening strategy. A library of 532 GFP-positive shRNA vectors targeting the 78 amplified and overexpressed genes located in 1q21 and a GFP-competitive assay were used to identify genes whose loss of function resulted in the selective death and/or growth inhibition of MM cells carrying the 1q21 amplification (JJN3 cell line) but not MM cells without the 1q21 amplification (OCI-MY5 cell line) over a period of 8 days after the recovery from transduction.
(C) Representative growth curves of shRNA-transduced JJN3 cells. Every experiment was performed three times and included two different shRNAs per gene (sh#1 and sh#2), a non-silencing shRNA as a negative control, and an UBB-targeting shRNA as a positive control. All growth curves relative to each independent experiment were performed simultaneously (graphs were separated into six different panels). The mean and SD of duplicates from one representative experiment are shown.
(D) Survival curves of NOD/SCID mice injected subcutaneously with 1×10⁶ shRNA-transduced JJN3 cells (n=4 or 5 mice per group as indicated). Survival curves were analyzed by Mantel–Cox log-rank test.
After excluding shRNAs that were uniformly cytotoxic (e.g., targeting the proteasome subunit PSMB4), 1q21-specific target vulnerabilities were defined as genes for which at least two distinct shRNAs decreased cell growth by at least 20% compared to the growth of cells infected with scrambled controls over a period of 8 days after the recovery from transduction. Using these criteria, we identified MCL1, UBAP2L, INTS3, LASS2, KRTCAP2, and ILF2 as potential 1q21-specific vulnerability targets whose expression is driven by copy number (Figure S1A). Secondary validation experiments in the MM cell lines JJN3 and H929, which harbor three and four copies of the 1q21 amplicon, respectively, confirmed that the shRNA-mediated depletion of all six genes (two shRNAs per gene; Figure S1B) impaired cell proliferation (Figure 1C and Figure S1C), and viability (Figure S1D and S1E) by inducing apoptosis (Figure S1F). Beyond that of MCL1, a well-known critical MM survival factor (Zhang et al., 2002), target validation of the other five genes in NOD-SCID mice showed that only ILF2 downregulation had a significant impact on survival in vivo (Figure 1D and Figure S1G). These observations prompted us to focus on the in-depth analysis of ILF2 function in 1q21-amplified MM.
ILF2 Is Involved in Homologous Recombination of DNA Double-Strand Breaks in MM Cells
ILF2 encodes NF45, the regulatory subunit of NF90/NF110 complexes that are involved in mitotic control (Guan et al., 2008) and various aspects of RNA metabolism, including transcription, RNA transport, mRNA stability, and translation (Barber, 2009). ILF2 downregulation in 1q21-amplified MM cells resulted in multinucleated phenotypes and abnormal nuclear morphologies, including nucleoplasmic bridges, nuclear buds, and micronuclei (Figures 2A and S2A), findings that are consistent with the DNA damage-induced genomic instability that is associated with the DNA repair defects that occur during cellular replication (Fenech et al., 2011). Correspondingly, ILF2 downregulation was associated with a significant increase in the activation of the ATM (but not ATR or DNA-PK) pathway and accumulation of γH2AX foci (Figure 2B and Figure S2B), which are indicative of DNA double-strand breaks. ILF2-depleted MM cells underwent permanent cell cycle arrest in G2/M or G0/G1 phase, depending on p53 status (p53 is not expressed in JJN3 cells and is wild-type in H929 cells) (Figure S2B and S2C), and resulted in caspase 3–mediated apoptosis (Figures 2B and S2B), suggesting defects in these cells' capability to resolve γH2AX-marked DNA breaks. Similar results were obtained in the L363 (Figure S2D) and XG-6 (Figure S2E) cell lines, which carry three copies of 1q21 amplification, and in the OPM2 cell line (Figure S2F), which carries four copies of 1q21 amplification. In striking contrast, ILF2 downregulation in MM cell lines without 1q21 amplification (OCI-MY5 and NCU-MM1) (Hanamura et al., 2006) did not result in significant DNA damage response activation, apoptosis, multinucleation, or aberrant nuclear morphologies (Figure S2G and S2H). Furthermore, enforced expression of hairpin-resistant ILF2 cDNAs fully reversed the deleterious effects of ILF2 shRNAs (Figure S2I and S2J), which demonstrates that the phenotypic effect of the hairpins was indeed specific to diminished ILF2 expression and not an off-target effect.
Figure 2. ILF2 is involved in homologous recombination of double-strand DNA breaks in MM cells.
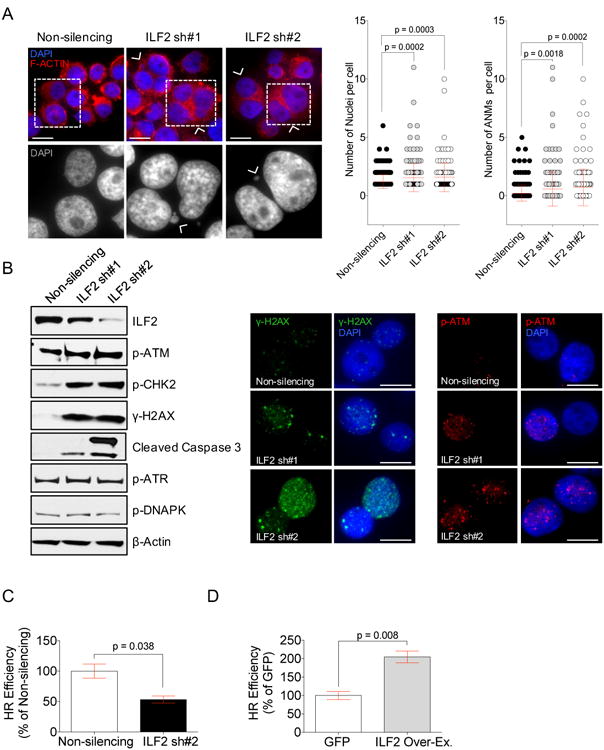
(A) Representative images of multinucleation and quantification of the number and overall abnormal nuclear morphologies (ANMs) per cell in JJN3 cells transduced with a non-silencing shRNA or one of two different ILF2 shRNAs (ILF2 sh#1 and ILF2 sh#2). Cell cytoplasm is stained with F-actin (red) and nuclei are stained with DAPI (blue); arrowheads indicate multinucleated cells, scale bars represent 10 μm (upper row images). Wide-field microscopy magnifications of the cells inside the squares of the upper panel; arrowheads indicate micronuclei; nuclei are stained with DAPI (bottom row images). Error bars denote SD.
(B) Representative Western blot analysis of ILF2, p-ATM, p-CHK2, γH2AX, cleaved caspase 3, p-ATR, and p-DNAPK in JJN3 cells transduced with non-silencing or ILF2 shRNAs; A representative β-actin is shown as the loading control for all proteins (left). Representative anti-γH2AX (middle) and anti-p-ATM (right) immunofluorescence in JJN3 cells transduced with non-silencing or ILF2 shRNAs (γH2AX: green, p-ATM: red; DAPI: blue); scale bars represent 10 μm.
(C) Quantitative analysis of HR efficiency in JJN3 cells transduced with non-silencing or ILF2 shRNAs. ILF2 shRNA #2 (ILF2 sh#2) was used for this experiment. The mean and SD of three independent experiments are shown; data are expressed as percentages of the non-silencing control.
(D) Quantitative analysis of HR efficiency in GFP- and ILF2- overexpressing JJN3 cells. The mean and SD of three independent experiments are shown; data are expressed as percentages of the GFP control.
See also Figure S2.
Therefore, we sought to determine whether ILF2 is involved in the genome damage repair that occurs during cellular replication. To this end, we evaluated whether ILF2 depletion could affect the efficiency of non-homologous end joining (NHEJ) or homologous recombination (HR), the two major repair pathways in mammalian cells. We observed a profound impairment of HR in ILF2-depleted cells (Figure 2C and Figure S2K), whereas NHEJ was unaltered after ILF2 downregulation (Figure S2L). Conversely, enforced ILF2 expression significantly enhanced HR efficiency in MM cells (Figure 2D), a finding that aligns with the reduced γH2AX levels observed in ILF2-overexpressing MM cells under physiological conditions (Figure S2M) and that may explain the increased treatment resistance observed in patients with relapsed MM who acquire more copies of 1q21 over the course of the disease.
Collectively, these data support the view that ILF2 is involved in the regulation of DNA damage response and are consistent with ILF2's role as a mediator of HR repair in MM cells. Since MM cells depend on oncogene-induced stress response pathways for their survival (Cottini et al., 2015), preventing the repair of DNA damage by targeting ILF2 may represent a synthetic lethal approach to 1q21-amplified MM, which is characterized by increased genomic instability (Chng et al., 2007).
ILF2 Levels Modulate MM Cell Sensitivity to DNA-Damaging Agents
To further investigate the role of ILF2 in the regulation of the DNA repair pathway in MM cells, we evaluated whether ILF2 downregulation increases MM sensitivity to DNA-damaging agents routinely used in the treatment of MM. Employing the interstrand crosslinker melphalan as an instigator of DNA double-strand breaks, we found that ILF2-depleted MM cells subjected to continuous melphalan treatment showed increased induction of γH2AX and apoptosis (Figure 3A, 3B, and Figure S3A, S3B, and S3C). Similar results were obtained in drug wash-out experiments in which the kinetics of DNA damage resolution were evaluated following melphalan withdrawal (Figure S3D). Conversely, ILF2 overexpression significantly reduced the accumulation of γH2AX and protected MM cells from melphalan-induced apoptosis (Figure 3C). These findings gain added significance in light of our clinical correlative studies showing that higher levels of ILF2 expression are correlated with poorer survival in MM patients treated with high-dose melphalan followed by tandem autologous transplantation (n=256 patients; Figure 3D) and are consistent with previous studies showing that ILF2 is one of the four 1q21 genes with a strong prognostic significance for MM patients treated with high-dose chemotherapy followed by autologous transplantation (Avet-Loiseau et al., 2009). Together, these data strongly suggest that the enhanced efficiency of ILF2 overexpression–induced DNA damage repair in MM cells may promote drug resistance to DNA-damaging agents by activating specific mechanisms that rapidly bypass lesions and drive cell survival decisions.
Figure 3. ILF2 Levels Modulate MM Cell Sensitivity to DNA-Damaging Agents.
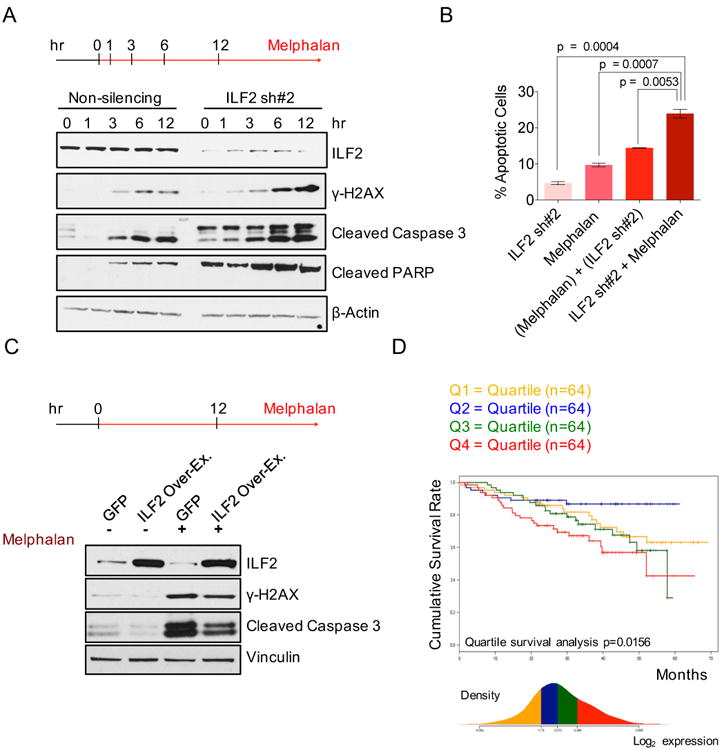
(A) Western blot analysis of ILF2, γH2AX, cleaved caspase 3, and cleaved PARP proteins in non-silencing and ILF2 shRNA #2-transduced JJN3 cells treated with 25 μM melphalan for the indicated times. β-actin was used as the loading control.
(B) Quantitative analysis of the frequency of apoptosis of non-silencing and ILF2 shRNA–transduced JJN3 cells that were treated with 4 μM melphalan for 48 hr. ILF2 shRNA #2 (ILF2 sh#2) was used for this experiment. ILF2 sh#2 indicates the frequency of apoptosis induced by ILF2 depletion; melphalan indicates the frequency of apoptosis induced by melphalan; (melphalan) + (ILF2 sh#2) indicates the sum frequency of apoptosis induced by ILF2 depletion and by melphalan; ILF2 sh#2 + melphalan indicates the frequency of apoptosis of melphalan-treated, ILF2 shRNA–transduced cells. The mean and SD of triplicates from one representative experiment are shown.
(C) Western blot analysis of ILF2, γH2AX, and cleaved caspase 3 proteins in GFP- and ILF2-overexpressing JJN3 cells treated with 25 μM melphalan for 12 hr. Vinculin was used as the loading control.
(D) Cumulative survival rate of 256 newly diagnosed MM patients subsequently treated with high-dose chemotherapy and stem cell transplantation (MM patients were enrolled in the Arkansas Total Therapy 2 trial). Patients were stratified in quartiles based on ILF2 expression as evaluated by microarray analysis.
See also Figure S3.
ILF2 Is Required for RNA Splicing of Genes Involved in DNA Repair
To understand the molecular mechanisms underlying the involvement of ILF2 in DNA repair in MM cells, we performed ILF2 immunoprecipitation experiments combined with mass spectrometry using the JJN3 cell line (Figure 4A, Table S2). Further validation of the ILF2 interactome (Figure 4A) confirmed that beyond interacting with its known binding partners NF90 and NF110, ILF2 also interacts with numerous RNA binding proteins (RBPs), including NPM, YB-1, nucleolin, ADAR1, and various heterogeneous nuclear ribonucleoproteins (hnRNPs), which are directly involved in DNA repair, genome stability maintenance, and DNA damage response regulation by modulating the alternative splicing and stability of specific pre-mRNAs (Dutertre et al., 2014). Melphalan treatment did not modify the ILF2 interactome, which suggests that DNA damage activation does not induce the binding of ILF2 to alternative partners (Figure 4A and Table S2). Consistent with the impairment of the HR (Figure 2C, and S2K) but not the NHEJ repair pathway (Figure S2L) in ILF2-depleted cells, ILF2 did not interact with DNA-PK in MM (Table S2), and ILF2 downregulation did not affect DNA-PK translocation to DNA damage foci in physiological conditions or after DNA damage activation (Figure S4A).
Figure 4. ILF2 Is Required for the RNA Splicing of Genes Involved in DNA Repair.
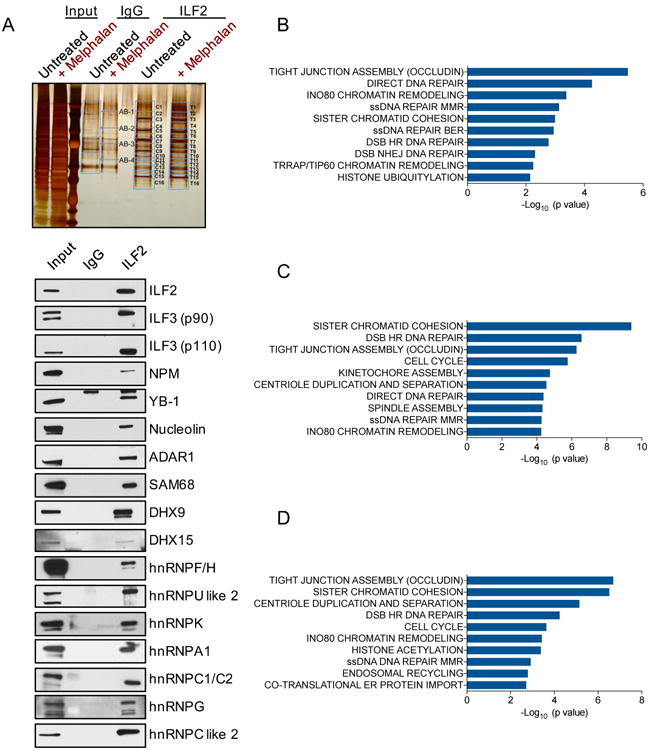
(A) Silver stained gel of proteins isolated from untreated or melphalan-treated JJN3 cells (input) and immunoprecipitated with anti-IgG or anti-ILF2 antibodies. Blue bands denote fractions that were excised and analyzed by mass spectrometry analysis (upper panel). Western blot analysis of the indicated proteins in the lysate isolated from JJN3 cells (input) and immunoprecipitated with anti-IgG or anti-ILF2 antibodies (bottom panel).
(B) Significantly enriched pathways relative to the 1750 events of aberrant splicing in ILF2 shRNA–transduced JJN3 cells as compared to non-silencing shRNA–transduced JJN3 cells. ILF2 shRNA #2 was used for this experiment, which was performed in duplicate.
(C) Significantly enriched pathways relative to the 3652 events of aberrant splicing in melphalan-treated, non-silencing shRNA–transduced JJN3 cells as compared to untreated, non-silencing shRNA–transduced JJN3 cells. The experiment was performed in duplicate.
(D) Significantly enriched pathways relative to the 3357 events of aberrant splicing in melphalan-treated, ILF2 shRNA–transduced JJN3 cells as compared to melphalan-treated, non-silencing shRNA–transduced JJN3 cells. ILF2 shRNA #2 was used for this experiment, which was performed in duplicate.
Given that ILF2 interactors play a functional role in RNA metabolism, we next investigated whether ILF2 is required to ensure the alternative splicing and processing of specific pre-mRNAs that might underlie ILF2's physiological role in MM. RNA sequencing (RNA-Seq) analysis of ILF2-depleted MM cells revealed an aberrant RNA splicing pattern of 1750 differential splicing events for 1280 genes (false discovery rate [FDR]<0.05; Table S3), with 50% of events being deregulated skipped exons (Table S3). Strikingly, the differentially spliced transcripts associated with ILF2 downregulation are highly enriched in genes that are directly involved in the repair of several types of DNA damage (Figure 4B), including HR. Similar results were obtained in the H929 cell line (Figure S4B, Table S3). These findings are consistent with ILF2's role as a mediator of HR repair in MM cells.
DNA damage induces splicing changes that give rise to mRNA variants that encode different protein isoforms with the potential to modulate cellular responses and cell fate (Colla et al., 2015; Montecucco and Biamonti, 2013) or that harbor premature stop codons that are rapidly degraded by nonsense-mediated mRNA decay (Dutertre et al., 2011). Therefore, we next evaluated whether ILF2 is also required for promoting mRNA splicing events that occur after melphalan-induced DNA damage activation. RNA-Seq analysis of melphalan-treated JJN3 cells confirmed changes in RNA splicing that are associated with DNA damage activation (Figure 4C), detecting 3,652 differential splicing events for 2335 genes (FDR<0.05; Table S4), which were mainly involved in the repair of several types of DNA damage, in sister chromatid cohesion, and cell cycle regulation pathways. These findings are consistent with previous studies showing that DNA damage induces a concerted reprogramming of the splicing pattern of transcripts of genes crucial for the DNA damage response and regulation of genomic stability (Shkreta and Chabot, 2015). Consistent with defects in their capability to resolve γH2AX-marked DNA breaks (Figure 3A, S3A and S3D), melphalan-treated ILF2-depleted MM cells showed aberrant mRNA splicing of genes involved in the repair pathway (Figure 4D), including EXO1, FANCM, FANCD2, and FANCE (FDR<0.05; Table S4). In this regard, it is notable that the protein level of FANCD2 decreased owing to premature termination of protein translation as a result of a frameshift that occurs upon exon skipping (Figure S4C). In agreement with our observations, enhanced interstrand cross-link repair via the Fanconi anemia pathway is known to mediate drug resistance in melphalan-resistant MM cells, whereas disruption of this pathway reverses drug resistance (Chen et al., 2005). Together, these data suggest that ILF2 is a key regulator of DNA damage response and modulates the RNA splicing of genes involved in DNA repair and genomic stability maintenance.
ILF2 Modulates DNA Damage–Induced YB-1 Nuclear Translocation and Splicing Regulation
Next, we sought to understand the mechanistic basis of ILF2's regulation of mRNA splicing in response to DNA damage, a finding that may lead to the development of therapeutic options to enhance the effectiveness of current DNA-damaging agents. To this end, we first evaluated whether ILF2 directly modulates RNA splicing through its direct interaction with specific RNAs under both physiological and DNA damage (melphalan treatment) conditions. RNA immunopreciptation (RIP) and sequencing of ILF2-bound RNAs in the JJN3 (1q21 amp; p53 null) and H929 (1q21 amp; p53 WT) cell lines revealed that the ILF2 RNA interactome is highly enriched in transcripts involved in the HR DNA repair pathway, including key components of the BRCA1 protein complex (Figure 5A and Table S5).
Figure 5. ILF2 Modulates DNA Damage–Induced YB-1 Nuclear Translocation and Splicing Regulation.
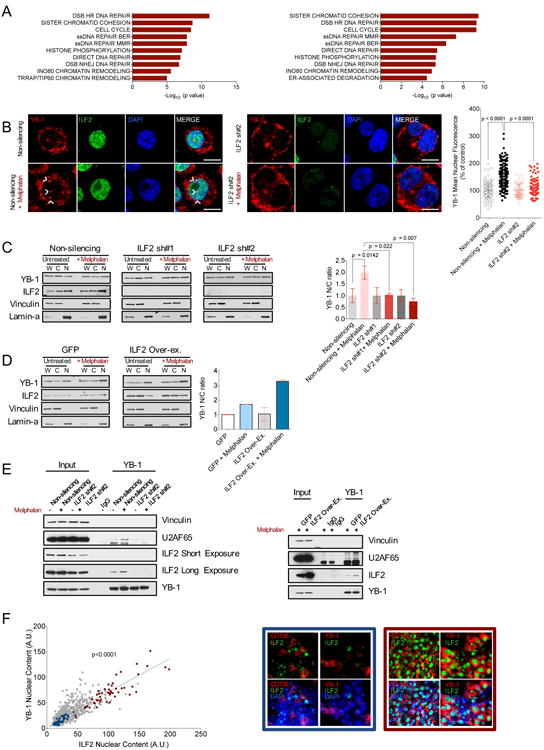
(A) Significantly enriched pathways relative to the transcripts bound to ILF2 in both untreated (left) and in both melphalan-treated (right) JJN3 and H929 cell lines. The experiment was performed in duplicate.
(B) Representative confocal microscopy images of anti–YB-1 and anti-ILF2 immunofluorescence in untreated or melphalan-treated non-silencing (left two rows) or ILF2 shRNA–transduced JJN3 cells (middle two rows); anti–YB-1: red; anti-ILF2: green; DAPI: blue; scale bars represent 10 μm. Confocal microscopy quantification of YB-1 nuclear fluorescence in untreated or melphalan-treated non-silencing or ILF2 shRNA-transduced JJN3 cells. Data are expressed as percentages of the corresponding untreated controls; error bars denote SD (panel on the right).
(C) Representative Western blot analysis of ILF2 and YB-1 proteins in the whole extracts (W) and in nuclear (N) and cytoplasmic (C) fractions as well as quantification of YB-1 nuclear/cytoplasmic (N/C) ratio in untreated and melphalan-treated non-silencing or ILF2 shRNA–transduced JJN3 cells. Vinculin was used as the loading control for the whole extracts and cytoplasmic fractions and lamin-A was used as the loading control for the nuclear fractions. YB-1 nuclear expression was normalized to lamin-A nuclear expression, and YB-1 cytoplasmic expression was normalized to vinculin cytoplasmic expression. YB-1 nuclear/cytoplasmic ratios were expressed as percentages of the untreated corresponding controls. The mean and SD of three independent experiments are shown (panel on the right).
(D) Western blot analysis of ILF2 and YB-1 proteins in the whole extracts (W) and in nuclear (N) and cytoplasmic (C) fractions and quantification of YB-1 nuclear/cytoplasmic (N/C) ratio in untreated and melphalan-treated GFP- or ILF2-overexpressing JJN3 cells. Vinculin was used as the loading control for the whole extract and cytoplasmic fraction and lamin-A was used as the loading control for the nuclear fraction. YB-1 nuclear expression was normalized to lamin-A nuclear expression and YB-1 cytoplasmic expression was normalized to vinculin cytoplasmic expression; YB-1 nuclear/cytoplasmic ratios were expressed as percentages of the untreated corresponding controls. The mean and SD of two independent experiments are shown (panel on the right).
(E) Western blot analysis of vinculin, U2AF65, ILF2 (short or long exposure), and YB-1 in the lysates isolated from untreated and melphalan-treated non-silencing and ILF2 shRNA–transduced JJN3 cells (input) and immunoprecipitated with anti-IgG or anti–YB-1 antibodies (left). Western blot analysis of vinculin, U2AF65, ILF2, and YB-1 in the lysates isolated from melphalan-treated GFP- and ILF2-overexpressing JJN3 cells (input) and immunoprecipitated with anti-IgG or anti–YB-1 antibodies (right).
(F) Quantitative immunofluorescence analysis of ILF2 and YB-1 nuclear expression in 15 BM biopsy specimens from 14 MM patients. A.U. stands for arbitrary unit; every spot indicates ILF2 and YB-1 expression in a specific nucleus; blue spots indicate ILF2 and YB-1 nuclear expression in the plasma cells of a MM patient with lower expression of ILF2; red spots indicate ILF2 and YB-1 nuclear expression in the plasma cells of an MM patient with higher expression of ILF2 (left). Representative anti-CD138, anti-ILF2, and anti–YB-1 immunofluorescence in the biopsy specimens of MM patients with lower (blue square) or higher (red square) ILF2 nuclear expression; CD138 and YB-1: red; ILF2: green; DAPI: blue; scale bars represent 10 μm.
Importantly, 31.7% and 28% of the genes whose mRNAs underwent aberrant splicing in ILF2-depleted JJN3 cells under physiological conditions or following DNA damage, respectively, including FANCM, FANCD2 and EXO1, were direct ILF2 targets. However, the ILF2 RNA interactome did not change in response to DNA damage (Figure 5A and Table S5), which suggests that the differences in the splicing pattern observed in ILF2-depleted MM cells upon melphalan treatment cannot be attributed directly to ILF2 but could result from ILF2 depletion–induced changes in the activity of its RBP- and hnRNP-interacting partners in response to DNA damage activation.
To test this hypothesis, we sought to define the ILF2 protein interaction network, which contributes to splicing changes in response to DNA damage. After excluding the possibility that ILF2 downregulation affects the expression or stability of RBPs and hnRNPs (Figure S5A), which may influence splice site selection and induce aberrant splicing, we evaluated whether ILF2 is required for the subcellular relocalization of its interactors, which may shuttle from the cytoplasm to the nucleus or vice-versa to allow the coordinated regulation of pre-mRNA maturation and mRNA stability and translation in response to DNA damage (Dutertre et al., 2014). We observed that ILF2 downregulation impaired cytoplasmic-to-nuclear YB-1 shuttling after melphalan treatment in both JJN3 and H929 cell lines (Figure 5B, Figure 5C, and data not shown) without affecting the localization of other interacting partners (data not shown). In striking contrast, ILF2 overexpression potentiated YB-1 nuclear translocation in response to DNA damage (Figure 5D). YB-1 is a broad-specificity DNA/RNA-binding protein that participates in many aspects of RNA metabolism, including the transcription and splicing of pre-mRNA, the packaging of mRNA, and the regulation of mRNA stability and translation (Wu et al., 2007a), and thereby contributes to oncogenic and metastatic processes. Remarkably, YB-1 binding to ILF2 was activated following DNA damage in MM cells (Figure 5E) and ILF2/YB-1 complexes accumulated in euchromatin areas of active transcription (Figure S5B), which raised the possibility that YB-1 could be involved in the cotranscriptional splicing regulation and assembly of pre-spliceosome complexes required to promote transcript maturation and stability. In line with this observation, melphalan treatment significantly increased the interaction between YB-1 and the splicing factor U2AF65, a known YB-1 nuclear interactor (Wei et al., 2012), a process which was modulated by the level of ILF2 expression (Figure 5E and S5C). In addition, YB-1's binding to U2AF65 and ILF2 depended on the presence of RNA (Figure S5D), which further confirms the role of these complexes in RNA regulation.
Collectively, these data indicate that ILF2 regulates YB-1 activity by modulating its nuclear localization and interaction with the spliceosome to promote the splicing pattern changes that occur in response to DNA damage. These findings gain added relevance in light of our studies showing a significant correlation between ILF2 and YB-1 nuclear levels in primary MM plasma cells (Figure 5F).
ILF2-Mediated YB-1 Nuclear Translocation Regulates the Cotranscriptional Splicing of DNA Repair Transcripts in Response to DNA Damage
Next, we sought to further characterize YB-1's ILF2-dependent role in splicing regulation in response to DNA damage. To define the mRNA network directly regulated by YB-1 in MM, we conducted RIP and sequencing experiments using the JJN3 cell line by pulling down and sequencing YB-1–bound RNAs. We observed that, under physiological conditions, YB-1 preferentially binds RNA targets involved in histone modifications (such as acetylation, ubiquitination, sumoylation, and methylation) and chromatin remodeling, which play critical roles in several key cellular processes such as transcription regulation, mRNA processing, and cell cycle progression (Figure 6A and Table S6). DNA damage response modified the YB-1 mRNA interactome by directly activating its binding to 705 transcripts (q value <0.05; Table S6), which were enriched in pathways mainly involved in HR DNA repair (Figure 6B). Among the 18 YB-1–bound mRNAs involved in the HR repair pathway, only YB-1 binding to EXO1 and FANCD2 transcripts was significantly reduced upon ILF2 depletion (Figure 6C and Figure S6A), a finding that aligns with the observation that DNA damage results in aberrant RNA splicing of EXO1 and FANCD2 in ILF2-depleted MM cells (Table S4). ILF2 overexpression significantly potentiated YB-1 binding to EXO1 and FANCD2 transcripts following DNA damage (Figure 6D), and resulted in higher protein levels of EXO1 and FANCD2 (Figure S6B), which may explain the ILF2-mediated protection of the cells from melphalan-induced apoptosis (Figure 3C). Consistent with the view that YB-1 serves as a critical effector of ILF2-mediated cotranscriptional splicing modulation in response to DNA damage, YB-1 downregulation during DNA damage activation decreased levels of FANCD2 and increased γH2AX accumulation and caspase 3 activation to an extent similar to that of ILF2 depletion (Figure 6E, and Figure S6C). Together, these data indicate that the activation of the ILF2/YB-1 signaling axis upon DNA damage regulates the transcript maturation and stability of genes directly involved in the repair of DNA double-strand breaks and contributes to adaptation mechanisms that promote MM cells' resistance to DNA-damaging agents.
Figure 6. ILF2-Mediated YB-1 Nuclear Translocation Regulates the Cotranscriptional Splicing of DNA Repair Transcripts in Response to DNA Damage.
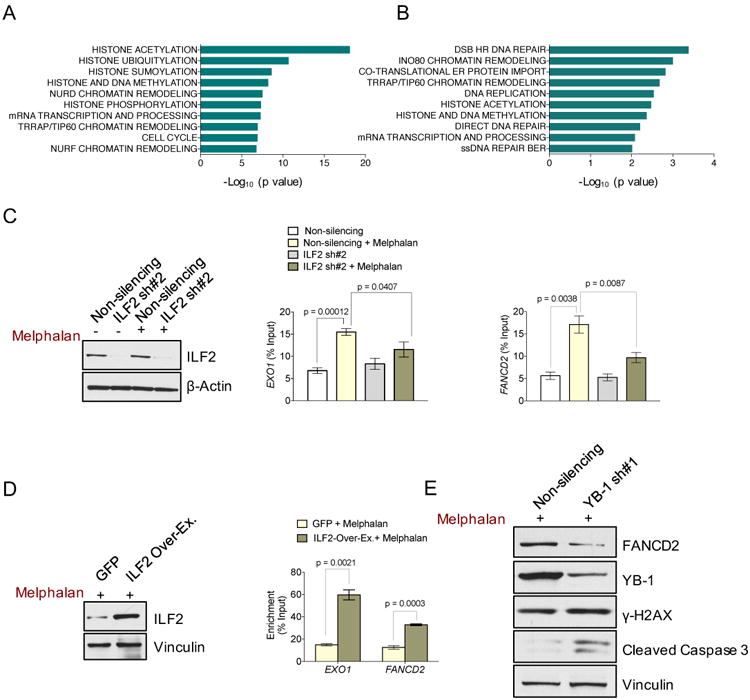
(A) Significantly enriched pathways relative to YB-1–bound transcripts in untreated JJN3 cells.
(B) Significantly enriched pathways relative to the transcripts whose binding to YB-1 was induced by melphalan treatment in JJN3 cells.
(C) Representative Western blot analysis of ILF2 in untreated and melphalan-treated non-silencing and ILF2 shRNA–transduced JJN3 cells. β-actin was used as the loading control (panel on the left). RIP-qPCR quantification of YB-1-bound EXO1 (middle panel) and FANCD2 (panel on the right) transcripts in untreated or melphalan-treated non-silencing and ILF2 shRNA-transduced JJN3 cells. The mean and SD of three independent experiments are shown; data are expressed as percentages of the corresponding input.
(D) Representative western blot analysis of ILF2 in GFP- and ILF2-overexpressing JJN3 cells. Vinculin was used as the loading control (panel on the left). RIP-qPCR quantification of YB-1–bound EXO1 and FANCD2 transcripts in melphalan-treated GFP-or ILF2-overexpressing JJN3 cells. The mean and SD of three independent experiments are shown; data are expressed as percentages of the corresponding input (panel on the right).
(E)) Western blot analysis of FANCD2, YB-1, γH2AX, and cleaved caspase 3 proteins in melphalan-treated non-silencing shRNA or YB-1 shRNA #1–transduced JJN3 cells. Vinculin was used as the loading control.
Discussion
In this study, we provide multi-level evidence that ILF2 is a critical factor involved in DNA damage repair and that increased ILF2 expression promotes MM cells' tolerance of genomic instability and resistance to DNA-damaging agents. Our data suggest that 1q21 amplification–driven ILF2 overexpression enhances the cotranscriptional splicing and stabilization of crucial pre-mRNA effectors required for efficient HR DNA repair during cellular replication and in response to DNA damage. In this regard, owing to their increased genomic instability, MMs carrying the 1q21 amplification may rely on deregulated ILF2-mediated HR activity to tolerate DNA double-strand breaks, rapidly bypass checkpoint activation, and support survival, which explains their enhanced vulnerability to ILF2 inhibition. In accord with this hypothesis, downregulation of ILF2 in 1q21-amplified MM provoked DNA damage accumulation, cell cycle arrest, and apoptosis. This observation is consistent with previous findings showing that elevated HR activity is permissive for the development of genomic instability in MM, results in an increased burden of mutations and progressive accumulation of genetic alterations over time, and plays a critical role in tumor maintenance by contributing to survival and progression mechanisms (Shammas et al., 2009).
We also found that ILF2 overexpression mediates resistance to the DNA-damaging agent commonly used in MM treatment, which may explain in part the longstanding clinical observations that MMs carrying the 1q21 amplification represent a very high-risk subgroup of tumors that are associated with resistance to treatment and disease progression. Indeed, increased ILF2 expression was strongly correlated with poorer survival in MM patients treated with high-dose melphalan followed by tandem autologous transplantation, although we recognize that additional 1q21-amplified and overexpressed genes such as MCL1 (or other genes that could be missed by our in vitro screen) may contribute to MM prognosis. Nevertheless, our findings support the clinical utility of ILF2 as a biomarker of more aggressive disease and the development of strategies for blocking ILF2 signaling to enhance the effectiveness of current therapeutic approaches based on DNA-damaging agents.
On the mechanistic level, ILF2 is shown to mediate drug resistance to genotoxic agents in a dose-dependent manner in part by modulating YB-1's nuclear localization and interaction with the splicing factor U2AF65 to promote mRNA processing and stabilization of DNA repair genes in response to DNA damage. Notably, this finding is supported by our clinical studies showing that nuclear expression of ILF2 is strongly correlated with that of YB-1 in MM patients. This observation has potential therapeutic implications, as it suggests that small molecules that specifically block the ILF2/YB-1 DNA repair-signaling axis may sensitize MM cells to DNA-damaging agents.
In conclusion, our study reveals an intimate relationship among 1q21 amplification, mRNA splicing, and DNA repair in the control of DNA damage response in MM. On the basis of our findings, we propose that 1q21-driven ILF2 overexpression deregulates HR by stabilizing the mRNA splicing of critical HR effectors, which enables genomic instability, promotes adaptive mechanisms to genotoxic stress, and enhances cell survival, thereby promoting drug resistance and disease progression. Given that 1q21 amplification is one of the most frequent copy number alterations in cancer (Beroukhim et al., 2010), synthetic lethality approaches based on targeting gain-of-functions associated with ILF2 may have a broad spectrum of applications to potentiate the sensitivity of cancer cells to chemotherapeutic agents.
Contact for Reagent and Resource Sharing
Information and requests for reagents may be directed by the lead contact Simona Colla (scolla@mdanderson.org).
Experimental Models and Subject Details
MM Cell Lines
The human JJN3, OPM2, and L363 cell lines were obtained from DSMZ; the H929 cell line was obtained from the American Type Culture Collection; the NCU-MM1 cell line was a generous gift from Dr. Hanamura at the Aichi Medical University; and the OCI-MY5, and XG-6 cell lines were generous gifts from Dr. M. Kuehl at the National Institutes of Health. Cell lines were maintained in RPMI 1640 culture medium supplemented with 10% heat-inactivated fetal bovine serum (Invitrogen). Cell lines were validated by STR DNA fingerprinting using the Promega 16 High Sensitivity STR Kit. The STR profiles were compared to online search databases (DSMZ/ATCC/JCRB/RIKEN) of approximately 2500 known profiles; along with the MD Anderson Characterized Cell Line Core database of approximately 2600 know profiles. The STR profiles matched known DNA fingerprints or were unique. JJN3 or H929 cells were treated with 4, 10, or 25 μM melphalan (Sigma), as indicated in the Figure Legends. Melphalan was dissolved in Ethanol.
Human Primary MM Samples
15 BM biopsy specimens were obtained from 14 MM patients (7 females and 7 males) referred to the Department of Clinical and Experimental Medicine at the University of Parma (Italy) with the approval of the Institutional Review Board. Written informed consent was obtained from the donors.
In Vivo Experiments
shRNA-transduced JJN3 (1×10⁶) or H929 cells (2×10⁶) were injected subcutaneously into the flanks of non-irradiated 6- to 8-week-old female SCID mice (Taconic Laboratory, Germantown, NY). Mice were maintained in a pathogen-free environment, monitored daily, and humanely killed at the first sign of morbidity. Animal experiments were approved by the Institutional Animal Care and Use Committee of the University of Texas M.D. Anderson Cancer Center and conducted in accordance with the Animal Welfare Act.
Method Details
aCGH and Gene Expression Profiling Analysis
We analyzed aCGH data (Agilent 244K) from 254 patients with newly diagnosed or previously treated MM included in the Multiple Myeloma Research Consortium collection (http://www.broadinstitute.org/mmgp/data) using the GISTIC2 algorithm (Mermel et al., 2011) to identify recurrent copy number changes. Copy number–driven expression analysis was performed using 246 MM samples with matched available microarray data. Of the 208 genes in the 1q21 amplicon peak, 78 showed significant overexpression (FDR<0.05) in the 55 samples with 1q21 amplification (CN>0.9) as compared to the 139 samples without 1q21 amplification (CN<0.3). Further validation of copy number–driven expression results relative to MCL1, KRTCAP2, INTS3, LASS2, UBAP2L, and ILF2 was performed using 186 pre-treated MM samples with available 1q21 FISH and microarray data deposited in GSE2658 (Zhan et al., 2006). The cumulative survival rate of the 256 newly diagnosed MM patients enrolled in the Total Therapy 2 trial and treated with high-dose chemotherapy and stem cell transplantation (Shaughnessy et al., 2003) was calculated using data deposited in GSE2658. Patients were stratified in quartiles based on ILF2 expression as evaluated by microarray analysis.
In Vitro Screen
Five hundred thirty-two short hairpin RNAs (shRNAs) available from the green fluorescent protein (GFP)-positive pGIPZ shRNA library (Dharmacon, Lafayette, CO) and targeting the 78 amplified and overexpressed genes in 1q21 were pre-printed on 96-well plates in a single-shRNA-per-well format.
shRNAs targeting UBB, PLK1, and KIF11 (positive controls) and a non-silencing shRNA were included in each 96-well plate. HEK293T cells were seeded in 96-well plates (30,000 cells/well) and transfected with a single shRNA-expressing vector and the packaging plasmids using FuGene HD (Roche, Indianapolis, IN). Seventy-two hours after transfection, the supernatant from every well was collected, centrifuged at 2000 rpm for 10 min, and used to infect JJN3 or OCI-MY5 cells previously plated in 96-well plates (10,000 cells/well). The day after transduction and every 3 days thereafter, MM cells were centrifuged at 2000 rpm for 10 min, and fresh medium was added to each well. Half of the cells seeded in each well were analyzed for GFP expression 4 days after transduction, once GFP expression had stabilized (starting point), or 12 days after transduction (end point), respectively. Briefly, cells were centrifuged at 1500 rpm for 10 min and resuspended in phosphate-buffered saline (PBS) containing 2% fetal bovine serum and 1 μM 4′,6-diamidino-2-phenylindole (DAPI). Flow cytometry analyses were performed using a FACSCanto cytofluorometer (BD Biosciences, Franklin Lakes, NJ). Fluorescence background levels were set with untransduced and unstained cells. After excluding shRNAs that were uniformly cytotoxic, we defined 1q21-specific target vulnerabilities as genes for which at least 2 distinct shRNAs decreased the frequency of GFP-positive JJN3 cells but not OCI-MY5 cells by at least 20% over a period of 8 days after the recovery from transduction. Every experiment was repeated 3 times.
shRNA Knockdown and Overexpression Experiments
Recombinant lentiviral particles were produced by the transient transfection of HEK 293T cells following a standard protocol as described previously (Muller et al., 2012). Briefly, FuGene HD (Roche) was used to transfect 72 μg of the shRNA plasmid, 54 μg of pCMVR 8.74 plasmid (Addgene), and 18 μg of pMD2.g plasmid (Addgene) into HEK 293T cells plated in 245-mm2 dishes. Viral supernatant was collected 72 hr after transfection, concentrated by centrifugation at 23,000 rpm, and resuspended in cell growth medium. For transduction, viral solutions were added to cell culture medium containing 2 μg/mL polybrene. The full list of shRNA sequences is included in the Key Resources Table.
Key Resources Table.
| REAGENT or RESOURCE | SOURCE | IDENTIFIER |
|---|---|---|
| Antibodies | ||
| Mouse monoclonal anti-ILF2 | Santa-Cruz | Cat# sc-365068 |
| Rabbit polyclonal anti-ILF3 | Abcam | Cat# ab50832 |
| Rabbit monoclonal anti-ILF3 | Origene | Cat# TA307124 |
| Mouse monoclonal anti-γH2AX | Millipore | Cat# 05636 |
| Rabbit monoclonal anti-γH2AX | Cell Signaling | Cat# 9718 |
| Rabbit monoclonal anti-phospho-ATM | Cell Signaling | Cat# 5883 |
| Rabbit polyclonal anti-phospho-Chk2 | Cell Signaling | Cat# 2661 |
| Rabbit monoclonal anti-cleaved Caspase3 | Cell Signaling | Cat#96645 |
| Rabbit polyclonal anti-cleaved Parp | Cell Signaling | Cat# 9541 |
| Mouse monoclonal anti-TP53 | Santa-Cruz | Cat# sc-126 |
| Rabbit monoclonal anti-β-actin | Cell Signaling | Cat# 49705 |
| Rabbit polyclonal anti-hnRNPC-like 2 | Millipore | Cat# AB12226 |
| Mouse monoclonal anti-Adar1 | Santa Cruz | Cat# sc-73408 |
| Goat Polyclonal anti-hnRNPC1/C2 | Santa Cruz | Cat# sc-10037 |
| Goat Polyclonal anti-hnRNPG | Santa Cruz | Cat# sc-14581 |
| Rabbit polyclonal anti-vinculin | Sigma-Aldrich | Cat# V9131 |
| Rabbit polyclonal anti-phospho-ATR | Cell Signaling | Cat# 2853 |
| Rabbit polyclonal anti-phospho-DNAPK | Cell Signaling | Cat# 4215 |
| Mouse monoclonal anti-NPM | Invitrogen | Cat# 325200 |
| Rabbit polyclonal anti-YB1 | Abcam | Cat# ab12148 |
| Rabbit polyclonal anti-Sam68 | Santa Cruz | Cat# sc-333 |
| Rabbit polyclonal anti-nucleolin | Santa Cruz | Cat# sc-13057 |
| Rabbit polyclonal anti-DHX9 | Abcam | Cat# ab26271 |
| Goat Polyclonal anti-DHX15 | Santa Cruz | Cat# sc-67550 |
| Mouse monoclonal anti-hnRNPF/H | Santa Cruz | Cat# sc-32310 |
| Mouse monoclonal anti-hnRNPA1 | Santa Cruz | Cat# sc-32301 |
| Mouse monoclonal anti-hnRNPK | Santa Cruz | Cat# sc-28380 |
| Rabbit polyclonal anti-hnRNPU-like 2 | Abcam | Cat# ab104042 |
| Rabbit polyclonal anti-U2AF65 | Abcam | Cat# ab37483 |
| Rabbit polyclonal anti-Fancd2 | Novus Biologicals | Cat# NB100-182 |
| Mouse monoclonalanti-U2AF65 (immunoprecipitation) | Santa Cruz | Cat# sc-53942 |
| Rabbit polyclonal anti-ILF2 (immunoprecipitation) | Abcam | Cat# ab113205 |
| Mouse monoclonal anti-phospho-ATM (immunofluorescence) | Active Motif | Cat# 39529 |
| Mouse monoclonal anti-CD138 | Abcam | Cat# ab34164 |
| Anti-F actin | Thermo Fisher | Cat# A34055 |
| Mouse monoclonal anti-phospho-DNAPK | Abcam | Cat# ab18356 |
| Ant-rabbit/mouse immunoglobulin G | Santa Cruz | Cat# sc-2027/2025 |
| Bacterial and Virus Strains | ||
| pCMVR8.74 packaging vector | Didier Trono's lab | AddgeneCat# 22036 |
| PMD2.G packaging vector | Didier Trono's lab | AddgeneCat# 12259 |
| Biological Samples | ||
| aCGH and microarray data | Multiple Myeloma Research Consortium collection | http://www.broadinstitute.org/mmgp/data |
| FISH and microarray data | Zhan et al, 2006 | GSE2658 |
| Microarray and survival data | Shaughnessy et al, 2003 | GSE2658 |
| 15 primary MM samples from 14 patients | This paper | University of Parma (Italy) |
| Chemicals, Peptides, and Recombinant Proteins | ||
| Melphalan | Sigma-Aldrich | Cat# M2011 |
| Critical Commercial Assays | ||
| Anti-Annexin V-APC | Ebioscience | Cat# 88-8007-74 |
| High Capacity cDNA Reverse Transcription Kit | Thermo Fisher | Cat# 4368814 |
| RNeasyMinikit | Qiagen | Cat# 74104 |
| CompoZr Target Integration Kit | Sigma-Aldrich | Cat# CTI1-1KT |
| Magna RIP RNA-binding protein immunoprecipitation kit | Millipore | Cat# 17-700 |
| TruSeq® Stranded Total RNA LT - (with Ribo-Zero TM Gold) - Set A | Illumina | Cat# RS-122-2301 |
| Nuclear/Cytosol Fractionation Kit | Biovision | Cat# K266-100 |
| Ovation RNA-Seq System V2 | Nugen | Cat # 7102-32 |
| QuikChange site-directed mutagenesis kit | Agilent | Cat# 200523 |
| Deposited Data | ||
| Raw data (RNA-sequencing, H929 cell line) | This paper | GSE97323 |
| Raw data (RNA-sequencing, JJN3 cell line) | This paper | GSE83712 |
| Raw data (RIP-sequencing, H929 and JJN3 cell lines) | This paper | GSE83665 |
| Experimental Models: Cell Lines | ||
| Human JJN3 cell line | DSMZ | Cat# ACC541 |
| Human NCIH929 cell line | ATCC | Cat# CRL-9068 |
| Human OCI-MY5 cell line | Dr. Kuehl (NIH) | NA |
| Human L-363 cell line | DSMZ | Cat# ACC49 |
| Human OPM-2 cell line | DSMZ | Cat# ACC40 |
| Human NCUMM1 cell line | Dr. Hanamura (Aichi Medical University) | NA |
| Human XG-6 cell line | Dr. Kuehl (NIH) | NA |
| Experimental Models: Organisms/Strains | ||
| Mouse: NOD/MrkBomTac-Prkdcscid | Taconic | NODSC-F |
| Oligonucleotides | ||
| ILF2-shRNA | Dharmacon | V3LHS_410035 |
| ILF2-shRNA | Dharmacon | V2LHS_48795 |
| MCL1-shRNA | Dharmacon | V3LHS_413586 |
| MCL1-shRNA | Dharmacon | V2LHS_72721 |
| KRTCAP2-shRNA | Dharmacon | V3LHS_354655 |
| KRTCAP2-shRNA | Dharmacon | V3LHS_354652 |
| INT3-shRNA | Dharmacon | V3LHS_335830 |
| INT3-shRNA | Dharmacon | V3LHS_637486 |
| LASS2-shRNA | Dharmacon | V3LHS_334041 |
| LASS2-shRNA | Dharmacon | V3LHS_334038 |
| UBAPL2-shRNA | Dharmacon | V3LHS_381632 |
| UBAPL2-shRNA | Dharmacon | V3LHS_381634 |
| YB-1-shRNA | Dharmacon | V3LHS_316625 |
| YB-1-shRNA | Dharmacon | V2LHS_232997 |
| ILF2-shRNA | Sigma-Aldrich | TRCN0000014557 |
| ILF2-shRNA | Sigma-Aldrich | TRCN0000329784 |
| FANCD2 primers | This paper | NA |
| Recombinant DNA | ||
| pHAGE-ILF2-GFP | This paper | NA |
| pGFP-Pem1-Ad2 | Shamanna et al, 2011 | NA |
| Software and Algorithms | ||
| GraphPad Prism 6 | GraphPad Software | www.graphpad.com |
| ImageJ | NIH | http://rsbweb.nih.gov/ij/) |
| Gistic2 | Mermel et al, 2011 | http://portals.broadinstitute.org/cgi-bin/cancer/publications/pub_paper.cgi?mode=view&paper_id=216&p=t |
| Mascot | Matrix Science | http://www.matrixscience.com/daemon_support_v2_3.html |
| FastQC | Simon Andrews | http://www.bioinformatics.babraham.ac.uk/projects/fastqc/ |
| Tophat2 | Kim et Al, 2013 | http://ccb.jhu.edu/software/tophat. |
| Pathway Studio | Elsevier Inc | http://www.pathwaystudio.com/ |
| STAR | Dobin et al., 2013 | https://github.com/alexdobin/STAR/releases |
| Cufflinks | Trapnell et al, 2012 | http://cole-trapnell-lab.github.io/cufflinks/ |
| HTSeq | Anders et al, 2015 | http://www-huber.embl.de/HTSeq/doc/overview.html |
| rMATS (version rMATS 3.2.5) | Shen et al, 2014 | http://rnaseq-mats.sourceforge.net/ |
| Other | ||
Rescue of the phenotypic effects of knocking down ILF2 in the JJN3 cell line was performed by inducing the expression of an shRNA-resistant form of ILF2. Briefly, 3 silent mutations were introduced into the ILF2 coding region targeted by shRNA #2 using the QuikChange site-directed mutagenesis kit (Agilent). The shRNA-resistant ILF2 coding region was cloned into the pHAGE-EF1α lentiviral vector and expressed in the JJN3 cell line carrying shRNA #2. For a control, the same cell line was infected with a lentiviral vector carrying the GFP gene. For the ectopic expression of ILF2 and the rescue of the phenotypic effects induced by shRNA #1, the ILF2 coding region was cloned into the pHAGE-EF1α lentiviral vector using the Gateway system and transduced into the JJN3, H929 or JJN3 cells carrying shRNA #1, as described above.
Quantification of Abnormal Nuclear Morphologies
JJN3, H929, L363, XG-6, OPM2, OCI-MY5, and NCU-MM1 cells transduced with non-silencing or ILF2 shRNAs were stained with F-actin (Thermo Fisher, A34055) and DAPI. Cells were analyzed for abnormal nuclear morphologies and scored as described previously (Fenech, 2007). Briefly, a nucleoplasmic bridge was the chromatin segment connecting two cell nuclei, a micronucleus was morphologically identical to, but smaller than the cell nucleus, and a bud was the round and oval protrusion of the nuclear membrane that was connected to the cell nucleus.
Cell Proliferation Assay
JJN3 or H929 cells transduced with non-silencing or ILF2 shRNAs were seeded at a density of 3×10⁵ cells/mL 1 day after transduction. Cell number and viability were determined by trypan blue exclusion testing at various times.
Annexin V/DAPI Assay for Apoptosis
JJN3 or H929 cells transduced with non-silencing or ILF2 shRNAs were stained with Annexin V-APC (Ebioscience, San Diego, CA) and DAPI and evaluated for apoptosis 4 days after transduction or 48 hr after melphalan treatment by flow cytometry with a FACScan flow cytometer (Becton-Dickinson) according to the manufacturer's protocol.
Cell Cycle Analysis
JJN3 or H929 cells transduced with non-silencing or ILF2 shRNAs were fixed in 75% ethanol at –20°C overnight. The following day, the cells were washed with cold PBS, treated with 100 μg of RNase A (Qiagen, Hilden, Germany), and stained with 50 μg of propidium iodide (Roche). Flow cytometric acquisition was performed using a 3-color FACScan flow cytometer (Becton Dickinson).
Indirect Immunofluorescence Microscopy
JJN3 or H929 cells were resuspended in PBS, spotted on immunofluorescence slides (Thermo Fisher Scientific, Waltham, MA), fixed for 10 min in 4% paraformaldehyde (Sigma-Aldrich), permeabilized in 0.2% Triton X-100 for 5 min, and blocked in 5% bovine serum albumin for 1 hr. Then, the cells were stained with primary antibodies against ILF2 (Santa Cruz, sc-365068), phospho-ATM (Active Motif, 39529), γH2AX (Cell Signaling, 9718; Millipore, 05636), YB-1 (Abcam, ab12148), CD138 (Abcam, ab34164), and phospho-DNAPK (Abcam, ab18356). Nuclei were stained with DAPI. Coverslips were mounted with Prolong Gold Antifade reagent (Life Technologies). Images were captured using a wide-field and/or a confocal microscope (Nikon Instruments Inc.) and analyzed using ImageJ software (http://rsbweb.nih.gov/ij/).
Quantitative Real-Time Polymerase Chain Reaction
RNA was extracted using the RNeasy Minikit (Qiagen). Purified RNA was dissolved in sterile distilled water. cDNA was synthesized using the High Capacity cDNA Reverse Transcription Kit (Thermo Fisher Scientific) according to the manufacturer's protocol and using 1 μg of RNA per reaction. Quantitative real-time polymerase chain reaction (qPCR) was performed using TaqMan Gene Expression Assays for the genes ILF2, LASS2, KRTCAP2, MCL1, UBAP2L, INTS3, and GAPDH (Applied Biosystems) and TaqMan Universal PCR Mastermix (Applied Biosystems) in a 7500 Real-Time PCR System (Applied Biosystems). Each condition was run in triplicate. The expression levels of the target genes were normalized to those of GAPDH. In RNA immunoprecipitation experiments, immunoprecipitated RNA was retrotranscribed as described above. cDNA was diluted 10 times, and qPCR was performed using TaqMan Gene Expression Assays for the genes EXO1, FANCD2, H2AFX, BLM, DNMT1, DDB1, CDT1, XRCC5, RAD23A, POLE, TOP1MT, SMARCD1, ORC3, XRCC6, DDB2, MCM5, RFC2, and TOP3A. Results were expressed as percentages of the corresponding input and normalized to the corresponding immunoglobulin G control.
Analysis of Aberrant Splicing of FANCD2
RNA was extracted from untreated or melphalan-treated cells transduced with non-silencing or ILF2 shRNA (sh#2) using the RNeasy Minikit (Qiagen). Purified RNA was dissolved in sterile distilled water. cDNA was synthesized using the High Capacity cDNA Reverse Transcription Kit (Applied Biosystems) according to the manufacturer's protocol. PCR was performed with Titanium DNA Polymerase (Clontech, Mountain View, CA) using the following set of primers: FANCD2-F TCAGCCCTCCATGTCCTTAG, FANCD2-R TGATCAGTTCTGGGACAC.
NHEJ Assay
An NHEJ assay was performed as described previously (Shamanna et al., 2011). Briefly, 2×10⁶ JJN3 cells transduced with non-silencing or ILF2 shRNAs (using PLKO vectors with the puromycin selection gene) were transfected with 2 μg of pGFP-Pem1-Ad2 reporter plasmid digested with HindIII using the Amaxa Nucleofection System (Lonza) as described previously (Shamanna et al., 2011). Cells were harvested 48 hr later and assayed with the LSR Fortessa flow cytometry system (BD Bioscience) for GFP expression.
HR Assay
A total of 2×10⁶ non-silencing or ILF2 shRNA–transduced or GFP- or ILF2-overexpressing JJN3 were transfected with the donor plasmid and ZNF mRNA included in the CompoZr Target Integration Kit (Sigma) using the Amaxa Nucleofector System. Cells were harvested 48 hr later, and genomic DNA was amplified by polymerase chain reaction (PCR) as described previously (Yuan et al., 2013).
Western Blotting
After two washes with phosphate-buffered saline, cells were incubated in cell extraction buffer (BioVision Research Products) for 15 min with gentle shaking. Lysates were then collected and centrifuged at 14,000 rpm for 10 min at 4°C. Sodium dodecyl sulfate– polyacrylamide gel electrophoresis and Western blotting were performed as described previously (Muller et al., 2012). In the nuclear/cytoplasmic fractionation experiments, the cytosolic and nuclear fractions were isolated using the Nuclear/Cytosol Fractionation Kit (BioVision Research Products). The full list of antibodies is given in the Key Resources Table.
Mass Spectrometry
ILF2 or IgG immunoprecipitates from untreated or melphalan-treated JJN3 cells were separated in NuPAGE 12% Bis-Tris gels. Gels were silver-stained and de-stained overnight before slice excision. Peptides resulting from in-gel digestion with trypsin (Promega) were extracted from the gel slices for automated liquid chromatography tandem mass chromatography analysis on an Orbitrap-Elite mass spectrometer (Thermo Scientific). Proteins were identified by database searching of the fragment spectra against the SwissProt (EBI) protein database by Mascot (version 2.3, Matrix Science). Typical search settings were: mass tolerances, 10 ppm precursor, 0.8d fragments; variable modifications, methionine sulfoxide, pyro-glutamate formation; trypsin, up to 2 missed cleavages. Only the peptides that did not appear in the IgG immunoprecipitate lanes were considered to be suitable candidates.
Co-Immunoprecipitation Assay
Co-immunoprecipitation of ILF2, YB-1 or U2AF65 complexes was performed by lysing JJN3 cells with NP40 lysis buffer containing phosphatase and protease inhibitor cocktails (Roche) on ice for 1 hr. Lysates were sonicated gently and centrifuged for 10 min at 4°C. One milligram of the lysate was incubated overnight at 4°C with Protein A-agarose beads (Roche) and anti-ILF2 (Abcam, ab113205), anti–YB-1 (Abcam, ab12148), anti-U2AF65 (Santa Cruz, sc53942) -or unspecific (rabbit/mouse immunoglobulin G [IgG], Santa Cruz, sc-2027/2025) antibodies for immunoprecipitation. The immunoprecipitates were then re-suspended in sample buffer, boiled for 5 min, and analyzed by Western blotting or mass spectrometry.
RIP Analyses
RIP analyses were performed on JJN3 and H929 cells using anti-ILF2 (Abcam, ab113205) or anti–YB-1 (Abcam, ab12148) antibodies. In brief, cells were cross-linked in 0.1% formaldehyde for 10 min prior to harvest and lysis. RIP was performed using the Magna RIP RNA-binding protein immunoprecipitation kit (Millipore) according to the manufacturer's instructions. In nuclear RIP experiments, cells were previously resuspended in nuclear isolation buffer (1.28 M sucrose, 40 mM Tris-HCl pH 7.5, 20 mM MgCl2, 4% Triton X-100). RNA in each eluted sample was sequenced and/or reverse-transcribed and measured by quantitative PCR (qPCR).
RNA Sequencing and Analysis
Total RNA from untreated or melphalan-treated JJN3 or H929 cells transduced with non-silencing or the ILF2 shRNA#2 (two independent replicates per condition) were isolated with the RNeasy Mini kit (Qiagen). Libraries were constructed using the Tru-Seq Stranded total RNA kit (Illumina) according to the manufacturer's instructions.
Transcriptomic RNA-Seq was performed on the Illumina HiSeq platform using the standard paired-end protocol. In total, 60-160 million 76-bp reads were generated per sample. An initial sequence-level quality assessment was performed using FastQC (version 0.10.1, Simon Andrews). The RNA-Seq reads were then mapped to the reference human genome (GRCh37) using Tophat2 (Kim et al., 2013), allowing a maximum of two mismatches per 76-bp sequencing end. The NCBI RefSeq gene model and HTSeq software (version 0.5.4p2) (Anders et al., 2015) were used to quantify the gene-level expression. Differential alternative splicing in unpaired replicates was assessed by replicate multivariate analysis of transcript splicing (rMATS) (Shen et al., 2014) using an FDR<0.05. Pathway enrichment analysis was performed with Pathway Studio (Elsevier Inc.).
In parallel experiments, ILF2- or YB-1–bound RNA was immunoprecipitated from JJN3 or H929 cells, and libraries were constructed using the Ovation RNA-Seq System V2 (Nugen) according to the manufacturer's instructions. Reads were mapped to the human genome (GRCh38) using STAR (Dobin et al., 2013). Isoform abundances were quantified using Cufflinks (version 2.2.1) (Trapnell et al., 2012). Low-abundance isoforms in the immunoprecipated samples (fragments per kilobase of transcript per million mapped reads<3) were excluded. Isoforms with significantly increased ILF2 or YB-1 binding were identified using a q value <0.05 and a fold change >1.5 as cutoffs between the input and immunoprecipitate of each sample. Every condition was performed in duplicate.
Quantification and Statistical Analyses
Data were analyzed with a two-tailed t-test or One-Way ANOVA. p<0.05 was considered to be statistically significant. Survival curves were analyzed by Mantel–Cox log-rank test. Statistical analyses were conducted using GraphPad Prism 6 (www.graphpad.com). For all experiments with error bars, the standard deviation (SD) of the mean was calculated to indicate the variation within each experiment.
The sample size for each experiment and the replicate number of experiments are included in the figure legends.
Data Availability
All data sets generated in this study using RNA-Seq and RIP-seq are accessible at GEO under GSE83712 and GSE97323, and GSE83665, respectively.
Supplementary Material
Table S1, related to Figure 1: Identification of 1q21 amplified genes in MM.
Table S2, related to Figure 4: List of proteins bound by ILF2 in untreated and melphalan-treated JJN3 cells.
Table S3, related to Figure 4: List of aberrantly spliced genes in ILF2 shRNA-transduced as compared to non- silencing shRNA-transduced JJN3 and H929 cells
Table S4, related to Figure 4: List of aberrantly spliced genes in melphalan-treated as compared to untreated JJN3 cells and in melphalan-treated ILF2 shRNA-transduced as compared to melphalan-treated non- silencing shRNA-transduced JJN3 cells.
Table S5, related to Figure 5: List of ILF2-bound transcripts in untreated and melphalan-treated cells.
Table S6, related to Figure 6: List of transcripts that were bound by YB-1 in physiological conditions (JJN3) or whose binding to YB-1 was induced by melphalan treatment (melphalan-treated JJN3).
Significance.
Although agents such as proteasome inhibitors and immunomodulatory drugs have significantly improved myeloma outcomes, patients with high-risk disease have a life expectancy of only two or three years. The 1q21 amplification, among the most frequent chromosomal aberrations in MM, is associated with very poor prognosis. Whereas the 1q21 amplicon harbors several critical driver oncogenes, this study highlights the critical role and mechanisms of ILF2 in MM pathobiology and in the regulation of alternative splicing of genes governing DNA repair.
Highlights.
ILF2 is a 1q21 amplification–specific cancer-relevant gene.
ILF2 promotes multiple myeloma cell resistance to DNA-damaging agents.
ILF2 interacts with RNA-binding proteins involved in the DNA damage response.
ILF2/YB-1 interaction modulates DNA damage–induced splicing regulation.
Acknowledgments
This work was supported in part by generous philanthropic contributions to The University of Texas MD Anderson Cancer Center's Moon Shots Program and by the MD Anderson Cancer Center Leukemia SPORE CA100632. M.D.A. was supported by a fellowship from the Associazione Italiana per la Ricerca sul Cancro (AIRC). N.G. is supported by the AIRC IG201415531 grant. Flow cytometry was done with the assistance of the South Campus Flow Cytometry and Cell Sorting Core Laboratory at MD Anderson, which is supported in part by the NIH P30 CA16672 grant. RNA-Seq was performed with the assistance of the Sequencing and Microarray Facility at MD Anderson, which is supported in part by the NIH P30 CA016672 grant. STR DNA fingerprinting was done by the Cancer Center Support Grant-funded Characterized Cell Line core, NCI #CA016672. The authors thank Joseph Muller and Zachary Bohannan for assistance with manuscript editing, Erika Thompson for assistance with the sequencing data, and Marco Ugolotti for assistance with the graphic design.
Footnotes
Author Contributions: S.C. designed and guided the research; S.C., M.M., Y.O., E.F., L.N., M.D.A., P.S., I.G-G., S.J., and N.B. performed research; P.S. performed and analyzed the shRNA screening; M.M. performed immunofluorescence and RNA immunoprecipitation experiments; M.M., Y.O., and E.F. performed Western blot analysis; A.A.S., M.K.S., N.M., L.Z., H.L., and X.P. analyzed RNA-Seq and RIP-Seq data; K.C-D. analyzed flow cytometry data; C-J.W. analyzed array CGH data; S.J. and N.B. performed the in vivo experiments; M.T.F., A.N., V.M., C.B-R, G.D., H.K., N.G., R.O., N.M., G.G-M., and R.A.D. provided critical intellectual contributions throughout the project; S.C. wrote the manuscript.
Supplemental Information includes six figures, and six tables and can be found online.
Publisher's Disclaimer: This is a PDF file of an unedited manuscript that has been accepted for publication. As a service to our customers we are providing this early version of the manuscript. The manuscript will undergo copyediting, typesetting, and review of the resulting proof before it is published in its final citable form. Please note that during the production process errors may be discovered which could affect the content, and all legal disclaimers that apply to the journal pertain.
References
- An G, Acharya C, Deng S, Yi S, Xu Y, Qin X, Sui W, Li Z, Shi L, Zang M, et al. Cytogenetic and clinical marks for defining high-risk myeloma in the context of bortezomib treatment. Experimental hematology. 2014 doi: 10.1016/j.exphem.2014.11.004. [DOI] [PubMed] [Google Scholar]
- Anders S, Pyl PT, Huber W. HTSeq--a Python framework to work with high-throughput sequencing data. Bioinformatics. 2015;31:166–169. doi: 10.1093/bioinformatics/btu638. [DOI] [PMC free article] [PubMed] [Google Scholar]
- Avet-Loiseau H, Li C, Magrangeas F, Gouraud W, Charbonnel C, Harousseau JL, Attal M, Marit G, Mathiot C, Facon T, et al. Prognostic significance of copy-number alterations in multiple myeloma. Journal of clinical oncology : official journal of the American Society of Clinical Oncology. 2009;27:4585–4590. doi: 10.1200/JCO.2008.20.6136. [DOI] [PMC free article] [PubMed] [Google Scholar]
- Barber GN. The NFAR′s (nuclear factors associated with dsRNA): evolutionarily conserved members of the dsRNA binding protein family. RNA biology. 2009;6:35–39. doi: 10.4161/rna.6.1.7565. [DOI] [PubMed] [Google Scholar]
- Beroukhim R, Mermel CH, Porter D, Wei G, Raychaudhuri S, Donovan J, Barretina J, Boehm JS, Dobson J, Urashima M, et al. The landscape of somatic copy-number alteration across human cancers. Nature. 2010;463:899–905. doi: 10.1038/nature08822. [DOI] [PMC free article] [PubMed] [Google Scholar]
- Carrasco DR, Tonon G, Huang Y, Zhang Y, Sinha R, Feng B, Stewart JP, Zhan F, Khatry D, Protopopova M, et al. High-resolution genomic profiles define distinct clinico-pathogenetic subgroups of multiple myeloma patients. Cancer cell. 2006;9:313–325. doi: 10.1016/j.ccr.2006.03.019. [DOI] [PubMed] [Google Scholar]
- Chapman MA, Lawrence MS, Keats JJ, Cibulskis K, Sougnez C, Schinzel AC, Harview CL, Brunet JP, Ahmann GJ, Adli M, et al. Initial genome sequencing and analysis of multiple myeloma. Nature. 2011;471:467–472. doi: 10.1038/nature09837. [DOI] [PMC free article] [PubMed] [Google Scholar]
- Chen Q, Van der Sluis PC, Boulware D, Hazlehurst LA, Dalton WS. The FA/BRCA pathway is involved in melphalan-induced DNA interstrand cross-link repair and accounts for melphalan resistance in multiple myeloma cells. Blood. 2005;106:698–705. doi: 10.1182/blood-2004-11-4286. [DOI] [PMC free article] [PubMed] [Google Scholar]
- Chng WJ, Glebov O, Bergsagel PL, Kuehl WM. Genetic events in the pathogenesis of multiple myeloma. Best practice & research Clinical haematology. 2007;20:571–596. doi: 10.1016/j.beha.2007.08.004. [DOI] [PMC free article] [PubMed] [Google Scholar]
- Colla S, Ong DS, Ogoti Y, Marchesini M, Mistry NA, Clise-Dwyer K, Ang SA, Storti P, Viale A, Giuliani N, et al. Telomere dysfunction drives aberrant hematopoietic differentiation and myelodysplastic syndrome. Cancer cell. 2015;27:644–657. doi: 10.1016/j.ccell.2015.04.007. [DOI] [PMC free article] [PubMed] [Google Scholar]
- Cottini F, Hideshima T, Suzuki R, Tai YT, Bianchini G, Richardson PG, Anderson KC, Tonon G. Synthetic Lethal Approaches Exploiting DNA Damage in Aggressive Myeloma. Cancer discovery. 2015;5:972–987. doi: 10.1158/2159-8290.CD-14-0943. [DOI] [PMC free article] [PubMed] [Google Scholar]
- Decaux O, Lode L, Magrangeas F, Charbonnel C, Gouraud W, Jezequel P, Attal M, Harousseau JL, Moreau P, Bataille R, et al. Prediction of survival in multiple myeloma based on gene expression profiles reveals cell cycle and chromosomal instability signatures in high-risk patients and hyperdiploid signatures in low-risk patients: a study of the Intergroupe Francophone du Myelome. Journal of clinical oncology : official journal of the American Society of Clinical Oncology. 2008;26:4798–4805. doi: 10.1200/JCO.2007.13.8545. [DOI] [PubMed] [Google Scholar]
- Dobin A, Davis CA, Schlesinger F, Drenkow J, Zaleski C, Jha S, Batut P, Chaisson M, Gingeras TR. STAR: ultrafast universal RNA-seq aligner. Bioinformatics. 2013;29:15–21. doi: 10.1093/bioinformatics/bts635. [DOI] [PMC free article] [PubMed] [Google Scholar]
- Dutertre M, Lambert S, Carreira A, Amor-Gueret M, Vagner S. DNA damage: RNA-binding proteins protect from near and far. Trends in biochemical sciences. 2014;39:141–149. doi: 10.1016/j.tibs.2014.01.003. [DOI] [PubMed] [Google Scholar]
- Dutertre M, Sanchez G, Barbier J, Corcos L, Auboeuf D. The emerging role of pre-messenger RNA splicing in stress responses: sending alternative messages and silent messengers. RNA biology. 2011;8:740–747. doi: 10.4161/rna.8.5.16016. [DOI] [PubMed] [Google Scholar]
- Fenech M. Cytokinesis-block micronucleus cytome assay. Nature protocols. 2007;2:1084–1104. doi: 10.1038/nprot.2007.77. [DOI] [PubMed] [Google Scholar]
- Fenech M, Kirsch-Volders M, Natarajan AT, Surralles J, Crott JW, Parry J, Norppa H, Eastmond DA, Tucker JD, Thomas P. Molecular mechanisms of micronucleus, nucleoplasmic bridge and nuclear bud formation in ammalian and human cells. Mutagenesis. 2011;26:125–132. doi: 10.1093/mutage/geq052. [DOI] [PubMed] [Google Scholar]
- Grzasko N, Hus M, Pluta A, Jurczyszyn A, Walter-Croneck A, Morawska M, Chocholska S, Hajek R, Dmoszynska A. Additional genetic abnormalities significantly worsen poor prognosis associated with 1q21 amplification in multiple myeloma patients. Hematological oncology. 2013;31:41–48. doi: 10.1002/hon.2018. [DOI] [PubMed] [Google Scholar]
- Guan D, Altan-Bonnet N, Parrott AM, Arrigo CJ, Li Q, Khaleduzzaman M, Li H, Lee CG, Pe'ery T, Mathews MB. Nuclear factor 45 (NF45) is a regulatory subunit of complexes with NF90/110 involved in mitotic control. Molecular and cellular biology. 2008;28:4629–4641. doi: 10.1128/MCB.00120-08. [DOI] [PMC free article] [PubMed] [Google Scholar]
- Hanamura I, Stewart JP, Huang Y, Zhan F, Santra M, Sawyer JR, Hollmig K, Zangarri M, Pineda-Roman M, van Rhee F, et al. Frequent gain of chromosome band 1q21 in plasma-cell dyscrasias detected by fluorescence in situ hybridization: incidence increases from MGUS to relapsed myeloma and is related to prognosis and disease progression following tandem stem-cell transplantation. Blood. 2006;108:1724–1732. doi: 10.1182/blood-2006-03-009910. [DOI] [PMC free article] [PubMed] [Google Scholar]
- Inoue J, Otsuki T, Hirasawa A, Imoto I, Matsuo Y, Shimizu S, Taniwaki M, Inazawa J. Overexpression of PDZK1 within the 1q12-q22 amplicon is likely to be associated with drug-resistance phenotype in multiple myeloma. The American journal of pathology. 2004;165:71–81. doi: 10.1016/S0002-9440(10)63276-2. [DOI] [PMC free article] [PubMed] [Google Scholar]
- Kim D, Pertea G, Trapnell C, Pimentel H, Kelley R, Salzberg SL. TopHat2: accurate alignment of transcriptomes in the presence of insertions, deletions and gene fusions. Genome biology. 2013;14:R36. doi: 10.1186/gb-2013-14-4-r36. [DOI] [PMC free article] [PubMed] [Google Scholar]
- Klein U, Jauch A, Hielscher T, Hillengass J, Raab MS, Seckinger A, Hose D, Ho AD, Goldschmidt H, Neben K. Chromosomal aberrations +1q21 and del(17p13) predict survival in patients with recurrent multiple myeloma treated with lenalidomide and dexamethasone. Cancer. 2011;117:2136–2144. doi: 10.1002/cncr.25775. [DOI] [PubMed] [Google Scholar]
- Kumar SK, Dispenzieri A, Lacy MQ, Gertz MA, Buadi FK, Pandey S, Kapoor P, Dingli D, Hayman SR, Leung N, et al. Continued improvement in survival in multiple myeloma: changes in early mortality and outcomes in older patients. Leukemia. 2014;28:1122–1128. doi: 10.1038/leu.2013.313. [DOI] [PMC free article] [PubMed] [Google Scholar]
- Kumar SK, Mikhael JR, Buadi FK, Dingli D, Dispenzieri A, Fonseca R, Gertz MA, Greipp PR, Hayman SR, Kyle RA, et al. Management of newly diagnosed symptomatic multiple myeloma: updated Mayo Stratification of Myeloma and Risk-Adapted Therapy (mSMART) consensus guidelines. Mayo Clinic proceedings. 2009;84:1095–1110. doi: 10.4065/mcp.2009.0603. [DOI] [PMC free article] [PubMed] [Google Scholar]
- Mahindra A, Laubach J, Raje N, Munshi N, Richardson PG, Anderson K. Latest advances and current challenges in the treatment of multiple myeloma. Nature reviews Clinical oncology. 2012;9:135–143. doi: 10.1038/nrclinonc.2012.15. [DOI] [PubMed] [Google Scholar]
- Mani M, Carrasco DE, Zhang Y, Takada K, Gatt ME, Dutta-Simmons J, Ikeda H, Diaz-Griffero F, Pena-Cruz V, Bertagnolli M, et al. BCL9 promotes tumor progression by conferring enhanced proliferative, metastatic, and angiogenic properties to cancer cells. Cancer research. 2009;69:7577–7586. doi: 10.1158/0008-5472.CAN-09-0773. [DOI] [PMC free article] [PubMed] [Google Scholar]
- Mermel CH, Schumacher SE, Hill B, Meyerson ML, Beroukhim R, Getz G. GISTIC2.0 facilitates sensitive and confident localization of the targets of focal somatic copy-number alteration in human cancers. Genome biology. 2011;12:R41. doi: 10.1186/gb-2011-12-4-r41. [DOI] [PMC free article] [PubMed] [Google Scholar]
- Montecucco A, Biamonti G. Pre-mRNA processing factors meet the DNA damage response. Frontiers in genetics. 2013;4:102. doi: 10.3389/fgene.2013.00102. [DOI] [PMC free article] [PubMed] [Google Scholar]
- Muller FL, Colla S, Aquilanti E, Manzo VE, Genovese G, Lee J, Eisenson D, Narurkar R, Deng P, Nezi L, et al. Passenger deletions generate therapeutic vulnerabilities in cancer. Nature. 2012;488:337–342. doi: 10.1038/nature11331. [DOI] [PMC free article] [PubMed] [Google Scholar]
- Nair B, Shaughnessy JD, Jr, Zhou Y, Astrid-Cartron M, Qu P, van Rhee F, Anaissie E, Alsayed Y, Waheed S, Hollmig K, et al. Gene expression profiling of plasma cells at myeloma relapse from tandem transplantation trial Total Therapy 2 predicts subsequent survival. Blood. 2009;113:6572–6575. doi: 10.1182/blood-2009-02-207803. [DOI] [PMC free article] [PubMed] [Google Scholar]
- Neben K, Jauch A, Hielscher T, Hillengass J, Lehners N, Seckinger A, Granzow M, Raab MS, Ho AD, Goldschmidt H, Hose D. Progression in smoldering myeloma is independently determined by the chromosomal abnormalities del(17p), t(4;14), gain 1q, hyperdiploidy, and tumor load. Journal of clinical oncology : official journal of the American Society of Clinical Oncology. 2013;31:4325–4332. doi: 10.1200/JCO.2012.48.4923. [DOI] [PubMed] [Google Scholar]
- Nemec P, Zemanova Z, Greslikova H, Michalova K, Filkova H, Tajtlova J, Kralova D, Kupska R, Smetana J, Krejci M, et al. Gain of 1q21 is an unfavorable genetic prognostic factor for multiple myeloma patients treated with high-dose chemotherapy. Biology of blood and marrow transplantation : journal of the American Society for Blood and Marrow Transplantation. 2010;16:548–554. doi: 10.1016/j.bbmt.2009.11.025. [DOI] [PubMed] [Google Scholar]
- Pozzi S, Marcheselli L, Bari A, Liardo EV, Marcheselli R, Luminari S, Quaresima M, Cirilli C, Ferri P, Federico M, Sacchi S. Survival of multiple myeloma patients in the era of novel therapies confirms the improvement in patients younger than 75 years: a population-based analysis. British journal of haematology. 2013;163:40–46. doi: 10.1111/bjh.12465. [DOI] [PubMed] [Google Scholar]
- Shamanna RA, Hoque M, Lewis-Antes A, Azzam EI, Lagunoff D, Pe'ery T, Mathews MB. The NF90/NF45 complex participates in DNA break repair via nonhomologous end joining. Molecular and cellular biology. 2011;31:4832–4843. doi: 10.1128/MCB.05849-11. [DOI] [PMC free article] [PubMed] [Google Scholar]
- Shammas MA, Shmookler Reis RJ, Koley H, Batchu RB, Li C, Munshi NC. Dysfunctional homologous recombination mediates genomic instability and progression in myeloma. Blood. 2009;113:2290–2297. doi: 10.1182/blood-2007-05-089193. [DOI] [PMC free article] [PubMed] [Google Scholar]
- Shaughnessy J, Jr, Tian E, Sawyer J, McCoy J, Tricot G, Jacobson J, Anaissie E, Zangari M, Fassas A, Muwalla F, et al. Prognostic impact of cytogenetic and interphase fluorescence in situ hybridization-defined chromosome 13 deletion in multiple myeloma: early results of total therapy II. British journal of haematology. 2003;120:44–52. doi: 10.1046/j.1365-2141.2003.03948.x. [DOI] [PubMed] [Google Scholar]
- Shaughnessy JD, Jr, Qu P, Usmani S, Heuck CJ, Zhang Q, Zhou Y, Tian E, Hanamura I, van Rhee F, Anaissie E, et al. Pharmacogenomics of bortezomib test-dosing identifies hyperexpression of proteasome genes, especially PSMD4, as novel high-risk feature in myeloma treated with Total Therapy 3. Blood. 2011;118:3512–3524. doi: 10.1182/blood-2010-12-328252. [DOI] [PMC free article] [PubMed] [Google Scholar]
- Shaughnessy JD, Jr, Zhan F, Burington BE, Huang Y, Colla S, Hanamura I, Stewart JP, Kordsmeier B, Randolph C, Williams DR, et al. A validated gene expression model of high-risk multiple myeloma is defined by deregulated expression of genes mapping to chromosome 1. Blood. 2007;109:2276–2284. doi: 10.1182/blood-2006-07-038430. [DOI] [PubMed] [Google Scholar]
- Shen S, Park JW, Lu ZX, Lin L, Henry MD, Wu YN, Zhou Q, Xing Y. rMATS: robust and flexible detection of differential alternative splicing from replicate RNA-Seq data. Proceedings of the National Academy of Sciences of the United States of America. 2014;111:E5593–5601. doi: 10.1073/pnas.1419161111. [DOI] [PMC free article] [PubMed] [Google Scholar]
- Shkreta L, Chabot B. The RNA Splicing Response to DNA Damage. Biomolecules. 2015;5:2935–2977. doi: 10.3390/biom5042935. [DOI] [PMC free article] [PubMed] [Google Scholar]
- Stephens OW, Zhang Q, Qu P, Zhou Y, Chavan S, Tian E, Williams DR, Epstein J, Barlogie B, Shaughnessy JD., Jr An intermediate-risk multiple myeloma subgroup is defined by sIL-6r: levels synergistically increase with ncidence of SNP rs2228145 and 1q21 amplification. Blood. 2012;119:503–512. doi: 10.1182/blood-2011-07-367052. [DOI] [PMC free article] [PubMed] [Google Scholar]
- Trapnell C, Roberts A, Goff L, Pertea G, Kim D, Kelley DR, Pimentel H, Salzberg SL, Rinn JL, Pachter L. Differential gene and transcript expression analysis of RNA-seq experiments with TopHat and Cufflinks. Nature protocols. 2012;7:562–578. doi: 10.1038/nprot.2012.016. [DOI] [PMC free article] [PubMed] [Google Scholar]
- Treon SP, Maimonis P, Bua D, Young G, Raje N, Mollick J, Chauhan D, Tai YT, Hideshima T, Shima Y, et al. Elevated soluble MUC1 levels and decreased anti-MUC1 antibody levels in patients with multiple myeloma. Blood. 2000;96:3147–3153. [PubMed] [Google Scholar]
- Wei WJ, Mu SR, Heiner M, Fu X, Cao LJ, Gong XF, Bindereif A, Hui J. YB-1 binds to CAUC motifs and stimulates exon inclusion by enhancing the recruitment of U2AF to weak polypyrimidine tracts. Nucleic acids research. 2012;40:8622–8636. doi: 10.1093/nar/gks579. [DOI] [PMC free article] [PubMed] [Google Scholar]
- Wu J, Stratford AL, Astanehe A, Dunn SE. YB-1 is a Transcription/Translation Factor that Orchestrates the Oncogenome by Hardwiring Signal Transduction to Gene Expression. Translational oncogenomics. 2007a;2:49–65. [PMC free article] [PubMed] [Google Scholar]
- Wu KL, Beverloo B, Lokhorst HM, Segeren CM, van der Holt B, Steijaert MM, Westveer PH, Poddighe PJ, Verhoef GE, Sonneveld P, et al. Abnormalities of chromosome 1p/q are highly associated with chromosome 13/13q deletions and are an adverse prognostic factor for the outcome of high-dose chemotherapy in patients with multiple myeloma. British journal of haematology. 2007b;136:615–623. doi: 10.1111/j.1365-2141.2006.06481.x. [DOI] [PubMed] [Google Scholar]
- Yuan J, Strack PR, Toniatti C, Pelletier M. A zinc finger nuclease assay to rapidly quantitate homologous recombination proficiency in human cell lines. Analytical biochemistry. 2013;434:96–98. doi: 10.1016/j.ab.2012.11.002. [DOI] [PubMed] [Google Scholar]
- Zhan F, Colla S, Wu X, Chen B, Stewart JP, Kuehl WM, Barlogie B, Shaughnessy JD., Jr CKS1B, overexpressed in aggressive disease, regulates multiple myeloma growth and survival through SKP2- and p27Kip1-dependent and - independent mechanisms. Blood. 2007;109:4995–5001. doi: 10.1182/blood-2006-07-038703. [DOI] [PMC free article] [PubMed] [Google Scholar]
- Zhan F, Huang Y, Colla S, Stewart JP, Hanamura I, Gupta S, Epstein J, Yaccoby S, Sawyer J, Burington B, et al. The molecular classification of multiple myeloma. Blood. 2006;108:2020–2028. doi: 10.1182/blood-2005-11-013458. [DOI] [PMC free article] [PubMed] [Google Scholar]
- Zhang B, Gojo I, Fenton RG. Myeloid cell factor-1 is a critical survival factor for multiple myeloma. Blood. 2002;99:1885–1893. doi: 10.1182/blood.v99.6.1885. [DOI] [PubMed] [Google Scholar]
Associated Data
This section collects any data citations, data availability statements, or supplementary materials included in this article.
Supplementary Materials
Table S1, related to Figure 1: Identification of 1q21 amplified genes in MM.
Table S2, related to Figure 4: List of proteins bound by ILF2 in untreated and melphalan-treated JJN3 cells.
Table S3, related to Figure 4: List of aberrantly spliced genes in ILF2 shRNA-transduced as compared to non- silencing shRNA-transduced JJN3 and H929 cells
Table S4, related to Figure 4: List of aberrantly spliced genes in melphalan-treated as compared to untreated JJN3 cells and in melphalan-treated ILF2 shRNA-transduced as compared to melphalan-treated non- silencing shRNA-transduced JJN3 cells.
Table S5, related to Figure 5: List of ILF2-bound transcripts in untreated and melphalan-treated cells.
Table S6, related to Figure 6: List of transcripts that were bound by YB-1 in physiological conditions (JJN3) or whose binding to YB-1 was induced by melphalan treatment (melphalan-treated JJN3).
Data Availability Statement
All data sets generated in this study using RNA-Seq and RIP-seq are accessible at GEO under GSE83712 and GSE97323, and GSE83665, respectively.