

Abstract
Analysis of drug–target interactions (DTIs) is of great importance in developing new drug candidates for known protein targets or discovering new targets for old drugs. However, the experimental approaches for identifying DTIs are expensive, laborious and challenging. In this study, we report a novel computational method for predicting DTIs using the highly discriminative information of drug-target interactions and our newly developed discriminative vector machine (DVM) classifier. More specifically, each target protein sequence is transformed as the position-specific scoring matrix (PSSM), in which the evolutionary information is retained; then the local binary pattern (LBP) operator is used to calculate the LBP histogram descriptor. For a drug molecule, a novel fingerprint representation is utilized to describe its chemical structure information representing existence of certain functional groups or fragments. When applying the proposed method to the four datasets (Enzyme, GPCR, Ion Channel and Nuclear Receptor) for predicting DTIs, we obtained good average accuracies of 93.16%, 89.37%, 91.73% and 92.22%, respectively. Furthermore, we compared the performance of the proposed model with that of the state-of-the-art SVM model and other previous methods. The achieved results demonstrate that our method is effective and robust and can be taken as a useful tool for predicting DTIs.
Introduction
In the post-genomic era, the identification of interactions between drugs and targets plays a pivot role in developing new drug candidates for current targets and discovering new targets for old drugs. In addition, the identification of DTIs contributes to deciphering the underlying biological mechanisms and further providing great insight into various biological processes. The completion of the human genome project (HGP) and the development of molecular medicine offer great opportunity to detect interactions between drugs and targets. Although much effort has been made in recent years, few of drug candidates have been approved by the Food and Drug Administration (FDA). The main reason lies in the unacceptable toxicity and adverse side-effects for those drug candidates. Recent research definitely indicates that the interactions between drugs and certain protein targets greatly affect the toxicity or side-effects of drug candidates1. With the rapid increasing amount of available knowledge in biology and chemistry, a number of publicly available databases focusing on drug–target relations have been constructed, such as DrugBank2, SuperTarget and Matador3, Kyoto Encyclopedia of Genes and Genomes (KEGG)4, Therapeutic Target Database (TTD)5. These databases contain a small amount of experimentally validated interactions which are crucial for DTIs prediction and are considered as gold standards. Since the detection of DTIs by experimental methods is costly, laborious and inefficient, it is almost impossible for drug companies to carry out all experiments to identify the toxicity or side-effects of drug compound. Therefore, it is highly imperative to develop efficient and accurate computational methods to facilitate the identification of DTIs, which can provide supporting evidence for the experimental studies and therefore accelerate the discovery of new drug candidates and targets.
So far, a number of in silico methods have been developed to address the issues of DTI prediction6–12. There are two main traditional computational methods, namely ligand-based and receptor-based approach. The ligand-based virtual screening method utilizes chemical structure similarity to predict DTIs. For instance, Keiser et al. adopted chemical 2D structural similarity of ligands to predict new molecular targets8. Campillos et al. employed phenotypic side-effect similarities to identify the interactions between drugs and targets9. The ligand-based approach, however, may not perform well for target proteins with a small number of known ligands. Receptor-based method like reverse docking has also been applied in DTI prediction when drug molecule and target protein bind each other10–12. However, this kind of method could not be applied to targets whose 3D structures are unknown. Therefore, the efficient computational methods directly based on protein sequence rather than 3D structure of protein appear to be useful for predicting DTIs.
Recently, a variety of computational methods based on machine learning have been proposed to predict DTIs by building a classification model treating each drug-target pair as one sample13–18. These studies are mainly based on the assumption that similar drug molecules are likely to interact with similar target proteins. The drug-target pairs with known interaction are labeled as positive samples while randomly connected pairs (non-interacting) are treated as negative ones. Each sample is a concatenation of drug feature vector and protein feature vector. Francisco et al. proposed a multi-target QSAR model to predict DTIs by calculating 2D molecular descriptors for drug feature extraction14. Mei et al. proposed their BLM-NII algorithm to predict new target probability of a specified drug which is highly reliable in predicting DTIs15. Chen et al. employed a machine learning based approach to identify drug target groups by integrating the compound information of chemical–chemical similarities, chemical–chemical connections and chemical–protein connections16.
In this study, we attempt to formulate the DTIs as an extended structure–activity relationship (SAR) classification problem. The interactions between drugs and their targets can be considered as “activity” properties, which are largely dependent on the structural information from both drug molecules and target proteins. We represent drugs by their substructure fingerprints representing existence of certain functional groups or fragments, employ local binary pattern (LBP) to transform target protein sequence data and apply principal component analysis (PCA) to the connected feature vector to reduce the impact of noises. Then, our newly developed discriminative vector machine (DVM) classifier is employed in the classification for the four pharmaceutically gold targets: Enzyme, GPCR, Ion Channel and Nuclear Receptor. DVM is a probably approximately correct (PAC) learning algorithm which can reduce the error caused by generalization and has strong robustness19. The achieved results indicate that our method is effective and robust and can be taken as a useful tool for further studies of DTIs.
Results and Discussion
Evaluation metrics
To evaluate the performance of related approaches, four evaluation metrics, including precision (Pre), accuracy (Acc), sensitivity (Sen), and Matthews’s correlation coefficient (MCC), are calculated accordingly. Their corresponding calculating formulas are as follows:
| 1 |
| 2 |
| 3 |
| 4 |
where represents the number of interacting drug-target pairs predicted correctly (i.e., true positive) while stands for the number of non-interacting drug-target pairs predicted correctly (i.e., true negative). Similarly, is the number of non-interacting drug-target pairs falsely predicted to be interacting drug-target pairs (i.e., false positive), and denotes the number of interacting drug-target pairs falsely predicted to be non-interacting drug-target pairs (i.e., false negative). Additionally, receiver operating characteristic (ROC) curves are calculated for evaluating the performance of the proposed method and SVM-based method. A model with no prediction ability would yield the diagonal line. The closer the ROC area is to 1, the higher the prediction ability of model is. To summarize ROC curve in a numerical way, the area under an ROC curve (AUC) is calculated accordingly.
Results of proposed method on the four gold datasets
In this study, to reduce data dependence and avoid overfitting of the proposed method, five-fold cross validation was employed as testing strategy. Specifically, each dataset (Enzyme, GPCR, Ion Channel and Nuclear Receptor) was randomly split into five parts of roughly equal size of which four parts of them served to train the DVM model, and the remaining part was set aside for testing in turn. The whole process is repeated five times and five prediction models were constructed, tested and evaluated separately. To be fair, the parameters of DVM classifier were set to the same on all the four datasets.
The five-fold cross validation results of the proposed method on all the four benchmark datasets are listed in Tables 1–4. When applying the proposed method to the Enzyme dataset, we obtain the best prediction results of average precision (Pre), accuracy (Acc), sensitivity (Sen), Matthews’s correlation coefficient (MCC) and area under ROC curve (AUC) of 93.18%, 93.16%, 92.90%, 86.32% and 92.88%, respectively, and their standard deviations are 0.64%, 0.43%, 1.19%, 0.88% and 0.87%, respectively (see Table 1). On the GPCR dataset, our method yields the average precision, accuracy, sensitivity, MCC and AUC of 89.40%, 89.37%, 89.27%, 78.77% and 88.56%, respectively, and their standard deviations are 1.10%, 1.21%, 2.30%, 2.41% and 1.74%, respectively (see Table 2). Similarly, it can be seen from Table 3 that the average precision, accuracy, sensitivity, MCC and AUC on the Icon Channel dataset reach 90.90%, 91.73%, 92.65%, 83.47% and 91.71%, respectively, and the corresponding standard deviations are 0.47%, 0.96%, 1.74%, 1.94% and 1.36%, respectively. In Table 4, the averages of precision, accuracy, sensitivity, MCC and AUC on the Nuclear Receptor dataset are 88.67%, 92.22%, 96.62%, 84.80% and 93.00% respectively. However, their standard deviations are 4.43%, 2.32%, 3.13%, 4.60% and 4.19%, respectively, which are the highest values in the four tables. The possible reason for such results is that the number of samples in the Nuclear Receptor dataset is only 90, relatively less than that of other datasets. The receiver operating characteristic (ROC) curves performed by our method on the four benchmark datasets are illustrated in Figures 1–4.
Figure 2.
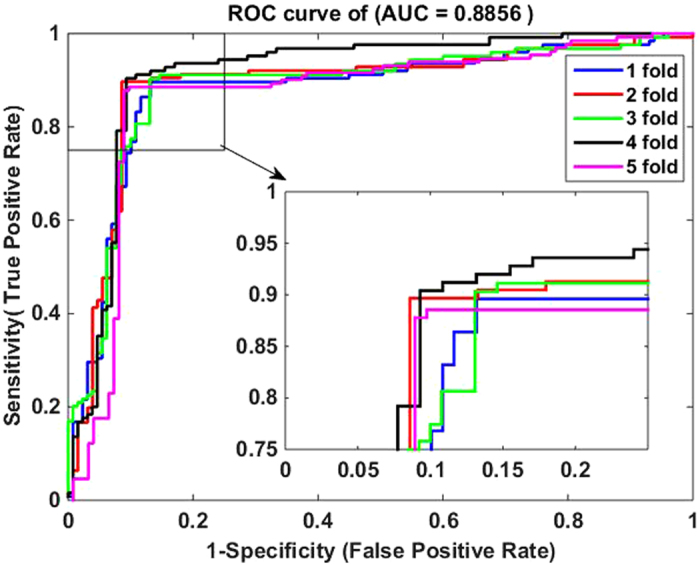
ROC curves by our method on the GPCR dataset.
Figure 3.
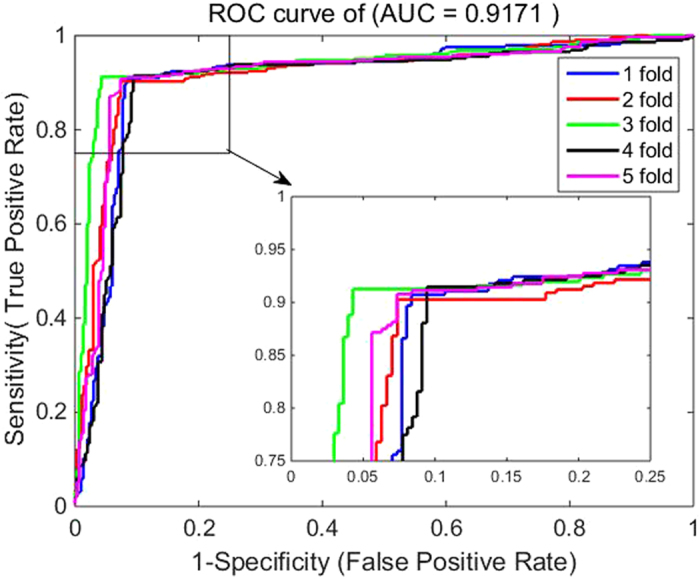
ROC curves by our method on the Icon Channel dataset.
Table 1.
Five-fold cross validation results by our method on the Enzyme dataset.
| Test set | Pre (%) | Acc (%) | Sen (%) | MCC (%) | AUC (%) |
|---|---|---|---|---|---|
| 1 | 94.10 | 93.33 | 92.12 | 86.67 | 93.21 |
| 2 | 92.37 | 93.33 | 94.29 | 86.69 | 92.94 |
| 3 | 93.06 | 92.56 | 92.28 | 85.13 | 91.93 |
| 4 | 92.92 | 92.91 | 91.73 | 85.74 | 92.22 |
| 5 | 93.46 | 93.68 | 94.09 | 87.35 | 94.13 |
| Average | 93.18 ± 0.64 | 93.16 ± 0.43 | 92.90 ± 1.19 | 86.32 ± 0.88 | 92.88 ± 0.87 |
Table 4.
Five-fold cross validation results by our method on the Nuclear Receptor dataset.
| Test set | Prec (%) | Accu (%) | Sen (%) | MCC (%) | AUC (%) |
|---|---|---|---|---|---|
| 1 | 94.12 | 94.44 | 94.12 | 88.85 | 93.50 |
| 2 | 83.33 | 88.89 | 93.75 | 78.26 | 91.67 |
| 3 | 90.91 | 91.67 | 95.24 | 82.83 | 86.69 |
| 4 | 90.00 | 94.44 | 100.00 | 89.44 | 97.81 |
| 5 | 85.00 | 91.67 | 100.00 | 84.60 | 95.31 |
| Average | 88.67 ± 4.43 | 92.22 ± 2.32 | 96.62 ± 3.13 | 84.80 ± 4.60 | 93.00 ± 4.19 |
Table 2.
Five-fold cross validation results by our method on the GPCR dataset.
| Test set | Pre (%) | Acc (%) | Sen (%) | MCC (%) | AUC (%) |
|---|---|---|---|---|---|
| 1 | 88.80 | 87.80 | 86.72 | 75.61 | 87.73 |
| 2 | 89.68 | 90.55 | 91.13 | 81.11 | 88.71 |
| 3 | 90.32 | 88.58 | 86.82 | 77.23 | 88.31 |
| 4 | 90.40 | 90.55 | 90.40 | 81.10 | 91.37 |
| 5 | 87.79 | 89.37 | 91.27 | 78.81 | 86.69 |
| Average | 89.40 ± 1.10 | 89.37 ± 1.21 | 89.27 ± 2.30 | 78.77 ± 2.41 | 88.56 ± 1.74 |
Table 3.
Five-fold cross validation results by our method on the Icon Channel dataset.
| Test set | Pre (%) | Acc (%) | Sen (%) | MCC (%) | AUC (%) |
|---|---|---|---|---|---|
| 1 | 90.72 | 91.19 | 91.35 | 82.37 | 90.89 |
| 2 | 90.28 | 91.36 | 93.51 | 82.71 | 91.91 |
| 3 | 91.26 | 93.39 | 94.91 | 86.81 | 93.75 |
| 4 | 91.47 | 91.02 | 90.54 | 82.04 | 90.14 |
| 5 | 90.79 | 91.69 | 92.93 | 83.41 | 91.85 |
| Average | 90.90 ± 0.47 | 91.73 ± 0.96 | 92.65 ± 1.74 | 83.47 ± 1.94 | 91.71 ± 1.36 |
Figure 1.
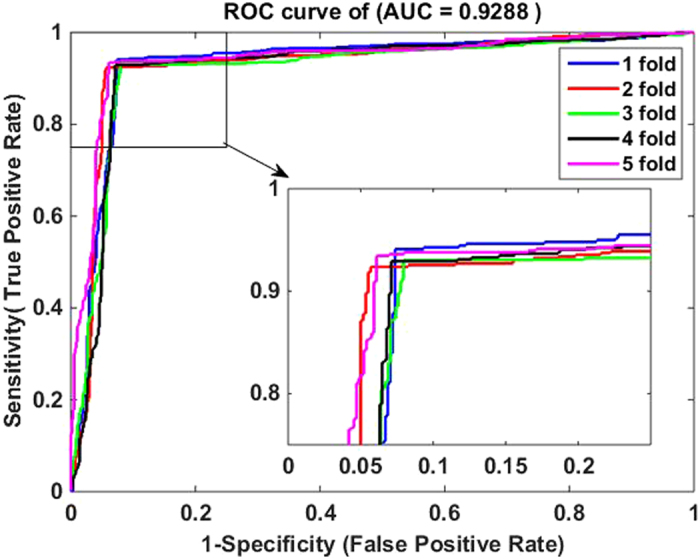
ROC curves by our method on the Enzyme dataset.
Figure 4.
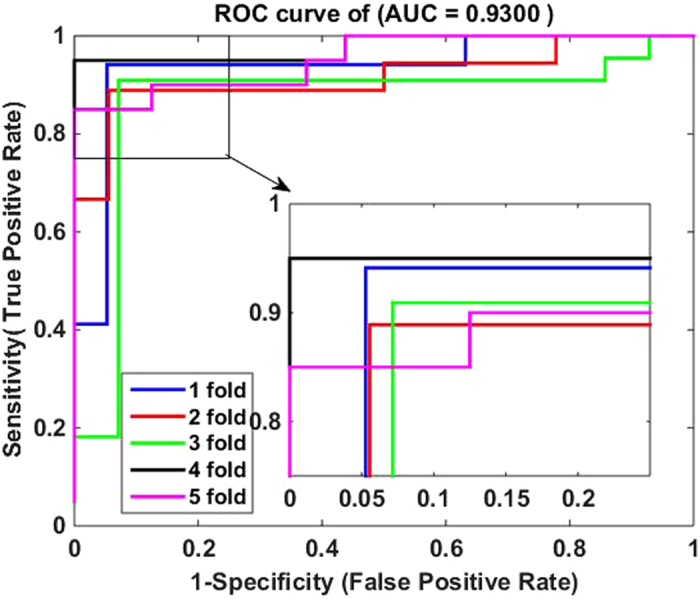
ROC curves by our method on the Nuclear Receptor dataset.
From Tables 1–4, we can observe that the powerful DVM-based prediction model combined with LBP histogram protein descriptor and drug substructure fingerprints is accurate, effective and robust for predicting drug-target interactions. We owe the good performance of the proposed method to the choice of effective feature extraction method and the powerful DVM classifier. In addition, the LBP histogram descriptors of target proteins not only retain the sufficient evolutionary information of amino acids, but also differentiate amino acids effectively while substructure fingerprints also contain highly discriminative information of drugs.
To validate the performance of our unbiased method not strongly related to the selection of negative samples, without loss of generality, we also carried out additional five-fold cross validation with five different negative training samples (non-interacting) randomly selected from the GPCR and drug molecules dataset. As shown in Table 5, although the obtained results on different negative training samples are slight different, these results are consistency in general and the average precision, accuracy, sensitivity, MCC and AUC are all higher than 89%, 88%, 87%,77% and 86%, respectively, which further demonstrate that our approach for selecting negative samples in this study is appropriate for assessing prediction performance.
Table 5.
Comparisons of five-fold cross validation prediction performance using five different randomly selected negative training samples on the GPCR dataset.
| Negative Samples | Prec (%) | Accu (%) | Sen (%) | MCC (%) | AUC (%) |
|---|---|---|---|---|---|
| 1 | 89.65 ± 2.20 | 88.61 ± 0.95 | 89.50 ± 1.62 | 79.21 ± 1.92 | 89.84 ± 1.26 |
| 2 | 89.13 ± 2.04 | 88.98 ± 2.25 | 87.87 ± 2.64 | 77.98 ± 2.59 | 86.67 ± 2.15 |
| 3 | 90.39 ± 2.33 | 90.16 ± 1.72 | 89.91 ± 1.39 | 80.35 ± 1.41 | 91.14 ± 1.64 |
| 4 | 91.68 ± 2.89 | 90.08 ± 2.51 | 88.36 ± 2.74 | 80.50 ± 2.03 | 90.04 ± 2.99 |
| 5 | 89.74 ± 2.69 | 89.37 ± 1.95 | 89.06 ± 2.98 | 78.88 ± 2.15 | 89.76 ± 2.43 |
Comparisons between discriminative vector machine and support vector machine
To further evaluate the proposed method, the state-of-the-art support vector machine (SVM) classifier was constructed accordingly. Here we used LIBSVM toolbox as SVM classifier to carry out the prediction of DTIs. To be fair, the two methods adopted the same feature data on all the four gold dataset. A general grid search scheme was used to optimize LIBSVM’s two parameters (regularization parameter , kernel width parameter ) and they (, ) were at last tuned to 0.5 and 0.7, respectively. Additionally, Gaussian function was chosen as the kernel function. For the DVM and SVM classifiers, all the input feature vectors were normalized in the range of [0, 1].
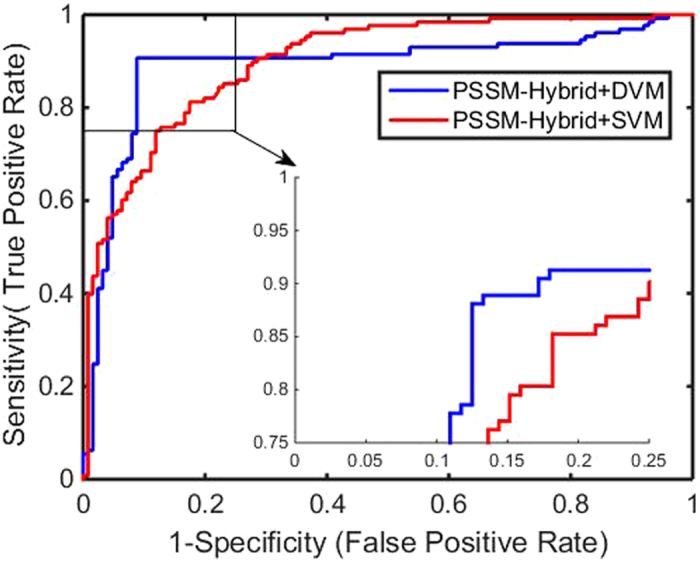
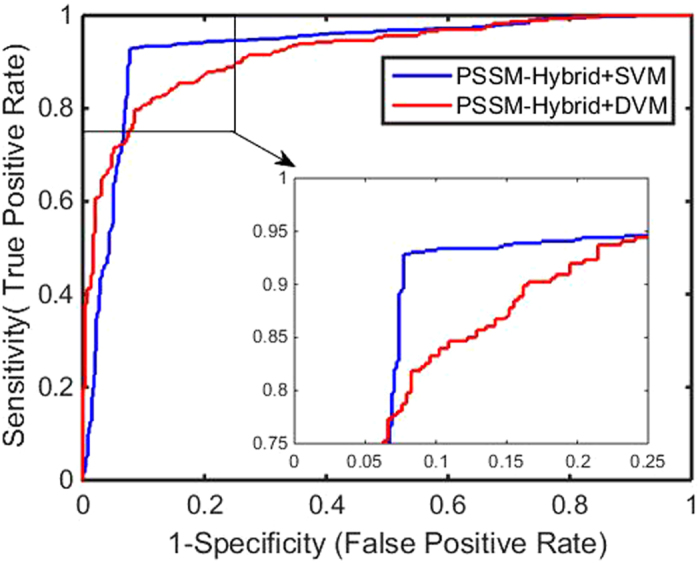
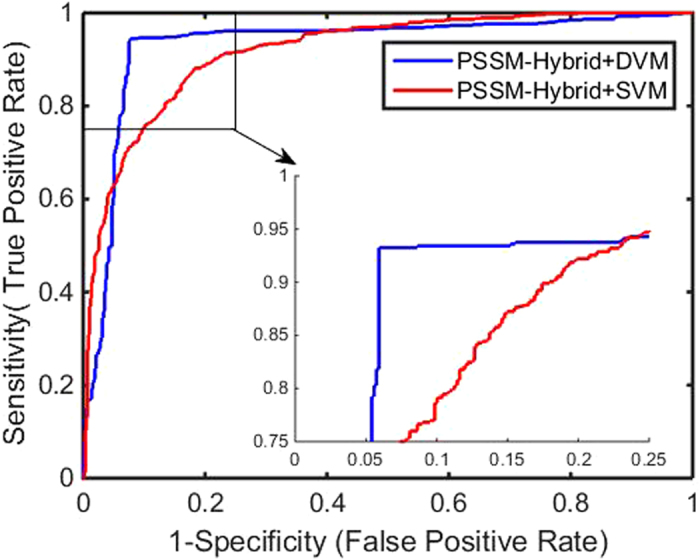
The predictive results of the two methods are summarized in Tables 6–9 and the corresponding ROC curves are illustrated in Figures 5–8. It can be drawn from these tables and figures that the achieved results hold nearly the same varying tendency. Taking the Ion Channel dataset as an example, the averages of Pre, Acc, Sen, MCC and AUC of SVM reach 85.12%, 85.59%, 86.24%, 71.24% and 85.89%, respectively, significantly lower than those by DVM, which are 90.90%, 91.73%, 92.65%, 83.47% and 91.71%, respectively. Similarly, the majority of their standard deviations of SVM are also higher than those of DVM. Additionally, as shown in Figures 5–8, the ROC curves of the DVM-based prediction model are superior to those of the SVM-based classifier, which suggests that DVM with the same feature descriptors performs better than SVM in general. There are two possible reasons for such results. (1) Based on k nearest neighbors (kNNs), robust M-estimator and manifold regularization, DVM reduces the influence of outliers and overcomes the weakness of the kernel function to meet the Mercer condition. (2) Although there are three parameters (β, γ, and θ) in DVM model, those parameters slightly affect its performance and they are more easily tuned than those of SVM.
Table 7.
Five-fold cross validation results on the GPCR dataset of DVM and SVM.
| Model | Testing Set | Pre (%) | Acc (%) | Sen (%) | MCC (%) | AUC (%) |
|---|---|---|---|---|---|---|
| SVM | 1 | 85.04 | 85.43 | 85.71 | 70.87 | 84.92 |
| 2 | 85.82 | 83.86 | 83.94 | 67.59 | 84.86 | |
| 3 | 84.03 | 84.25 | 82.64 | 68.42 | 85.43 | |
| 4 | 83.87 | 85.43 | 85.95 | 70.85 | 87.18 | |
| 5 | 87.41 | 88.58 | 90.77 | 77.19 | 88.64 | |
| Average | 85.23 ± 1.30 | 85.51 ± 1.66 | 85.80 ± 2.76 | 70.98 ± 3.37 | 86.21 ± 1.48 | |
| DVM | 1 | 88.80 | 87.80 | 86.72 | 75.61 | 87.73 |
| 2 | 89.68 | 90.55 | 91.13 | 81.11 | 88.71 | |
| 3 | 90.32 | 88.58 | 86.82 | 77.23 | 88.31 | |
| 4 | 90.40 | 90.55 | 90.40 | 81.10 | 91.37 | |
| 5 | 87.79 | 89.37 | 91.27 | 78.81 | 86.69 | |
| Average | 89.40 ± 1.10 | 89.37 ± 1.21 | 89.27 ± 2.30 | 78.77 ± 2.41 | 88.56 ± 1.74 |
Table 8.
Five-fold cross validation results on the Ion Channel dataset of DVM and SVM.
| Model | Testing Set | Pre (%) | Acc (%) | Sen (%) | MCC (%) | AUC (%) |
|---|---|---|---|---|---|---|
| SVM | 1 | 84.46 | 85.93 | 87.11 | 71.90 | 85.40 |
| 2 | 85.71 | 84.58 | 83.11 | 69.19 | 85.19 | |
| 3 | 87.75 | 86.10 | 85.48 | 72.20 | 86.11 | |
| 4 | 83.55 | 84.75 | 86.39 | 69.53 | 85.48 | |
| 5 | 84.11 | 86.61 | 89.12 | 73.36 | 87.28 | |
| Average | 85.12 ± 1.67 | 85.59 ± 0.89 | 86.24 ± 2.21 | 71.24 ± 1.80 | 85.89 ± 0.85 | |
| DVM | 1 | 90.72 | 91.19 | 91.35 | 82.37 | 90.89 |
| 2 | 90.28 | 91.36 | 93.51 | 82.71 | 91.91 | |
| 3 | 91.26 | 93.39 | 94.91 | 86.81 | 93.75 | |
| 4 | 91.47 | 91.02 | 90.54 | 82.04 | 90.14 | |
| 5 | 90.79 | 91.69 | 92.93 | 83.41 | 91.85 | |
| Average | 90.90 ± 0.47 | 91.73 ± 0.96 | 92.65 ± 1.74 | 83.47 ± 1.94 | 91.71 ± 1.36 |
Figure 6.
Comparison of ROC curves between DVM and SVM on the GPCR dataset.
Figure 7.
Comparison of ROC curves between DVM and SVM on the Ion Channel dataset.
Table 6.
Five-fold cross validation results on the Enzyme dataset of DVM and SVM.
| Model | Testing Set | Pre (%) | Acc (%) | Sen (%) | MCC (%) | AUC (%) |
|---|---|---|---|---|---|---|
| SVM | 1 | 90.24 | 90.68 | 91.31 | 81.37 | 90.70 |
| 2 | 88.64 | 89.15 | 89.71 | 78.30 | 88.47 | |
| 3 | 89.85 | 90.00 | 90.60 | 79.99 | 89.96 | |
| 4 | 90.39 | 91.71 | 92.78 | 83.44 | 91.37 | |
| 5 | 90.81 | 89.68 | 88.51 | 79.38 | 89.26 | |
| Average | 89.99 ± 0.74 | 90.24 ± 0.88 | 90.58 ± 1.44 | 80.50 ± 1.78 | 89.95 ± 1.02 | |
| DVM | 1 | 94.10 | 93.33 | 92.12 | 86.67 | 93.21 |
| 2 | 92.37 | 93.33 | 94.29 | 86.69 | 92.94 | |
| 3 | 93.06 | 92.56 | 92.28 | 85.13 | 91.93 | |
| 4 | 92.92 | 92.91 | 91.73 | 85.74 | 92.22 | |
| 5 | 93.46 | 93.68 | 94.09 | 87.35 | 94.13 | |
| Average | 93.18 ± 0.64 | 93.16 ± 0.43 | 92.90 ± 1.19 | 86.32 ± 0.88 | 92.88 ± 0.87 |
Table 9.
Five-fold cross validation results on the Nuclear Receptordataset of DVM and SVM.
| Model | Testing Set | Pre (%) | Acc (%) | Sen (%) | MCC (%) | AUC (%) |
|---|---|---|---|---|---|---|
| SVM | 1 | 83.33 | 83.33 | 83.33 | 66.67 | 84.26 |
| 2 | 80.00 | 86.11 | 94.12 | 73.41 | 86.38 | |
| 3 | 86.67 | 75.00 | 65.00 | 52.92 | 71.56 | |
| 4 | 76.47 | 75.00 | 72.22 | 50.08 | 73.46 | |
| 5 | 82.35 | 83.33 | 82.35 | 66.56 | 83.59 | |
| Average | 81.76 ± 3.41 | 80.55 ± 4.65 | 79.40 ± 10.00 | 61.93 ± 8.91 | 79.85 ± 6.09 | |
| DVM | 1 | 94.12 | 94.44 | 94.12 | 88.85 | 93.50 |
| 2 | 83.33 | 88.89 | 93.75 | 78.26 | 91.67 | |
| 3 | 90.91 | 91.67 | 95.24 | 82.83 | 86.69 | |
| 4 | 90.00 | 94.44 | 100.00 | 89.44 | 97.81 | |
| 5 | 85.00 | 91.67 | 100.00 | 84.60 | 95.31 | |
| Average | 88.67 ± 4.43 | 92.22 ± 2.32 | 96.62 ± 3.13 | 84.80 ± 4.60 | 93.00 ± 4.19 |
Figure 5.
Comparison of ROC curves between DVM and SVM on the Enzyme dataset.
Figure 8.
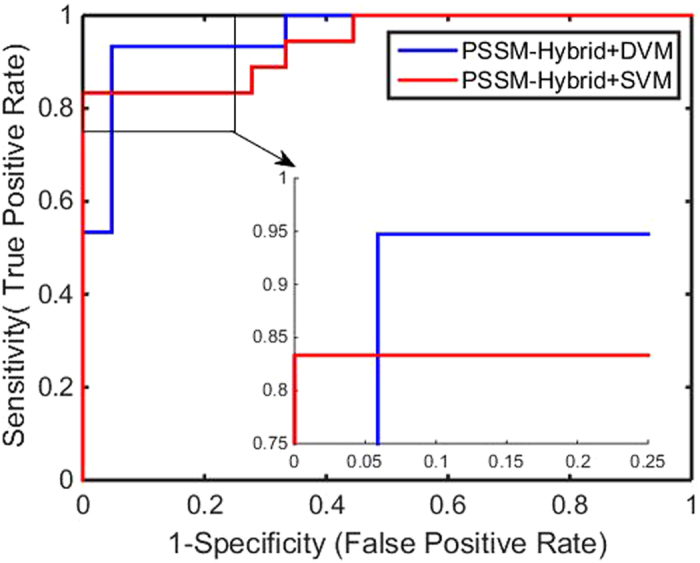
Comparison of ROC curves between DVM and SVM on the Nuclear Receptor dataset.
Comparison with previous studies
As mentioned before, there are a variety of computational methods for predicting drug-target interactions. To further illustrate the effectiveness of the proposed approach, we compared its performance with other published methods which adopted the same five-fold cross validation framework and were based on the same four datasets. Table 10 lists the average AUC (area under the receiver operating curve) values for the method by Jian-yu Shen et al.20, NetCBP21, the method by Yanamishi et al.22, KBMF2K7, and our proposed method. It can be observed that the proposed method has an obvious improvement in the prediction performance for DTIs in term of AUC. The average growths of our result to the best result of four previous methods on the datasets of Enzyme, GPCR, Ion Channel and Nuclear Receptor are 9.92%, 1.21%, 13.08% and 6.77%, respectively. The high predictive performance of the proposed method may attribute to the novel feature extraction method which extracts highly discriminative information of target proteins and drug molecules, and the use of DVM classifier which has been demonstrated to be robust and powerful.
Table 10.
Prediction performances of NetCBP21, Yamanishi et al.22, KBMF2K7, and our method on the four benchmark datasets in terms of average AUC.
| Dataset | Our method | Shen et al. (2015) | NetCBP | Yamanishi et al.(2010) | KBMF2K |
|---|---|---|---|---|---|
| Enzyme | 0.9288 ± 0.0087 | 0.812 | 0.8251 | 0.845 | 0.832 |
| GPCR | 0.8856 ± 0.0174 | 0.875 | 0.8235 | 0.812 | 0.857 |
| Icon Channel | 0.9171 ± 0.0136 | 0.811 | 0.8034 | 0.731 | 0.799 |
| Nuclear Receptor | 0.9300 ± 0.0419 | 0.871 | 0.8394 | 0.830 | 0.824 |
Conclusion
In the post-genomic era, study of drug-target interactions is very important in developing new drug candidates for current targets and discovering new targets for old drugs. However, experimental methods for identifying DTIs are time-consuming, costly and challenging even nowadays. In this work, we propose a novel computational method for predicting DTIs which makes the best of the substructure fingerprints of drug molecules and the sequence information of target proteins. Additionally, the biological evolutionary information of protein is also taken into account during the process of feature extraction. When applied to the four benchmark datasets (Enzyme, GPCR, Ion Channel and Nuclear Receptor), the proposed method achieves average accuracies of 93.16%, 89.37%, 91.73% and 92.22%, respectively. To further evaluate the performance of the proposed method, it is compared with SVM-based model and other previous approaches. The achieved results show that our proposed method is highly competitive and can be taken as a powerful tool for predicting drug-target interactions.
Materials and Methods
Gold standard datasets
In this study, we evaluate the predictive method of DTIs on four gold benchmark datasets, namely Enzyme, GPCR, Ion Channel and Nuclear Receptor, which are from KEGG BRITE23, SuperTarget & Matador3, DrugBank24 and BRENDA25, respectively. As shown in Table 11 the number of known drugs targeting Enzyme, GPCR, Ion Channel and Nuclear Receptor, are 445, 223, 210 and 54, respectively, and the number of known protein targeted by these drugs are 664, 95, 204 and 26, respectively. The number of known interactions between these drugs and targets are 2926, 635, 1476 and 90, respectively. Therefore, the total interacting pairs of drug-target are 5127 and they are then employed to build the positive samples in the cross-validation experiments.
Table 11.
The four drug–target interaction datasets.
| Dataset | drug compounds | target proteins | Interactions |
|---|---|---|---|
| Enzyme | 445 | 664 | 2926 |
| GPCR | 223 | 95 | 635 |
| Ion Channel | 210 | 204 | 1476 |
| Nuclear Receptor | 54 | 26 | 90 |
In general, drug-target interactions network is usually formulated as a bipartite graph where drug molecules and target proteins are nodes and the known drug–target interactions are edges between these nodes. Compared with a fully connected bipartite graph, the number of initial edges is extremely small. Take ion channel dataset as an example, its corresponding bipartite graph has up to 210 × 204 = 42840 edges. However, there are only 1476 initial connections which is significantly less than the number of possible negative samples (42840–1476 = 42364). To correct the bias caused by the imbalance samples, we randomly selected the non-interacting drug-target pairs (as negative samples) with the same number of the interacting drug-target pairs (as positive samples). As a matter of fact, such a set of negative samples generated randomly may contain very few drug-target pairs interacting really; nevertheless, in view of the large scale of DTIs, the number of real interactions pairs possibly collected in negative sets is very small.
Representation of drug molecules and target proteins
Representation of drug molecules
A variety of descriptors for encoding drug compounds have been proposed, including topological, constitutional, geometrical and quantum chemical properties etc. Additionally, recent studies indicate that drug compounds can also be effectively represented by the molecular substructure fingerprints26, 27. Substructure fingerprints can directly encode molecular structure information in binary bits which denote the absence or presence of specific substructures of a given drug molecule. If a substructure exists in a given drug molecule, the corresponding bit in fingerprint is assigned to 1, or else to 0. Although the substructure fingerprint divides the whole molecule into a number of fragments, it has the ability to retain highly discriminative structural information of drug molecules. In addition, it does not require the 3D conformation of drug compound and thereby does not cause error accumulation. The substructure fingerprints sets adopted in this study are collected from the PubChem system. The drug fingerprints record the information of mostly common 615 substructures and therefore the length of feature vector of drug molecule is 615.
Representation of target proteins
Effective protein descriptors can provide highly discriminatory nature for identifying DTIs and thus boost the performance of prediction model. Up to now, there are many feature descriptors proposed for protein sequences. Most of these descriptors are based on the position-specific scoring matrix (PSSM) of protein sequences. PSSM is a representation of a protein sequence which provides the probability of any given amino acid occurring at a particular position and carries the evolutionary information of the sequence28. In this study, we adopt the position specific iterated BLAST (PSI-BLAST) tool to create PSSMs for all target protein sequences, via 3 iterations setting the E-value cutoff at 0.001 for the query protein sequence against multiple sequence alignment. The PSSM of a query protein sequence can be expressed as
| 5 |
where is the length of the protein sequence and 20 denotes the 20 standard amino acids; is the score for the amino acid in the position of the given protein sequence29.
Local binary pattern (LBP)30 is a powerful operator for image description that is based on the signs of differences of neighboring pixels. Despite its simplicity, LBP is very descriptive and has been successfully applied to a wide variety of different tasks. The original version of the descriptor labels the pixels by threshold the 3 × 3 neighborhood of each pixel with the center value and summing the threshold values weighted by 2 to the power of . Given a pixel of an image, an LBP operator is calculated as follow:
| 6 |
where is the value of central pixel, is the value of its neighbors, represents the total number of sampling points and is the radius of the neighborhood. Furthermore, two extensions of original operator are proposed by Ojala et al.30. (1) Different sizes of neighborhood were employed to retain discriminative features at different scales. (2) Uniform patterns were proposed to use a small subset of patterns, which contain at most two bitwise transitions from 0 to 1 or vice versa. After labeling an image with a LBP operator, a histogram of the labeled image can be defined as
| 7 |
where is the number of different labels produced by LBP operator and is 1 if is true and 0 otherwise. In this work, each PSSM matrix of a protein sequence is treated as an image and the number of neighbors is set to 8. After a PSSM matrix is processed by LBP histogram operator, a corresponding 256-dimentioanl feature vector is formed accordingly.
feature reduction by PCA
Principal component analysis (PCA) is a statistical method that uses an orthogonal transformation to convert a set of observations of possibly correlated variables into a set of values of linearly uncorrelated variables called principal components. To reduce computing load and the influence of noise, PCA is introduced to extract the most discriminatory low-dimensional features of both drugs and target proteins. The obtained compact representations of drug compounds and target proteins are then employed to identify their interactions.
Discriminative Vector Machine
Classification is a fundamental issue in pattern recognition field and there are a wide variety of classification algorithms. In this study, our newly developed discriminative vector machine (DVM) classifier is adopted for classification prediction. DVM is a probably approximately correct (PAC) learning model which can reduce error accumulation and has strong robustness19. Given a test sample , the first step of DVM is to find its top nearest neighbors (kNNs) to suppress the effect of outliers. The kNNs of can be expressed by X k = [x 1, x 2, …, x k], where is the nearest neighbor. For convenience, can be also represented as X k = [x k,1, x k,2, …, x k,c], where comes from the class. Then the objective of DVM is to solve the following minimization problem:
| 8 |
where is the element of and has the form of or , where is the coefficient from the class. is a M-estimator used to improve the robustness of DVM. There are many robust estimators like Welsch M-estimator, MBA (Median Ball Algorithm) estimator and Cauchy M-estimator31. In this study, a robust Welsch M-estimator ) is adopted to attenuate error accumulation so that outliers would have less impact on prediction. ||β k|| is a norm of β k and the corresponding l2-norm is adopted accordingly. The last section of equation (8) is the manifold regularization where is the similarity between the and the nearest neighbor (NN) of . In this work, is defined as the cosine distance between the and the NN of . Thus the corresponding Laplacian matrix L can be depicted as
| 9 |
where is the similarity matrix whose element is is a diagonal matrix whose element is the sum of . According to equation (9), the last section of equation (8) can be represented as . Construct a diagonal matrix P = diag(p i) whose element is
| 10 |
where is the kernel size which can be calculated by:
| 11 |
where θ is a constant to suppress the effect of outliers. In this work, it is set to 1.0 as in the literature32. Based on the equations (9), (10) and (11), the minimization of the equation (8) can be represented as
| 12 |
According to the theory of half-quadratic minimization, the global solution of equation (12) can be addressed by:
| 13 |
After the related coefficients for each class are calculated, the test sample can be identified as the class if the residual is minimal.
| 14 |
In this work, there are two classes in total to be identified: non-interacting drug-target pair (class 1) and interacting drug-target pair (class 2). If are less than , the sample will be classified as non-interacting drug-target pair (class 1), otherwise as interacting drug-target pair (class 2). For three free parameters (, , ) of the DVM model, it is time-consuming to directly search their optimal values. It is gratifying that DVM model is so stable that all these parameters only affect its performance slightly if they are set in the feasible ranges. Based on the above knowledge and through grid search, the parameters and are assigned as 1E-3 and 1E-4 respectively. Just as described before, is a constant and is set to 1 throughout the whole process. Actually, for large data set, the DVM classifier would spend relatively more time in finding the representative vector, so multi-dimensional indexing techniques can be adopted to speed up search process to a certain extent.
Procedure of proposed method
In this work, the procedure of our proposed method mainly consists of two steps: feature extraction and classification prediction. The feature extraction also contains two sub steps: (1) the PSI-BLAST tool is employed to represent each target protein sequence and the corresponding PSSM is obtained; then LBP operator is used to obtain LBP histogram vector. (2) Based on substructure information of drug molecule, the fingerprint vector of drug molecule is calculated. Then the corresponding DTI pair is constructed by concatenating the two vectors of protein sequence and drug substructure. To reduce the computational burden and suppress the effect of noise, principal component analysis (PCA) method is then employed to extract the highly discriminatory feature information. As mentioned before, each of the four datasets (Enzyme, GPCR, Ion Channel and Nuclear Receptor) is divided into training set and test set separately. Then the classification prediction on each dataset is also divided into two sub-procedures. (1) The training set is used to train the DVM model; (2) the trained DVM model is employed to predict DTIs on the four datasets and the performance metrics are evaluated correspondingly. In the same way, the SVM model is also built for predicting DTIs on these four datasets. The flow chart of our approach is shown as Figure 9.
Figure 9.

Flow chart of the proposed method.
Acknowledgements
This work is supported in part by the National Science Foundation of China, under Grants 61373086, 61572506, and in part by the Pioneer Hundred Talents Program of Chinese Academy of Sciences. The authors would like to thank all anonymous reviewers for their constructive advices.
Author Contributions
Z.L., Z.Y. and X.L. conceived the algorithm, carried out the analyses, prepared the data sets, carried out experiments, and wrote the manuscript. P.H., Y.Z., H.Y., R.N. and X.C. designed, performed and analyzed experiments and wrote the manuscript. All authors read and approved the final manuscript.
Competing Interests
The authors declare that they have no competing interests.
Footnotes
Zhengwei Li and Pengyong Han contributed equally to this work.
Publisher's note: Springer Nature remains neutral with regard to jurisdictional claims in published maps and institutional affiliations.
Contributor Information
Zhu-Hong You, Email: zhuhongyou@ms.xjb.ac.cn.
Xiao Li, Email: xiaoli@ms.xjb.ac.cn.
References
- 1.Brouwers L, Iskar M, Zeller G, van Noort V, Bork P. Network neighbors of drug targets contribute to drug side-effect similarity. PloS one. 2011;6:1–7. doi: 10.1371/journal.pone.0022187. [DOI] [PMC free article] [PubMed] [Google Scholar]
- 2.Wang D, Wilfred F, Chai Z. Recent advances in computational actinoid chemistry. Chemical Society Reviews. 2012;41.17:5836–5865. doi: 10.1039/c2cs15354h. [DOI] [PubMed] [Google Scholar]
- 3.Gunther S, et al. SuperTarget and Matador: resources for exploring drug-target relationships. Nucleic Acids Res. 2008;36:919–922. doi: 10.1093/nar/gkm862. [DOI] [PMC free article] [PubMed] [Google Scholar]
- 4.Kanehisa M, Goto S, Sato Y, Furumichi M, Tanabe M. KEGG for integration and interpretation of large-scale molecular data sets. Nucleic Acids Res. 2012;40:109–114. doi: 10.1093/nar/gkr988. [DOI] [PMC free article] [PubMed] [Google Scholar]
- 5.Chen X, Ji ZL, Chen YZ. TTD: therapeutic target database. Nucleic Acids Res. 2002;30:412–415. doi: 10.1093/nar/30.1.412. [DOI] [PMC free article] [PubMed] [Google Scholar]
- 6.Cao DS, et al. Large-scale prediction of drug-target interactions using protein sequences and drug topological structures. Anal. Chim. Acta. 2012;752:1–10. doi: 10.1016/j.aca.2012.09.021. [DOI] [PubMed] [Google Scholar]
- 7.Gonen M. Predicting drug-target interactions from chemical and genomic kernels using Bayesian matrix factorization. Bioinformatics. 2012;28:2304–2310. doi: 10.1093/bioinformatics/bts360. [DOI] [PubMed] [Google Scholar]
- 8.Keiser MJ, et al. Relating protein pharmacology by ligand chemistry. Nat. Biotechnol. 2007;25:197–206. doi: 10.1038/nbt1284. [DOI] [PubMed] [Google Scholar]
- 9.Campillos M, Kuhn M, Gavin A-C, Jensen LJ, Bork P. Drug target identification using side-effect similarity. Science. 2008;321:263–266. doi: 10.1126/science.1158140. [DOI] [PubMed] [Google Scholar]
- 10.Li H, et al. TarFisDock: a web server for identifying drug targets with docking approach. Nucleic Acids Research. 2006;34(34):W219–W224. doi: 10.1093/nar/gkl114. [DOI] [PMC free article] [PubMed] [Google Scholar]
- 11.Xie L, Evangelidis T, Xie L, Bourne PE. Drug Discovery Using Chemical Systems Biology: Weak Inhibition of Multiple Kinases May Contribute to the Anti-Cancer Effect of Nelfinavir. PLoS computational biology. 2011;7:e1002037. doi: 10.1371/journal.pcbi.1002037. [DOI] [PMC free article] [PubMed] [Google Scholar]
- 12.Yang L, et al. Exploring Off-Targets and Off-Systems for Adverse Drug Reactions via Chemical-Protein Interactome — Clozapine-Induced Agranulocytosis as a Case Study. PLoS computational biology. 2011;7:e1002016. doi: 10.1371/journal.pcbi.1002016. [DOI] [PMC free article] [PubMed] [Google Scholar]
- 13.van Laarhoven T, Nabuurs SB, Marchiori E. Gaussian interaction profile kernels for predicting drug-target interaction. Bioinformatics. 2011;27:3036–3043. doi: 10.1093/bioinformatics/btr500. [DOI] [PubMed] [Google Scholar]
- 14.Prado-Prado F, et al. 2D MI-DRAGON: a new predictor for protein-ligands interactions and theoretic-experimental studies of US FDA drug-target network, oxoisoaporphine inhibitors for MAO-A and human parasite proteins. Eur. J. Med. Chem. 2011;46:5838–5851. doi: 10.1016/j.ejmech.2011.09.045. [DOI] [PubMed] [Google Scholar]
- 15.Mei JP, Kwoh CK, Yang P, Li XL, Zheng J. Drug-target interaction prediction by learning from local information and neighbors. Bioinformatics. 2013;29:238–245. doi: 10.1093/bioinformatics/bts670. [DOI] [PubMed] [Google Scholar]
- 16.Chen L, Lu J, Luo X, Feng KY. Prediction of drug target groups based on chemical-chemical similarities and chemical-chemical/protein connections. Biochim. Biophys. Acta. 2014;1844:207–213. doi: 10.1016/j.bbapap.2013.05.021. [DOI] [PubMed] [Google Scholar]
- 17.Chen X, Liu MX, Yan GY. Drug-target interaction prediction by random walk on the heterogeneous network. Mol Biosyst. 2012;8:1970–1978. doi: 10.1039/c2mb00002d. [DOI] [PubMed] [Google Scholar]
- 18.Chen X, et al. Drug-target interaction prediction: databases, web servers and computational models. Briefings in bioinformatics. 2016;17:696–712. doi: 10.1093/bib/bbv066. [DOI] [PubMed] [Google Scholar]
- 19.Gui J, Liu T, Tao D, Sun Z, Tan T. Representative Vector Machines: A Unified Framework for Classical Classifiers. IEEE Trans Cybern. 2016;46:1877–1888. doi: 10.1109/TCYB.2015.2457234. [DOI] [PubMed] [Google Scholar]
- 20.Shi JY, Yiu SM, Li Y, Leung HC, Chin FY. Predicting drug-target interaction for new drugs using enhanced similarity measures and super-target clustering. Methods. 2015;83:98–104. doi: 10.1016/j.ymeth.2015.04.036. [DOI] [PubMed] [Google Scholar]
- 21.Chen H, Zhang Z. A Semi-Supervised Method for Drug-Target Interaction Prediction with Consistency in Networks. PloS one. 2013;8:e62975. doi: 10.1371/journal.pone.0062975. [DOI] [PMC free article] [PubMed] [Google Scholar]
- 22.Yamanishi Y, Kotera M, Kanehisa M, Goto S. Drug-target interaction prediction from chemical, genomic and pharmacological data in an integrated framework. Bioinformatics. 2010;26:246–254. doi: 10.1093/bioinformatics/btq176. [DOI] [PMC free article] [PubMed] [Google Scholar]
- 23.Kanehisa M, et al. From genomics to chemical genomics: new developments in KEGG. Nucleic Acids Res. 2006;34:354–357. doi: 10.1093/nar/gkj102. [DOI] [PMC free article] [PubMed] [Google Scholar]
- 24.Wishart DS, et al. DrugBank: a knowledgebase for drugs, drug actions and drug targets. Nucleic Acids Res. 2008;36:901–906. doi: 10.1093/nar/gkm958. [DOI] [PMC free article] [PubMed] [Google Scholar]
- 25.Schomburg I, et al. the enzyme database: updates and major new developments. Nucleic Acids Res. 2004;32:431–433. doi: 10.1093/nar/gkh081. [DOI] [PMC free article] [PubMed] [Google Scholar]
- 26.Shen J, Cheng F, Xu Y, Li W, Tang Y. Estimation of ADME properties with substructure pattern recognition. Journal of chemical information and modeling. 2010;50:1034–1041. doi: 10.1021/ci100104j. [DOI] [PubMed] [Google Scholar]
- 27.Cao DS, et al. In silico classification of human maximum recommended daily dose based on modified random forest and substructure fingerprint. Analytica chimica acta. 2011;692:50–56. doi: 10.1016/j.aca.2011.02.010. [DOI] [PubMed] [Google Scholar]
- 28.Raicar G, Saini H, Dehzangi A, Lal S, Sharma A. Improving protein fold recognition and structural class prediction accuracies using physicochemical properties of amino acids. J. Theor. Biol. 2016;402:117–128. doi: 10.1016/j.jtbi.2016.05.002. [DOI] [PubMed] [Google Scholar]
- 29.Wang S, Liu S. Protein Sub-Nuclear Localization Based on Effective Fusion Representations and Dimension Reduction Algorithm LDA. Int. J. Mol. Sci. 2015;16:30343–30361. doi: 10.3390/ijms161226237. [DOI] [PMC free article] [PubMed] [Google Scholar]
- 30.Ojala T, Pietikäinen M. Multiresolution gray-scale and rotation invariant texture classification with local binary patterns. IEEE T. Pattern Anal. 2002;24:971–987. doi: 10.1109/TPAMI.2002.1017623. [DOI] [Google Scholar]
- 31.Olive DJ. A resistant estimator of multivariate location and dispersion. Comput. Stat. Data An. 2004;46:93–102. doi: 10.1016/S0167-9473(03)00119-1. [DOI] [Google Scholar]
- 32.He R, Zheng W-S, Hu B-G. Maximum correntropy criterion for robust face recognition. IEEE Transactions on Pattern Analysis and Machine Intelligence. 2011;33:1561–1576. doi: 10.1109/TPAMI.2010.220. [DOI] [PubMed] [Google Scholar]