

Abstract
Policy Points:
On‐shelf nutrition labelling systems in supermarkets, such as the Guiding Stars system, are intended to provide consumers with simple, standardized nutrition information to support more informed and healthier food choices. Policies that support the provision of simplified nutrition labelling systems may encourage consumers to make positive shifts in food‐purchasing behaviors.
The shifts in consumer food‐purchasing patterns observed in our study after the introduction of the Guiding Stars system in supermarkets translated into measurable nutritional benefits, including more items purchased with slightly less trans fat and sugar and more fiber and omega‐3 fatty acids.
This study is one of the first to report the positive impact of an on‐shelf nutrition labelling system on supermarket sales and revenues—key information that was specifically requested by the US National Academies, as such labelling interventions may be more sustainable if they lead to higher revenues.
Context
Providing a nutrition rating system on the front of food packages or on retail shelf tags has been proposed as a policy strategy for supporting healthier food choices. Guiding Stars is an on‐shelf nutrition labelling system that scores foods in a supermarket based on nutritional quality; scores are then translated into ratings of 0 to 3 stars. It is consistent with evidence‐informed recommendations for well‐designed labels, except for not labelling 0‐star products. The largest supermarket retailer in Canada rolled out the Guiding Stars system in supermarkets across Ontario, Canada. The aim of our study was to examine the extent to which consumers respond to an on‐shelf nutrition labelling system in supermarkets to inform current and future nutrition labelling policies and practices.
Methods
Capitalizing on a natural experiment, we conducted a quasi‐experimental study across 3 supermarket banners (or “chains”) in Ontario, one of which implemented the Guiding Stars system in 2012. We used aggregated supermarket transaction data to test the effect of Guiding Stars on the nutritional quality of food purchases in intervention supermarkets relative to control supermarkets. We also conducted exit surveys among 783 randomly selected shoppers from intervention and control supermarkets to assess consumer awareness, understanding, trust, and self‐reported use of the labelling system.
Findings
Relative to control supermarkets, shoppers in intervention supermarkets made small but significant shifts toward purchasing foods with higher nutritional ratings; however, shifts varied in direction and magnitude across food categories. These shifts translated into foods being purchased with slightly less trans fat and sugar and more fiber and omega‐3 fatty acids. We also found increases in the number of products per transaction, price per product purchased, and total revenues. Results of the exit surveys indicate a modest proportion of consumers were aware of, understood, and trusted Guiding Stars in intervention supermarkets, and a small proportion of consumers reported using this system when making purchasing decisions. However, 47% of shoppers exposed to Guiding Stars were confused when asked to interpret the meaning of a 0‐star product that does not display a rating on the shelf tag.
Conclusions
This study demonstrates support for policies promoting on‐shelf nutrition labels designed according to evidence‐informed principles, but policymakers should move forward with caution when investing in such systems until research has confirmed optimal label design, clarified the mechanisms through which dietary intake is improved, and assessed associations with nutrition‐related health outcomes.
Keywords: nutrition policy, food environment, food labelling, population health intervention research
Poor diet is now a leading risk factor for chronic disease and premature death in Canada, the United States, Australia, and Europe.1, 2, 3, 4 Promoting healthy food choices is a critical component of a public health strategy to reduce the risk of nutrition‐related chronic diseases.5 Although individual‐level strategies for changing food choices can be effective for some, the increasing prevalence of nutrition‐related chronic diseases suggests there is an urgent need to promote environments that support healthier food choices at a population level.5, 6
Nutrition labels are one tool to support consumers in making more informed and healthier food choices. The World Health Organization considers nutrition labelling an essential part of its global strategy on diet, physical activity, and health.5 Front‐of‐package (FOP) nutrition labels are a relatively new point‐of‐sale strategy intended to provide a simple, standardized nutritional summary of the product that is located in a consistent and prominent position on the front of food packages. In many countries, including Canada, the United States, and most of Europe, FOP nutrition labels are not specifically regulated and environmental scans have identified hundreds of proprietary systems in the marketplace developed by food manufacturers, retailers, and nonprofit organizations.7, 8, 9 The existence of multiple FOP systems in the marketplace creates confusion and limits their effectiveness to help consumers evaluate and compare the nutritional profiles of foods.10, 11, 12 Moreover, most labelling systems use varying industry established nutrition criteria to rate and qualify products that carry their FOP label rather than objective science‐based nutrition criteria consistent with government recommendations. As a result, FOP labels are often applied to foods of dubious nutritional quality.13
At least 12 countries, including the United Kingdom, Chile, Ecuador, and Australia, have now developed government‐sponsored FOP nutrition labelling systems that are consistent with some science‐based principles for well‐designed labels.14, 15, 16, 17, 18 The goal of these tools is to increase the proportion of consumers who notice, understand, and use nutrition information to make healthier food choices for themselves and their families.19 Evidence from cross‐sectional and experimental studies, as well as 2 reports from the US National Academies of Sciences, Engineering, and Medicine (the National Academies; formerly known as the US Institute of Medicine),9, 20, 21, 22, 23, 24, 25, 26, 27 indicate the efficacy of simplified point‐of‐sale labels using easy‐to‐understand graphics or symbols and demonstrate few differences in understanding among socioeconomic subgroups. The evidence reviewed by the National Academies also suggests that consumers prefer an ordinal rating system over a single icon, and over multiple nutrient rating systems, which are seen to provide too much information.9, 20 Finally, the National Academies recommends a “universal” or standardized nutrition labelling system that is displayed on all products in a supermarket, in a consistent location and format, that comes from a trusted source, and is supported by ongoing promotion. However, the National Academies' recommendations are untested and few studies provide evidence on the impact of FOP nutrition labels on actual food purchases in real‐world settings. Therefore, it remains unclear which format of FOP labels is most effective for grabbing consumer attention and for supporting rapid comprehension and application of nutrition information when making food‐purchasing decisions in a supermarket. It is critical to better understand how consumers respond to FOP nutrition labelling systems in actual food retail environments, as several governments have recently implemented or announced their intentions to implement changes to national nutrition labelling legislation.14, 15, 17, 28, 29, 30
Some of the National Academies’ principles for FOP labels have been applied in retail settings in the form of labelling systems that display nutrition ratings on product shelf tags, next to the price. Because shoppers typically use shelf tags to obtain pricing information, little additional effort is required to locate nutrition information. Although studies from the 1980s examining on‐shelf nutrition labels generally found limited impact of these systems on consumer understanding and use, characteristics of both the nutrition labelling programs and the evaluations for these labelling programs were weak in their design.31, 32 Most studies examined small‐scale interventions that were not implemented storewide, evaluated the effect on the sale of healthier products only (eg, vegetables), and assessed self‐reported measures of consumer use, rather than using objective measures (eg, supermarket transaction data) to measure changes in actual purchasing patterns. In addition to these constraints, results of 2 reviews examining on‐shelf nutrition labelling systems in retail settings indicate the lack of an accompanying education or promotion campaign as a possible explanation for their limited impact on consumers’ food‐purchasing behaviors.31, 32
Currently, one on‐shelf labelling system (NuVal) is being used storewide in a large number of supermarkets in regions of the United States, and one system (Guiding Stars) is being used in both Canada and the United States.33, 34 We found 4 US studies examining the effect of these 2 systems on food purchases.35, 36, 37, 38 An evaluation of the NuVal system, which rates the nutritional profile of a food on a scale of 1 to 100, examined supermarket transaction data from 535,000 shoppers at a major supermarket banner (or “chain”) in the United States. Results indicate the system had a small but significant shift toward products purchased with a higher NuVal nutritional rating.35 When examining the Guiding Stars system using store‐level transaction data from 168 stores in 5 US states, Sutherland et al36 found that 24.5% of products purchased before the Guiding Stars system was implemented earned a star rating and the proportion of starred purchases increased to 25.0% and 25.9% at 1‐ and 2‐year follow‐ups. Cawley et al37 examined changes in sales following Guiding Stars implementation in 150 stores of a single supermarket chain in the United States. They found that approximately 1‐year after implementation, sales of foods with 0 stars declined by 8.3%, while sales of foods with ratings of 1, 2, and 3 stars did not change. The share of starred items purchased increased by 1.4% but overall sales declined. Neither study included control supermarkets without the labelling system, a large concern given the secular influences affecting food purchases. To overcome this issue, Rahkovsky et al38 compared sales of ready‐to‐eat cereals in supermarkets with and without the Guiding Stars labelling system 1 year before and 20 months after implementation using Nielson Scantrack data.Results indicated that the market share of ready‐to‐eat cereals with 1, 2, and 3 stars significantly increased by 1.2%, 0.9%, and 0.5%, respectively, while market share of 0‐star cereals decreased by 2.6% in stores with the Guiding Stars system relative to stores without the system. The authors found that purchasing of 0‐star cereals was higher among lower‐income consumers in stores with and without the Guiding Stars ratings.
To date, no studies in Canada and few studies internationally have examined the extent to which shoppers respond to FOP or on‐shelf nutrition labelling systems in actual supermarkets. This evidence is important for informing nutrition communication strategies as well as nutrition labelling policies and practices. With this in mind, the objectives of this study were to use a large natural experiment to extend the current evidence by investigating the impact of the Guiding Stars on‐shelf nutrition labelling system on consumer purchasing behaviors across all food categories in supermarkets in Canada relative to comparison supermarkets without the labelling system, to capture the measurable nutritional effect of the labelling system on food purchases, and to examine the mechanisms underlying the expected changes in shoppers’ food‐purchasing patterns. The specific aims were to analyze store‐level transaction data to assess the effect of the Guiding Stars system on food purchases overall and within 11 broad food product categories, on the nutritional quality of food purchases, and on supermarket revenues. Moreover, survey data from supermarket shoppers were collected to test differences in awareness, understanding, trust, and self‐reported use of the Guiding Stars system, as well as to assess support for on‐shelf nutrition labelling systems in supermarkets.
Methods
Guiding Stars On‐Shelf Nutrition Labelling System
Guiding Stars is a US‐based system that was adapted for Canada by an independent scientific panel with no associations to the grocery or food industry, and is administered by the Guiding Stars Licensing Company.39 The Guiding Stars system rates the vast majority of foods, both fresh and packaged, based on nutritional quality. However, alcohol, medical foods, natural health products, infant formula, and food items containing fewer than 5 calories per manufacturer‐specified serving size (eg, water and tea) are not rated under the Guiding Stars system. The underlying algorithm generates scores for fresh and packaged food and beverage products based on nutrient density per 100 kcal. Points are credited for vitamins, minerals, omega‐3 fatty acids, fiber, and whole grains, and points are debited for trans and saturated fats and added sodium and sugars; scores are then translated into ratings of 0 to 3 stars.40, 41 Products earning ratings of 1 to 3 stars have the corresponding star symbols displayed on the shelf tag beside the price (Figure 1). Zero‐star items that do not meet the nutritional requirements for a star rating do not receive a rating or symbol on the label. With the exception of not labelling products earning a 0‐star rating, the Guiding Stars system is consistent with the National Academies’ recommendations for a well‐designed FOP nutrition label,20 and it has the potential to help consumers make more informed and nutritious food choices.
Figure 1.
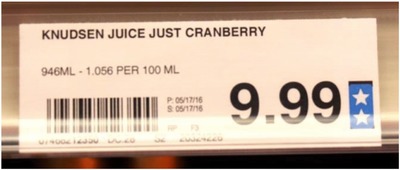
Guiding Stars On‐Shelf Nutrition Label [Color figure can be viewed at wileyonlinelibrary.com]
Implementation of the Guiding Stars System in Supermarkets in Canada
Loblaw Companies Limited (Loblaw) purchased the rights to the Guiding Stars system for Canada. Loblaw is the largest supermarket retailer in Canada, with a 29.9% market share, serving approximately 14 million shoppers per week in more than 1,000 supermarkets across Canada.42 Therefore, as a population health intervention, implementation of a labelling system throughout Loblaw supermarkets provides a direct and ongoing means to reach a large number of Canadians. In Ontario, Canada, Loblaw operates 345 supermarkets under 13 supermarket banners, including Loblaws, Zehrs, and Real Canadian Superstore (Superstore). Loblaw first implemented the Guiding Stars system in all Loblaws supermarkets in Ontario in August 2012, and all other Loblaw supermarket banners (eg, Zehrs, Superstore) in Ontario in March 2013, prior to implementing the system across all Loblaw supermarkets in Canada in September 2014. In‐store educational and promotional materials, including brochures and aisle signage, were displayed as the Guiding Stars system rolled out across supermarkets. Researchers did not have any involvement or control over the implementation of the Guiding Stars system in supermarkets.
Research Design and Data Sources
Since Loblaw first implemented the Guiding Stars system in the Loblaws supermarket banner in Ontario, it enabled a pretest‐posttest design with a control group. Transaction data were acquired from Loblaw for all Loblaws (intervention condition) and Zehrs and Superstore (control conditions) supermarkets in Ontario, Canada both before and after the Guiding Stars system was implemented in Loblaws supermarkets. We aggregated the transaction data at the level of each supermarket store location for each day, and refer to these data in this paper as the supermarket transaction data. In addition to the supermarket transaction data, we conducted exit surveys with shoppers in Loblaws (intervention condition) and Zehrs (control condition) supermarkets in Ontario (after the Guiding Stars system was implemented in Loblaws supermarkets, but before it was implemented in Zehrs) to assess consumer awareness, understanding, trust, and self‐reported use of Guiding Stars, as well as demographic and socioeconomic information.
According to Loblaw, Zehrs and Superstore supermarkets in Ontario are appropriate comparisons for Loblaws supermarkets as they are the most comparable Loblaw supermarket banners in terms of customer demographics, product profiles, and store layout. The geographic areas served by these Loblaw supermarkets across Ontario range from urban to rural areas with a median income of $59,017 (SD = $24,033), an employment rate of 59.3% (SD = 16.0), and 13.1% without a secondary school diploma.43
Supermarket Transaction Data
Supermarket transaction data were provided by Loblaw to the research team for all 44 Loblaws, 44 Zehrs, and 38 Superstore supermarket store locations in Ontario. For each location, all transactions were observed for the period of June 1, 2012, to July 30, 2013. The data set includes more than 145 million transactions—all transactions before and after the Guiding Stars system was implemented in Loblaws supermarkets on August 10, 2012. The transaction data consist of each single food and beverage item sold in the supermarkets, and they provide key purchase variables describing the time and date of purchase, supermarket name and location, and the Universal Product Code (UPC), weight, price, and quantity of each item purchased.
Nutrition and Guiding Star Ratings Database
The transaction data were further supplemented by a food and nutrient database provided by Guiding Stars Licensing Co. that reports UPC‐level nutrition information and star ratings for more than 55,000 fresh and packaged products offered for sale in Loblaw supermarket banners, including Loblaws, Zehrs, and Superstore stores. Standardized nutrition information on each product was updated weekly and includes energy (kcal), total fat, trans and saturated fats, fiber, omega‐3 fatty acids, sugar, and sodium by product serving size.
Exit Surveys
We conducted exit surveys with shoppers from Loblaws (intervention condition) and Zehrs (control condition) supermarkets in Ontario over a 3‐week time period in February 2013. These data allow for examinations of consumer awareness, understanding, trust, and self‐reported use of the labelling system 6 months after the introduction of the Guiding Stars system in intervention supermarkets in Ontario, as they are factors associated with using a label in purchasing situations, as well as enable a between‐group comparison with shoppers in control supermarkets without the label.
Measures and Analysis
Supermarket Transaction Data
Outcome Measures
The first set of outcome measures includes the changes in the stars per product (ie, UPCs) purchased and per serving purchased. Differences between each star level represent incremental changes in the overall nutritional density of foods and beverages. The second set of outcome measures includes changes in the calorie and nutrient content (eg, sugar and sodium) in one serving of the product that was purchased. Lastly, the quantity of products purchased per transaction, the price per product purchased, and the total revenue by store were examined. These outcomes were examined across all food purchases, as well as separately by 11 food product categories.
Analyses
For the two sets of outcome measures, a standard difference‐in‐differences approach was used to take advantage of the panel structure of the data. The unit of observation is a “store‐day.” Additionally, for each outcome variable, the mean quantity of products purchased per transaction was calculated, as well as the share of products purchased with each star rating, the number of stars per product purchased, the price per item purchased, and the calorie and nutrient content in one serving of each item that was purchased. The effects of the Guiding Stars system were tested, while controlling for seasonality and other influences, using the following regression equation:
Because each outcome variable, indicated by Y jt, was expected to change proportionately, natural log transformations for each of the outcome variables were used (adding 0.01 x mean of the outcome variable to prevent taking the log of zero). This permits interpreting the coefficients as the percentage change in the mean of the outcome variables due to the implementation of the Guiding Stars labelling system. The first difference, controlling for time invariant differences across stores, is accounted for by store fixed effects, μj. The second difference, controlling for common time trends, is accounted for by week and day of week fixed effects, δt. The variable “εjt” is an unobserved shock. The variable of interest is T jt, which is equal to “1” for the intervention supermarket banner implementing Guiding Stars, in the postimplementation period (eg, after August 10, 2012). Technically this is an interaction term, where the noninteracted supermarket banner values are subsumed in the store fixed effect and the noninteracted postimplementation is accounted for with the week fixed effects. Since time‐invariant factors are absorbed by the μj, and since all nonlocal time varying factors are fully explained by the δt, identification is possible based on the relative consumption change in intervention supermarkets with the Guiding Stars system relative to those control supermarkets without the system. This approach was used to assess transactions overall, as well as to examine transactions across 11 food categories adapted from those used in the What We Eat in America dietary intake component of the National Health and Nutrition Examination Survey and the Canadian Nutrient File.44, 45 Standard errors are clustered by store. The main analyses use transactions from June 1, 2012, to February 28, 2013, with Zehrs supermarkets in Ontario as the control group. As a robustness check, Superstore supermarkets in Ontario were examined as an alternative control group.
Exit Surveys
We conducted surveys with supermarket shoppers outside of 4 intervention supermarket stores in the Greater Toronto Area in Ontario that implemented the Guiding Stars system, and 4 control supermarket stores in the Region of Waterloo in Ontario that had not implemented the system. Participating supermarkets were selected by matching on area‐level affluence and population density to reduce the likelihood of differences across conditions. Eligible survey respondents included adults over the age of 18 years who reported purchasing food and/or beverage products at the supermarket. A total of 789 supermarket shoppers were recruited, approximately 100 in each of 4 intervention and 4 control supermarket stores. Six individuals were excluded from the final sample due to not meeting study inclusion criteria, for a final sample size of 783 (n = 401 at the intervention supermarkets and n = 382 at the control supermarkets). According to the American Association for Public Opinion Research Response Rate 4 criteria,46 the response rate was 19.8% at the intervention supermarkets and 20.4% at the control supermarkets; this was not significantly different between conditions.
Protocols
Supermarket shoppers were approached and invited to participate in the survey upon exiting the supermarket using a standard intercept technique. Eligibility for the 10‐minute survey was established through a brief screening tool. Exit surveys were conducted simultaneously at the study sites between 10 am and 7 pm by different interviewer teams to avoid time‐related effects. Participants received a $5 gift card as remuneration for their time.Visual scans were conducted each day prior to data collection to confirm the presence of star ratings on shelf tags in intervention stores and the absence of these tags in control stores. These procedures were approved by the Research Ethics Board at the University of Toronto. Verbal informed consent was obtained from all participants before completing the survey.
Survey measures
The exit survey included national and previously published survey items assessing sociodemographic factors, including age, gender, education level, ethnicity, and perceived weight status, as well as shopping and label use habits, and perceived and objective nutrition knowledge.47, 48, 49, 50 Adapted from measures applied in previous evaluations of nutrition interventions in supermarkets,32, 51 the primary outcome measures were unprompted consumer awareness (“Did you notice a symbol on the shelf tag located underneath the product beside the price?” and, if yes, “Can you describe what you saw?” A correct response included a reference to “stars.”); understanding (“Can you please tell me what the symbol means?” A correct response included a reference to “health” or “nutrition” or “diet.”); and self‐reported use (“Did you use the symbol to help you decide on food purchases today?”). Trust of the Guiding Stars system was also measured by showing participants an image and asking, “On a scale of 1 to 5, where 1 is not trustworthy and 5 is extremely trustworthy, please tell me the extent to which you trust the Guiding Stars symbols on shelf tags for providing food and nutrition information.” Toward the end of the survey, “understanding of zero stars” (eg, no rating on the shelf tag) and “support for on‐shelf nutrition labels” were assessed. To measure consumers’ understanding of zero stars, participants in intervention supermarkets only were shown an image of 3 breakfast cereals on a supermarket shelf and asked the open‐ended question: “If you had 3 similar types of food to choose from of similar price, 2 carrying stars on the shelf tag and 1 without stars on the shelf tag, what does the shelf tag without the stars mean to you?” Correct responses included any one of the following: (1) the product does not meet the nutritional requirements for stars, (2) the product has not yet been rated, (3) the product contains fewer than 5 calories per serving, or (4) the product does not qualify to be rated under the Guiding Stars system (eg, alcohol and medical foods). Support for on‐shelf nutrition labels was assessed among all participants in both intervention and control supermarkets by asking participants, “On a scale of 1 to 5, where 1 is strongly disagree and 5 is strongly agree, is it a good idea to display symbols on shelf tags in supermarkets to inform consumers of the healthfulness of products?”
Analysis
Descriptive statistics were generated for consumer characteristics and outcome variables; chi‐square tests and t‐tests were used to compare consumer characteristics and outcomes between intervention and control supermarkets. Awareness, understanding, and self‐reported use of the Guiding Stars system were treated as separate binary outcome variables. Those who were not aware of Guiding Stars were assigned a 0 for understanding and use variables, and those who were aware of but did not understand Guiding Stars were assigned a 0 for the use variable. Trust was measured using a 5‐point scale (1 = not trustworthy to 5 = extremely trustworthy) among shoppers in intervention supermarkets exposed to the Guiding Stars system only.
The relative difference in the proportions of consumer awareness, understanding, and self‐reported use were compared between stores in the intervention and control conditions. Logistic regression models were estimated to examine correlates of consumer awareness, understanding, and use. A linear regression model was fitted to examine correlates of trust, in which a higher score indicates a higher level of trust (range, 1–5). Each regression model included the following covariates: age, gender, education level, ethnicity, perceived weight status, household size, main supermarket, shopping purpose, primary meal planner, primary shopper, use of the nutrition facts label, shopping for someone with health conditions, time spent in store, and perceived and objective nutrition knowledge. Similar to the conceptual model adapted from Grunert and Wills19 depicting the underlying mechanisms of nutrition labelling systems, “understanding” the Guiding Stars system was also included as a covariate in the regression model estimating trust. Moreover, “trust” was included as a covariate in the regression model estimating self‐reported use of the Guiding Stars system. Because stores were matched by area‐level affluence, income was not included as an individual‐level covariate. All analyses were conducted using SAS version 9.3.
Results
Changes in Food Purchases by Star Rating and in Supermarket Revenues
Table 1 presents summary statistics for the supermarket transaction data between June 1, 2012, and July 30, 2013. These data indicate that 49% of food purchased across the supermarkets have a 0‐star rating, 10% a 1‐star rating, 9% a 2‐star rating, and 31% a 3‐star rating. Figures 2 and 3 depict the mean star rating per product purchased and the mean revenue by supermarket banner, respectively, distinguishing transactions in intervention supermarkets from transactions in control supermarkets. The first bold vertical line at August 2012 corresponds to the introduction of the Guiding Stars system in intervention supermarkets, and the second bold vertical line at March 2013 corresponds to the introduction of Guiding Stars in control supermarkets. The figures show small but significant increases (relative to the extensive seasonal variation) in both the mean star rating per product purchased (see Figure 2) and the mean revenue (see Figure 3) in intervention supermarkets after the implementation of the Guiding Stars system in August 2012 relative to the other 2 control supermarket banners without the Guiding Stars system. These increases disappear after the other 2 supermarket banners also implemented the program in March 2013. Due to the limited data available prior to the implementation of the Guiding Stars system in intervention supermarkets, our ability to assess prior trends in purchasing patterns is limited. Nevertheless, in Figures 2 and 3, the trends in purchasing patterns after the Guiding Stars system is implemented in both control supermarket banners are also similar.
Table 1.
Summary Statistics for Supermarket Transaction Data
| Mean | Standard Deviation | Minimum | Maximum | |
|---|---|---|---|---|
| Number of transactions | 2,762.88 | 916.56 | 1.00 | 7,573.00 |
| Total fat (g) | 4.53 | 0.32 | 0.00 | 21.80 |
| Saturated fat (g) | 1.55 | 0.13 | 0.00 | 13.00 |
| Trans fat (g) | 0.06 | 0.01 | 0.00 | 1.00 |
| Sodium (mg) | 151.00 | 12.88 | 1.00 | 591.67 |
| Sugars (g) | 7.56 | 0.56 | 0.00 | 53.00 |
| Calories | 121.46 | 4.56 | 9.77 | 365.00 |
| Fiber (g) | 1.33 | 0.09 | 0.00 | 3.81 |
| Protein (g) | 4.79 | 0.30 | 0.00 | 21.50 |
| Omega‐3 fatty acids (mg) | 46.27 | 8.17 | 0.00 | 1,270.00 |
| Mean star rating | 1.22 | 0.12 | 0.00 | 3.00 |
| Number of 0‐star ratings | 3.87 | 0.86 | 0.00 | 16.00 |
| Number of 1‐star ratings | 0.81 | 0.16 | 0.00 | 6.52 |
| Number of 2‐star ratings | 0.68 | 0.15 | 0.00 | 7.00 |
| Number of 3‐star ratings | 2.44 | 0.54 | 0.00 | 16.00 |
| Share of 0‐star ratings | 0.49 | 0.04 | 0.00 | 1.00 |
| Share of 1‐star ratings | 0.10 | 0.01 | 0.00 | 1.00 |
| Share of 2‐star ratings | 0.09 | 0.01 | 0.00 | 1.00 |
| Share of 3‐star ratings | 0.31 | 0.04 | 0.00 | 1.00 |
| Mean price per food product purchased | 4.27 | 0.34 | 0.99 | 21.99 |
| Number of items per transaction | 7.81 | 1.54 | 1.00 | 37.00 |
| Observations | 52,588 |
Summary statistics for “Total Items Purchased per Day,” “Revenues,” and “Revenues per Day” were omitted to protect confidentiality.
Figure 2.
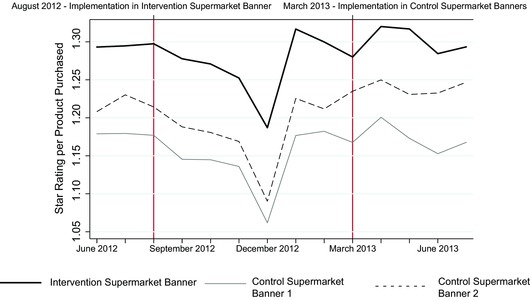
Mean Star Rating per Product Purchased by Supermarket Banner, June 1, 2012, to July 30, 2013
The first vertical line marks the introduction of Guiding Stars in the intervention supermarket banner in August 2012, and the second vertical line marks its introduction in the control supermarket banners in March 2013. The averages are taken after aggregating at the store‐day level. [Color figure can be viewed at wileyonlinelibrary.com]
Figure 3.
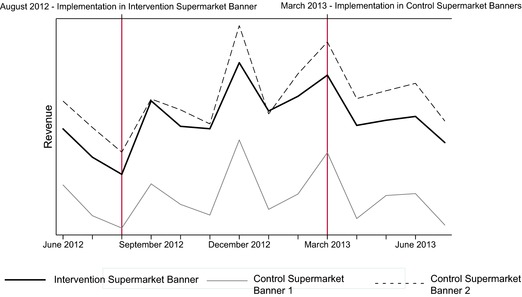
Mean Revenue by Supermarket Banner, June 1, 2012, to July 30, 2013
The first vertical line marks the introduction of Guiding Stars in the intervention supermarket banner in August 2012, and the second vertical line marks its introduction in the control supermarket banners in March 2013. The averages are taken after aggregating at the store‐day level. [Color figure can be viewed at wileyonlinelibrary.com]
Table 2 provides the results from the regression models used to estimate the effect of the Guiding Stars system in intervention relative to control supermarkets on the mean share of products purchased with each star rating, and star rating per product purchased. Each reported coefficient estimate in this table is obtained from a separate regression. The reported coefficient estimates correspond to the interaction term between the intervention supermarket banner and the intervention time period (after August 10, 2012). Results of the supermarket transaction data indicate that after the Guiding Stars system was implemented in intervention supermarkets, the share of 1‐ and 3‐star products purchased significantly increased by 2.0% and 1.9%, respectively. This shift corresponds with a significant decline of 0.7% and 1.9% in the share of 0‐ and 2‐star products. Overall, the mean star rating per product purchased significantly increased by 1.4% in intervention supermarkets relative to control supermarkets, translating to a change in mean star rating of 1.22 to 1.24 stars per product purchased. However, because the star ratings are an ordinal measure, caution should be taken when interpreting results beyond ordinality.
Table 2.
Estimated Effect of the Guiding Stars System on the Log (Share of Star Rating per Product Purchased [ie, UPC])
| 0‐Star Share | 1‐Star Share | 2‐Star Share | 3‐Star Share | Star Rating | |
|---|---|---|---|---|---|
| Supermarket transaction data | −0.007** | 0.020*** | −0.019** | 0.019*** | 0.014*** |
| (0.002) | (0.004) | (0.006) | (0.004) | (0.003) | |
| Observations (store‐day) | 23,429 | 23,429 | 23,429 | 23,429 |
Clustered standard errors in parentheses. *p < 0.05, **p < 0.01, ***p < 0.001.
Each reported coefficient estimate in this table is obtained from a separate regression. The reported coefficient estimates correspond to the interaction term between the intervention supermarket banner (Loblaws) and the intervention period (after August 10, 2012). Weekly, day of week, and store fixed effects are included in each regression. Results are weighted by Universal Product Code (UPC). The data compare intervention relative to control (Zehrs) supermarkets from June 1, 2012, to February 28, 2013, with the postimplementation period after August 10, 2012. The unit of observation is store‐day. Results rounded to the nearest thousandth.
Table 3 presents results of the effect of the Guiding Stars system on revenues in intervention as compared to control supermarkets. After Guiding Stars was implemented in intervention stores, the mean number of products per transaction increased by 1.6% and the mean price per product purchased also significantly increased by 1.3%, leading to a total revenue increase of 4.2% relative to the control stores.
Table 3.
Estimated Effect of the Guiding Stars System on the Log (Quantity of Products per Transaction), Log (Price per Transaction), and Log (Total Revenues)
| Number of Products per Transaction | Price per Transaction | Revenues | |
|---|---|---|---|
| Supermarket transaction data | 0.016** | 0.013*** | 0.042** |
| (0.005) | (0.002) | (0.013) | |
| Observations (store‐day) | 23,429 | 23,431 | 23,431 |
Clustered standard errors in parentheses. *p < 0.05, **p < 0.01, ***p < 0.001.
Each reported coefficient estimate in this table is obtained from a separate regression. The reported coefficient estimates correspond to the interaction term between the intervention supermarket banner (Loblaws) and the intervention period (after August 10, 2012). Weekly, day of week, and store fixed effects are included in each regression. Results are weighted by Universal Product Code (UPC). The data compare intervention relative to control (Zehrs) supermarkets from June 1, 2012, to February 28, 2013, with the postimplementation period after August 10, 2012. The unit of observation is store‐day. Results rounded to the nearest thousandth.
In a series of robustness checks, the analysis approach was repeated to examine the effect of the Guiding Stars system by weighting UPCs by the number of servings purchased (Online Appendix A), by including transactions in intervention and control supermarkets only for 2 months postintervention to ensure that asymmetric holiday effects did not drive the results (Online Appendix B), and using Superstore supermarkets in Ontario, instead of Zehrs, also without the Guiding Stars system as an alternative control condition (Online Appendix C). All of these analyses produced similar results as in the main specifications. Finally, to ascertain that the results are not due to the difference in levels of the main dependent variables and the assumption of proportional effects that comes with the use of a log model, the specifications using levels instead of logs were analyzed, producing similar results (Online Appendix D).
Changes in Nutritional Quality of Products Purchased
Table 4 summarizes the results of the regression models estimating the effect of the Guiding Stars system on the nutritional content of products purchased. Overall, products purchased by consumers who were exposed to the Guiding Stars system in intervention supermarkets contained, on average, 3.5% (−0.002 g) and 1.5% (−0.11 g) less trans fat and sugar, and 0.6% (0.01 g) and 4.5% (2.01 mg) more fiber and omega‐3 fatty acids, respectively, relative to those unexposed to the Guiding Stars system in control supermarkets. However, there was no significant impact on the number of calories or amount of sodium, fat, saturated fat, or protein per product purchased (see Table 4).
Table 4.
Estimated Effect of the Guiding Stars System on the Log (Nutritional Effects per Product [ie, UPC] Purchased)
| Calories | Dietary Fiber | Protein | Omega‐3 Fatty Acids | Total Fat | |
|---|---|---|---|---|---|
| Supermarket transaction data | −0.001 | 0.006** | 0.001 | 0.045*** | 0.004 |
| (0.001) | (0.002) | (0.002) | (0.007) | (0.002) | |
| Observations (store‐day) | 23,429 | 23,429 | 23,429 | 23,429 | 23,429 |
| Saturated Fat | Trans Fat | Sodium | Sugar | ||
|---|---|---|---|---|---|
| Supermarket transaction data | 0.000 | −0.035*** | 0.003 | −0.015*** | |
| (0.003) | (0.006) | (0.003) | (0.003) | ||
| Observations (store‐day) | 23,429 | 23,429 | 23,429 | 23,429 |
Clustered standard errors in parentheses. *p < 0.05, **p < 0.01, ***p < 0.001.
Each reported coefficient estimate in this table is obtained from a separate regression. Weekly, day of week, and store fixed effects are included in each regression. Results are weighted by Universal Product Code (UPC). The data compare intervention (Loblaws) relative to control (Zehrs) supermarkets from June 1, 2012, to February 28, 2013, with the postimplementation period after August 10, 2012. The unit of observation is store‐day. Results rounded to the nearest thousandth.
As a robustness check, similar analyses were conducted to test the impact of the Guiding Stars system on the nutritional content of a product purchased per serving (Online Appendix E).
Changes in Star Ratings by Food Product Categories
To better understand the impact of the Guiding Stars system, the above analyses of the supermarket transaction data were repeated across 11 food product categories: baby foods; baking and spices; beverages; grains and breakfast cereals; condiments and sauces; dairy and eggs; desserts and snacks; fruits and vegetables; health foods; meats, fish, and legumes; and mixed dishes, soups, and sides. Examining the intensive margin, the estimated treatment effect of the Guiding Stars system within each of the 11 food product categories are shown in Table 5. Generally, results indicate the effect of the Guiding Stars system on shoppers’ purchases varied in direction and magnitude across food product categories. Significant increases in the mean share of 3‐star products purchased were observed in the grains and breakfast cereals; dairy and eggs; fruits and vegetables; and, meats, fish, and legumes categories, while significant increases in the mean share of 1‐ and 2‐star products purchased were seen in the dairy and eggs; and mixed dishes, soups, and sides categories. Significant increases in the mean share of 0‐star products purchased were observed in the meats, fish, and legumes, and mixed dishes, soups, and sides categories. Significant decreases in the mean share of 0‐star products purchased were observed in the beverages; dairy and eggs; and fruits and vegetables categories, while significant decreases in 1‐ and 2‐star products purchased were found in fruits and vegetables; grains and breakfast cereals; and meat, fish, and legumes. Anomalous trends were observed in the baking and spices; condiments and sauces; and health foods categories, such that the share of 2‐ and 3‐star products significantly decreased in the baking and spices and condiments and sauces categories, and the share of 1‐ and 3‐star products purchased decreased and 0‐star products purchased increased in the health foods category.
Table 5.
Estimated Effect of the Guiding Stars System on the Log (Share of Star Rating per Product Purchased [ie, UPC]) by Food Product Category
| Food Category | 0‐Star Share | 1‐Star Share | 2‐Star Share | 3‐Star Share |
|---|---|---|---|---|
| Baby foods | −0.012 | 0.000 | −0.014 | 0.009 |
| (0.013) | (0.025) | (0.031) | (0.008) | |
| Baking and spices | 0.003 | −0.008 | −0.046** | −0.093*** |
| (0.002) | (0.020) | (0.014) | (0.019) | |
| Beverages | −0.026*** | −0.005 | 0.007 | ‐0.038 |
| (0.006) | (0.012) | (0.007) | (0.039) | |
| Grains and breakfast cereals | 0.003 | 0.009 | −0.043*** | 0.053*** |
| (0.004) | (0.005) | (0.006) | (0.011) | |
| Condiments and sauces | −0.001 | −0.005 | −0.055*** | 0.023 |
| (0.004) | (0.014) | (0.016) | (0.012) | |
| Dairy and eggs | −0.027*** | 0.035*** | 0.000 | 0.050*** |
| (0.002) | (0.005) | (0.008) | (0.005) | |
| Desserts and snacks | −0.001 | −0.009 | −0.023 | 0.012 |
| (0.001) | (0.009) | (0.016) | (0.021) | |
| Fruits and vegetables | −0.082*** | −0.054*** | 0.016 | 0.006*** |
| (0.011) | (0.018) | (0.013) | (0.002) | |
| Health foods | 0.014* | −0.024** | −0.032** | 0.003 |
| (0.007) | (0.009) | (0.011) | (0.012) | |
| Meats, fish, and legumes | 0.010*** | −0.008 | −0.221*** | 0.015* |
| (0.003) | (0.010) | (0.015) | (0.006) | |
| Mixed dishes, soups, and sides | 0.006** | 0.005 | 0.056** | −0.032 |
| (0.002) | (0.010) | (0.019) | (0.021) | |
| Observations | ||||
| (store‐day) | 23,429 | 23,429 | 23,429 | 23,429 |
Clustered standard errors in parentheses. *p < 0.05, **p < 0.01, ***p < 0.001.
Each reported coefficient estimate in this table is obtained from a separate regression. Weekly, day of week, and store fixed effects are included in each regression. Results are weighted by Universal Product Code (UPC). The data compare intervention (Loblaws) relative to control (Zehrs) supermarkets from June 1, 2012, to February 28, 2013, with the postimplementation period after August 10, 2012. The unit of observation is store‐day. Results rounded to the nearest thousandth.
Exit Surveys: Awareness, Understanding, Self‐Reported Use, and Trust of the Guiding Stars System
Sample characteristics
Sample characteristics are displayed in Table 6. Significant differences across stores were observed for some sociodemographic, shopping‐related, and nutrition‐related factors; these were accounted for in the regression analyses described below.
Table 6.
Sociodemographic Characteristics, Shopping Habits, and Food‐Related Knowledge and Behaviors of Exit Survey Participants by Supermarket Condition (n = 783)
| Intervention | Control | |||||
|---|---|---|---|---|---|---|
| (n = 401) | (n = 382) | |||||
| % | n | % | n | P Value | ||
| Sociodemographic Characteristics | ||||||
| Age | 18‐24y | 1.8 | 7 | 5.7 | 21 | 0.0007a |
| 25‐44y | 23.1 | 92 | 30.2 | 112 | ||
| 45‐64y | 55.9 | 223 | 44.2 | 164 | ||
| 65+y | 19.3 | 77 | 20.0 | 74 | ||
| Gender | Male | 24.2 | 97 | 33.0 | 125 | 0.0065a |
| Female | 75.8 | 304 | 67.0 | 254 | ||
| Education | Above high school diploma | 84.3 | 337 | 66.4 | 249 | <.0001a |
| High school or less | 15.8 | 63 | 33.6 | 126 | ||
| Ethnicity | Nonwhite | 16.7 | 66 | 10.6 | 40 | 0.0144a |
| White | 83.3 | 329 | 89.4 | 336 | ||
| Perceived weight status | Overweight | 47.6 | 191 | 52.0 | 194 | 0.4016a |
| Underweight | 2.0 | 8 | 2.4 | 9 | ||
| About right weight | 50.4 | 202 | 45.6 | 170 | ||
| Household size | Mean (SD) | 2.67 | (1.2) | 2.8 | (1.4) | 0.0708b |
| Shopping and Label‐Reading Habits | ||||||
| Main supermarket | Yes | 64.0 | 256 | 69.3 | 264 | 0.1171a |
| No | 36.0 | 144 | 30.7 | 117 | ||
| Shopping purpose | Small shop | 50.6 | 203 | 61.3 | 234 | 0.0007a |
| Convenience shop | 34.4 | 138 | 22.0 | 84 | ||
| Other shop | 1.0 | 4 | 0.3 | 1 | ||
| Large shop | 14.0 | 56 | 16.5 | 63 | ||
| Primary meal‐planner | Yes | 78.3 | 314 | 72.3 | 276 | <.0001a |
| Shared equally | 15.0 | 60 | 10.7 | 41 | ||
| No | 6.7 | 27 | 17.0 | 65 | ||
| Primary shopper | Yes | 81.1 | 325 | 75.7 | 289 | 0.0015a |
| Shared equally | 14.2 | 57 | 12.6 | 48 | ||
| No | 4.7 | 19 | 11.8 | 45 | ||
| Shopping for someone with health conditions | Yes | 34.9 | 140 | 39.0 | 149 | 0.2355a |
| No | 65.1 | 261 | 61.0 | 233 | ||
| Mean time spent in store | Mean (SD) | 27.5 | (17.3) | 33.4 | (21.8) | <.0001b |
| Use of nutrition facts table | Yes | 67.4 | 263 | 59.5 | 226 | 0.0218a |
| No | 32.6 | 127 | 40.5 | 154 | ||
| Nutrition Knowledge | ||||||
| Perceived nutrition knowledge | Knowledgeable | 64.8 | 260 | 57.7 | 217 | 0.0415a |
| Not knowledgeable | 35.2 | 141 | 42.3 | 159 | ||
| Objective nutrition knowledge | Correct | 39.2 | 157 | 30.9 | 118 | 0.0155a |
| Incorrect | 60.9 | 244 | 69.1 | 264 | ||
aChi‐square test was conducted to compare across supermarket conditions.
bOne‐way ANOVA was conducted to compare across supermarket conditions.
Awareness of the Guiding Stars System
Six months following implementation, significantly more consumers in intervention supermarkets with the Guiding Stars system reported noticing “stars on the shelf‐tag” than in control supermarkets without Guiding Stars (9.7% vs 0%, respectively; OR = 83.6; 95% CI: 9.1‐786.2; p < 0.0001; as shown in Online Appendix F). Shoppers aged 25–44 years were significantly more likely to be aware of Guiding Stars, as compared to those aged 45–64 years (OR = 2.8, 95% CI: 1.3‐6.0; p = 0.01) (Table 7). No other covariates were significantly associated with awareness of the Guiding Stars system.
Table 7.
Relationship Between Consumer Sociodemographic, Grocery Shopping, and Nutrition‐Related Characteristics and Awareness, Understanding, Self‐Reported Use, and Trust of Guiding Stars (n = 783)
| Model 1 | Model 2 | Model 3 | Model 4 | ||||||
|---|---|---|---|---|---|---|---|---|---|
| Awareness | Understanding | Self‐Reported Use | Trusta | ||||||
| OR (95% CI) | P Value | OR (95% CI) | P Value | OR (95% CI) | P Value | Mean Difference (95% CI) | P Value | ||
| Supermarket | Intervention | 83.6 (9.1, 768.2) | <.0001 | 71.1 (8.2, 619.2) | 0.0001 | 38.4 (3.1, 481.1) | 0.005 | ||
| Control | Referent | Referent | Referent | ||||||
| Age | 18‐24y | 1.5 (0.1, 28.9) | 0.79 | 2.1 (0.1, 38.5) | 0.61 | 11.0 (0.5, 227.4) | 0.12 | −1.1 (−2.1, −0.1) | 0.04 |
| 25‐44y | 2.8 (1.3, 6.0) | 0.01 | 2.9 (1.3, 6.3) | 0.01 | 6.4 (1.5, 27.4) | 0.01 | −0.4 (−0.7, −0.02) | 0.04 | |
| 45‐64y | Referent | Referent | Referent | Referent | |||||
| 65+y | 0.5 (0.1, 1.6) | 0.23 | 0.6 (0.2, 1.8) | 0.35 | 0.4 (0.03, 6.0) | 0.52 | 0.3 (−0.1, 0.7) | 0.17 | |
| Gender | Female | 0.6 (0.2, 1.5) | 0.28 | 0.5 (0.2, 1.2) | 0.12 | 0.4 (0.1, 1.3) | 0.12 | 0.1 (−0.3, 0.4) | 0.78 |
| Male | Referent | Referent | Referent | Referent | |||||
| Education | Above high school | 0.6 (0.2, 1.5) | 0.33 | 0.6 (0.2, 1.6) | 0.34 | 0.5 (0.1, 2.7) | 0.44 | −0.2 (−0.6, 0.1) | 0.20 |
| High school or less | Referent | Referent | Referent | Referent | |||||
| Ethnicity | Nonwhite | 1.2 (0.5, 2.9) | 0.66 | 1.4 (0.6, 3.3) | 0.49 | 0.5 (0.1, 2.9) | 0.48 | 0.4 (−0.03, 0.7) | 0.07 |
| White | Referent | Referent | Referent | Referent | |||||
| Perceived weight | Overweight | 0.9 (0.4, 1.7) | 0.65 | 0.8 (0.4, 1.6) | 0.63 | 0.8 (0.2, 3.4) | 0.81 | 0.1 (−0.2, 0.4) | 0.55 |
| status | Underweight | 2.4 (0.3, 20.7) | 0.42 | 2.6 (0.3, 21.8) | 0.34 | 14.8 (1.8, 122.7) | 0.01 | −0.7 (−1.6, 0.3) | 0.18 |
| About right weight | Referent | Referent | Referent | Referent | |||||
| Household size | 1.0 (0.8, 1.3) | 0.88 | 0.9 (0.7, 1.3) | 0.70 | 0.1 (−0.03, 0.2) | 0.15 | |||
| Main | Yes | 1.1 (0.5, 2.2) | 0.84 | 1.0 (0.5, 2.2) | 0.96 | 0.1 (−0.1, 0.4) | 0.33 | ||
| supermarket | No | Referent | Referent | Referent | |||||
| Shopping | Small shop | 0.6 (0.2, 1.5) | 0.26 | 0.6 (0.2, 1.5) | 0.30 | −0.02 (−0.4, 0.4) | 0.94 | ||
| purpose | Convenience shop | 0.6 (0.2, 1.7) | 0.35 | 0.5 (0.2, 1.5) | 0.24 | −0.1 (−0.5, 0.4) | 0.73 | ||
| Other shop | 0.3 (0.01, 12.9) | 0.52 | 0.4 (0.01, 14.3) | 0.59 | 0.7 (−0.8, 2.1) | 0.38 | |||
| Large shop | Referent | Referent | Referent | ||||||
| Primary meal | Yes | 1.5 (0.2, 10.7) | 0.66 | 1.6 (0.2, 10.5) | 0.64 | 0.4 (−0.3, 1.1) | 0.23 | ||
| planner | Shared equally | 3.0 (0.4, 21.3) | 0.28 | 2.5 (0.4, 17.3) | 0.35 | 0.4 (−0.3, 1.1) | 0.27 | ||
| No | Referent | Referent | Referent | ||||||
| Primary shopper | Yes | 5.0 (0.3, 71.2) | 0.24 | 4.4 (0.3, 54.6) | 0.29 | −0.1 (−0.9, 0.7) | 0.79 | ||
| Shared equally | 1.3 (0.1, 22.1) | 0.85 | 1.3 (0.1, 20.5) | 0.85 | 0.2 (−0.6, 1.0) | 0.67 | |||
| No | Referent | Referent | Referent | ||||||
| Use of nutrition facts table | Yes | 0.6 (0.3, 1.3) | 0.19 | 0.8 (0.4, 1.8) | 0.60 | −0.1 (−0.4, 0.2) | 0.67 | ||
| No | Referent | Referent | Referent | ||||||
| Shopping for someone with health conditions | Yes | 1.7 (0.8, 3.4) | 0.15 | 1.4 (0.7, 2.9) | 0.36 | 0.1 (−0.2, 0.4) | 0.61 | ||
| No | Referent | Referent | Referent | ||||||
| Time spent in store | 1.0 (1.0, 1.0) | 0.04 | 1.0 (1.0, 1.0) | 0.05 | −0.005 (−0.01, 0.004) | 0.28 | |||
| Perceived nutrition knowledge | Knowledgeable | 1.8 (0.8, 3.9) | 0.15 | 1.7 (0.7, 3.7) | 0.22 | −0.2 (−0.5, 0.1) | 0.18 | ||
| Not knowledgeable | Referent | Referent | Referent | ||||||
| Objective nutrition knowledge | Correct | 1.8 (0.9, 3.5) | 0.10 | 1.9 (0.9, 3.9) | 0.08 | −0.03 (−0.3, 0.3) | 0.85 | ||
| Incorrect | Referent | Referent | Referent | ||||||
| Trust Guiding Stars | 2.1 (1.2, 3.7) | 0.02 | |||||||
| Understand Guiding Stars | Yes | 0.9 (0.5, 1.4) | 0.0001 | ||||||
| No | Referent | ||||||||
Abbrevations: OR = odds ratio, CI = confident interval.
aModels for “Trust” restricted to participants within intervention supermarkets only (n = 401).
Understanding the Guiding Stars System
Overall, 8.7% of shoppers in intervention supermarkets understood that the stars on the product shelf tag reflect “health,” “nutrition,” or “diet” (X2 = 34.9, p < 0.0001), and 89.7% among those who were aware of the Guiding Stars understood it. Significantly more shoppers in intervention supermarkets were more likely to understand Guiding Stars compared to shoppers in the control condition (OR = 71.1, 95% CI: 8.2‐619.2; p < 0.0001). Age was positively associated with understanding, whereby shoppers aged 25‐44 years had higher odds of understanding the labelling system relative to those aged 45‐64 years (OR = 2.9, 95% CI: 1.3‐6.3; p = 0.01) (see Table 7).
Self‐Reported Use of the Guiding Stars System
In total, 2.0% of shoppers in intervention supermarkets with the Guiding Stars system reported using the nutrition labelling system when choosing foods (X2 = 7.7, p = 0.008); self‐reported use reached 22.9% among those who were aware of and understood Guiding Stars. Shoppers in intervention supermarkets were significantly more likely to report using Guiding Stars compared to shoppers in control supermarkets (OR = 38.4, p < 0.005). As shown in Table 7, compared to those aged 45‐64 years, the shoppers who were aged 25‐44 years (OR = 6.4, p = 0.01) were significantly more likely to report using Guiding Stars. Moreover, participants who perceived themselves as underweight were more likely to report using the Guiding Stars system compared to those who perceived themselves as about the right weight (OR = 14.8, p = 0.01), and participants with higher levels of trust for the Guiding Stars system were more likely to report using it to choose foods in the supermarket (OR = 2.1, p = 0.02) (see Table 7).
Trust of the Guiding Stars System
Measured on a 5‐point scale (1 = not trustworthy to 5 = extremely trustworthy), results of the distribution of responses for trust of the Guiding Stars labels among shoppers in intervention supermarkets exposed to the nutrition labelling system, and not in control supermarkets, showed the mean score was 2.8 (SD = 1.3). Trust was negatively associated with age, whereby shoppers aged 18‐24 years (β = −1.1, p = 0.04) and 25‐44 years (β = −0.4, p = 0.04) reported significantly lower levels of trust for Guiding Stars as compared to those aged 45‐64 years (see Table 7). However, shoppers who were aware of the labelling system had significantly higher levels of trust for the nutrition labelling system (β = 0.9, p = 0.0001).
Understanding of Zero Stars and Support of On‐Shelf Nutrition Labels in Supermarkets
Under the Guiding Stars system, products earn a 0‐star rating or do not have a rating on the shelf tag because the food (1) does not meet the nutritional requirements for stars, (2) has not yet been rated, (3) contains fewer than 5 calories per serving, or (4) does not qualify to be rated under the Guiding Stars system. After viewing an image of 3 breakfast cereals on a supermarket shelf, 2 carrying stars on the shelf tag and 1 without stars on the shelf tag, a total of 53% of participants were able to correctly report at least one reason a shelf tag would not carry a star symbol, and 47% reported “I don't know.”
On a scale from 1 (disagree) to 5 (strongly agree), the largest proportion of participants strongly agreed with having on‐shelf nutrition labels in supermarkets in both the intervention (70.6%) and control (44.5%) supermarkets (Online Appendix G), and the mean score was 4.5 (SD = 0.9) and 4.2 (SD = 0.9) in intervention and control supermarkets, respectively (t = 5.8, p < 0.0001).
Discussion
This article presents the first study in Canada and one of the few studies internationally to examine the impact of a large‐scale on‐shelf nutrition labelling system, Guiding Stars, on consumer food purchases in supermarkets. Guiding Stars is a proprietary nutrition labelling system that is consistent with evidence‐informed recommendations for well‐designed labels, except for not labelling 0‐star products. The goal of the Guiding Stars system is to provide a simple at‐a‐glance rating of the nutritional density of food products on retail shelf tags in the supermarket, thereby reducing the complexity and difficulty in understanding mandatory nutrition facts labels. Capitalizing on a natural experiment, we used supermarket transaction data to assess how consumer food‐purchasing patterns in supermarkets in Ontario, Canada, changed after the implementation of the Guiding Stars system, as well as exit surveys with supermarket shoppers to examine the underlying mechanisms associated with this change, including awareness, understanding, trust, and self‐reported use of the labelling system.
Results of this natural experiment study show that the introduction of an on‐shelf nutrition labelling system led to small but significant increases in the proportion of food purchased in the supermarket with higher star ratings over a 6‐month period. The magnitude of the labelling system's effects on food‐purchasing patterns are consistent with results of the previous evaluations of the Guiding Stars system in US supermarkets;36, 37, 38 however, the current study extends earlier investigations by demonstrating the impact of this labelling system over millions of transactions across all food product categories in supermarkets. Although the size of the effect attributed to the introduction of this system is modest, small positive changes in the nutritional quality of food purchases across millions of shoppers in a national supermarket retailer could have sizable population effects on diet‐related health conditions. Moreover, after the introduction of Guiding Stars there was a significant increase in the number of products purchased per transaction, price per product purchased, and revenues in intervention supermarkets relative to control supermarkets. It is possible these increases are due to 2 factors. First, the Guiding Stars labels signal consumers to place more weight on nutrition relative to other factors affecting their food‐purchase decisions, such as price. Second, healthier foods offered in supermarkets tend to have relatively higher price points per serving than less healthy foods,52, 53 and as consumers are encouraged to shift toward choosing healthier foods, the price per product purchased and supermarket revenues increase. This is one of the first studies to report the impact of an on‐shelf nutrition labelling system on supermarket sales, key information that was specifically requested by the US National Academies to determine the impact that FOP and on‐shelf nutrition information has on food‐purchasing patterns and sustainability of the intervention in supermarkets.20 The combination of promising effects and high external validity of this study suggests that implementing a simple, standardized point‐of‐sale nutrition labelling system, such as Guiding Stars, in supermarkets may be a valuable intervention for supporting consumers in making more informed and nutritious food choices, as well as a sustainable option for supermarket retailers. Future research is needed, however, to examine the impact of nutrition labelling systems while also considering the price of food to better understand the interplay of increased access to nutrition information and the affordability of food on consumer purchasing behaviors in supermarkets, especially among lower socioeconomic groups.
The direction and magnitude of the effect of the Guiding Stars system varied by food product category. Shifts toward purchasing products with 3‐star ratings were found in the grains and breakfast cereals; dairy and eggs; fruits and vegetables; and meats, fish, and legumes categories. Consistent with previous evidence, the positive shifts in these categories indicate that nutrition information is more likely to be sought and, applied to products that at the outset are regarded as more healthy.54 It is also plausible that the positive shifts toward 3‐star products may be caused by the within‐category variability of products with star ratings. For example, in product categories with low within‐category variability of star ratings, such as desserts and snacks (mainly 0‐star products), there was little to no change in the proportion of products purchased with or without star ratings. It is plausible that food product categories with greater within‐category heterogeneity in star ratings allow consumers to have a wider range of alternative products to switch to within the category and thus greater opportunity to find a higher‐rated product that satisfies their preferences. However, causes for the negative shifts in products purchased with star ratings in the baking and spices; condiments and sauces; and health foods categories are less clear. For the baking and spices, and condiments and sauces categories, earlier evidence suggests consumers seldom search for nutrition evidence on pleasure foods, as they are more concerned about taste than the healthfulness of these products and believe that healthier foods do not taste as good.55, 56 Therefore, it is possible that consumers associated higher star ratings with poor taste and avoided purchasing these products. Foods in the health food category (eg, protein bars and organic cereals) are generally located in one designated area in the supermarkets participating in this study and it is possible consumers may disregard the star ratings for these products as earlier evidence suggests “health food products” are often perceived as more nutritious despite the fact that these foods commonly contain the same or higher amounts of calories and negative nutrients as their counterparts.57
Although individual dietary intake was not measured in the current study, the shifts in food‐purchasing patterns after the introduction of the Guiding Stars system in intervention supermarkets translated into measurable shifts in the amount of nutrients purchased, including items purchased with less trans fat and sugar, and more fiber and omega‐3 fatty acids. Therefore, choosing products with higher star ratings may offer a means to reduce intake of negative nutrients and increase positive nutrients. However, the nutritional benefits were minimal and it is notable that there was no significant change in the amount of calories purchased. One potential explanation for the minimal nutritional benefits and lack of effect on the amount of calories purchased is that the Guiding Stars system has stronger effects on within‐category substitutions versus across‐category substitutions. For instance, shoppers using the Guiding Stars system to purchase pasta sauce may have shifted their food purchases from a premade pasta sauce with a 0‐star rating to a sauce with less added sugar and a 1‐star rating, rather than shifting from a premade pasta sauce to fresh tomatoes, which receive a 3‐star rating. This explanation is consistent with previous evidence suggesting that consumers use FOP and on‐shelf nutrition labels to make comparisons between different versions of the same type of product, but not across product categories.24, 54, 58 Therefore, despite applying universal FOP or on‐shelf labels on all products throughout a supermarket with the intent of pushing consumers toward foods of the highest nutritional quality (eg, fruits and vegetables), consumers may tend to use the labelling systems to seek out the “healthiest” product within the category and not switch to products in other categories. More research is needed to determine the effect of Guiding Stars on consumers’ food‐purchasing behaviors over time, including the substitution of products within and across product categories in the supermarket. It is conceivable that in addition to a simple point‐of‐sale nutrition labelling system, complementary interventions may be required, such as choice architecture interventions that position allied food products in proximity to each other in order to facilitate across category comparisons and substitutions toward the healthiest foods.
It should be acknowledged that the algorithm used by Guiding Stars to determine the star rating of a given food is proprietary, was not validated in this study, and requires further validation. There is currently no scientific agreement on how to determine the best nutritional profile of a given food, and Guiding Stars is one of many nutrition labelling systems applying varying algorithms that claims to be based on the prevailing scientific knowledge about diet and health.59, 60 Therefore, future work is needed to better understand if increased consumption of foods rated as “more nutritious” according to the Guiding Stars ratings are associated with better diet quality and health outcomes.
Lastly, results of the exit survey data indicate that 6 months after implementation, a modest proportion of consumers were aware of, understood, and trusted the Guiding Stars system in intervention supermarkets with the labelling intervention, and a small but significant proportion of consumers reported using this system when making decisions about food purchases. However, consumers strongly supported the use of nutrition labelling systems in supermarkets. The modest levels of consumer awareness, understanding, and trust of the Guiding Stars system may be one explanation for the small impact on consumers’ food‐purchasing behaviors observed in the transaction data. Although in‐store educational and promotional materials, including brochures and aisle signage, were displayed when the Guiding Stars system was implemented in supermarkets in Ontario, the supermarket is a distracting, noisy purchase environment, flooded with choices and various marketing and promotional messaging. To reduce “information clutter” and enhance the Guiding Stars system's effectiveness in helping consumers navigate consumer food choices and purchases when shopping, a more intensive and ongoing education and promotion campaign may be required to enhance consumer awareness, understanding, and trust of the labels, which could then lead to higher levels of use. Indeed, the US National Academies acknowledged the importance of implementing a sustained education and promotion campaign alongside a FOP labelling system.20 An enhanced promotional campaign with advertisements on television, on radio, and in newspapers was conducted in Loblaw supermarkets in Canada starting in January 2015. Further research is required to evaluate the additional contribution of the enhanced promotional campaign and strengthened implementation efforts on the impact of the Guiding Stars system for improving the nutritional quality of consumer food purchases.
It is also plausible that relatively few consumers were aware of the Guiding Stars system because the star symbols are only displayed on the shelf tags of products that earn 1, 2, or 3 stars, and not on products that earn a 0‐star rating. Approximately 52% of products in Loblaw supermarkets earn a 0‐star rating overall, and these 0‐star products represent over 80% of some product categories, such as desserts and condiments, yet no rating or symbol is displayed on shelf tags to communicate to consumers that these 0‐star products have been categorized as relatively less nutritious. The fact that 0‐star products do not display a star symbol on the shelf tag—and that they represent such a large proportion of products—is problematic, as 47% of shoppers exposed to Guiding Stars in the current study were confused when asked to interpret the meaning of a shelf tag without a star symbol. Previous evidence suggests that consumers tend to not notice or overlook nonoccurrences of a nutrition rating symbol even though the absence of a label may have implications for health; hence, according to the US National Academies, a key recommendation for effective FOP systems is to apply labels to all foods in a supermarket.61 Evidence from the current study indicating consumer confusion about nonlabelled foods is critical data for informing international best practices for FOP nutrition labelling systems, as some recently developed government‐sponsored FOP systems do not label all foods, but only label foods designated as either the least or most nutritious foods.14 For example, the FOP systems recently mandated in Chile and currently being considered in Canada do not label all foods but display warning labels only on foods that exceed a threshold for nutrients of greatest public health concern (eg, sodium and saturated fat).15, 28 More studies evaluating the impact of FOP and on‐shelf nutrition labelling systems in real‐world settings are needed to determine, when shopping in supermarkets, if consumers are more likely to notice and use nutrition labelling systems that visibly label all products throughout the supermarket, as compared to systems that label only the least or most nutritious products.
This study has several limitations. Although food purchases are predictive of consumption, the effects of the nutrition labelling system on actual changes in dietary consumption and health status were not assessed in the current study. Future research should consider examining the effect of nutrition labelling systems on nutrition‐related health outcomes, such as weight status, hypertension, cardiovascular disease, and premature death. However, longer‐term longitudinal research will likely be required to test these outcomes as reduced morbidity and mortality may take a decade or more to achieve.
Also, the results may not be generalizable to all shoppers in other supermarket banners in Canada as the current study was limited to shoppers in Loblaws, Zehrs, and Superstore supermarket banners, which are regarded as “marketplace stores,” and did not include shoppers in discount supermarket banners. As a result, the study sample is likely to be relatively well educated and have a higher socioeconomic profile, and thus, according to previous research, have a greater interest in food and nutrition and be more likely to use nutrition information in food‐purchasing decisions as compared to their less educated and lower‐income counterparts.56
Conclusion
An unhealthy diet is one of the most serious and prevalent risk factors for chronic disease in the developed world and many consumers have expressed a desire for tools to help them make more informed and healthier food purchases. This research examines a natural experiment using supermarket transaction data and exit surveys with supermarket shoppers to confirm that facilitating the understanding of nutritional information through the provision of simple, standardized nutrition labels at the point of sale, such as the Guiding Stars system, encourages consumers to make shifts toward purchasing food products with higher nutritional ratings. The shifts in consumer food purchases tend to vary across product food categories, with significant shifts toward 3‐star purchases observed in the grains and breakfast cereals, dairy and eggs, fruits and vegetables, and meat, fish, and legumes categories, but not in other food product categories. Further increases in consumer awareness, understanding, and trust of the Guiding Stars system through education and promotion campaigns may lead to additional increases in the proportion of products purchased with a higher star rating. More research is needed to determine if displaying nutrition ratings on all product labels within a supermarket, including the products with the least nutritious profile, increases consumer use. Given this pattern of findings, policymakers should still consider on‐shelf nutrition labelling systems designed according to evidence‐informed recommendations, but should move forward with caution until research has confirmed optimal label design and clarified the mechanisms through which dietary intake is improved and associations with nutrition‐related health outcomes have been observed.
Supporting information
Appendix A. Estimated Effect of the Guiding Stars System on the Log (Share of Star Rating per Serving Purchased)
Appendix B. Estimated Effect of the Guiding Stars System on the Log (Share of Star Ratings per Product [ie, UPC] purchased) for Two Months Postimplementation
Appendix C. Estimated Effect of the Guiding Stars System on the Log (Share of Star Rating per Product [ie, UPC] purchased) in Loblaws Relative to Superstore Supermarkets
Appendix D. Estimated Effect of the Guiding Stars System Using Levels
Appendix E. Estimated Effect of the Guiding Stars System on the Log (Nutritional Effects per Serving Purchased)
Appendix F. Percentage of Exit Survey Participants That are Aware of, Understand, and Self‐Report Using the Guiding Stars System in Supermarkets by Labelling Condition
Appendix G. Percentage of Exit Survey Participants That Support On‐Shelf Nutrition Labels in Supermarkets by Labelling Condition
Funding/Support
This work was supported by the Canadian Institutes for Health Research (CIHR). Additional support was provided by the Propel Centre for Population Health Impact, Public Health Ontario, CIHR Applied Public Health Chairs (to DH and LR), and a Banting Postdoctoral Fellowship Award (to LV).
Conflict of Interest Disclosures: All authors have completed and submitted the ICMJE Form for Disclosure of Potential Conflicts of Interest. No conflicts were reported.
Acknowledgments: The authors would like to thank Loblaw for their data support, and the RAs who assisted with collecting survey data.
References
- 1. Global burden of disease country profiles—Canada . Institute for Health Metrics and Evaluation website. http://www.healthdata.org/canada. Accessed June 20, 2017.
- 2. Global burden of disease country profiles—United States . Institute for Health Metrics and Evaluation website. http://www.healthdata.org/united‐states. Accessed October 27, 2016.
- 3. Global burden of disease country profiles—Australia . Institute for Health Metrics and Evaluation website. http://www.healthdata.org/australia. Accessed October 27, 2016.
- 4. Muller D, Murphy N, Johansson M, et al. Modifiable causes of premature death in middle‐age in Western Europe: results from the EPIC cohort study. BMC Med. 2016;14:87. [DOI] [PMC free article] [PubMed] [Google Scholar]
- 5. World Health Organization . Global strategy on diet, physical activity, and health. http://www.who.int/dietphysicalactivity/strategy/eb11344/strategy_english_web.pdf. Published 2002. Accessed October 27, 2016.
- 6. World Health Organization . Global health risks: mortality and burden of disease attributable to selected minor risks. www.who.int/healthinfo/global_burden_disease/GlobalHealthRisks_report_full.pdf. Published 2009. Accessed October 27, 2016. [Google Scholar]
- 7. Schermel A, Emrich T, Arcand J, Wong C, L'Abbe M. Nutrition marketing on processed food packages in Canada: 2010 Food Label Information Program. Appl Physiol Nutr Metab. 2013;38:666‐672. [DOI] [PMC free article] [PubMed] [Google Scholar]
- 8. European Food Information Council . Global update on nutrition labelling: executive summary. http://www.gftc.ca/uploads/userfiles/files/globalupdateexecsumfeb2013_final.pdf. Published February 2013. Accessed June 20, 2017.
- 9. US National Academies . Examination of Front‐of‐Package Nutrition Rating Systems and Symbols: Phase I Report. Washington, DC: The National Academies Press; 2010. [PubMed] [Google Scholar]
- 10. Emrich T, Arcand J, L'Abbe M. Front‐of‐package nutrition labelling systems: a missed opportunity? Can J Public Health. 2012;103(4):e260‐e262. [DOI] [PMC free article] [PubMed] [Google Scholar]
- 11. Dietitians of Canada; Diabetes, Obesity, and Cardiovascular Disease Network . Evidence‐based background paper on point‐of‐purchase nutrition programs. https://www.dietitians.ca/Downloads/Public/POP‐Nutrition‐Programs‐pdf.aspx. Published September 2006. Accessed June 20, 2017.
- 12. Hodgkins C, Barnett J, Wasowicz‐Kirylo G, et al. Understanding how consumers categorise nutritional labels: a consumer derived typology for front‐of‐pack nutrition labels. Appetite. 2012;59:806‐817. [DOI] [PubMed] [Google Scholar]
- 13. Brownell K, Koplan J. Front‐of‐package nutrition labelling—an abuse of trust by the food industry? N Engl J Med. 2011;364:2373‐2375. [DOI] [PubMed] [Google Scholar]
- 14. World Cancer Research Fund International . Nourishing framework: nutritional label standards and regulations on the use of claims and implied claims on foods. http://www.wcrf.org/int/policy/nourishing‐framework. Accessed June 25, 2017.
- 15. United States Department of Agriculture Foreign Agricultural Service . Chile's new nutritional labeling law. Global Agriculture Information Network report number CI1513. https://gain.fas.usda.gov/Recent%20GAIN%20Publications/Chile's%20New%20Nutritional%20Labeling%20Law_Santiago_Chile_6‐26‐2015.pdf. Published June 26, 2015. Accessed October 27, 2016.
- 16. Food Standards Agency . Food Labels. London, England: Food Standards Agency; 2008. http://www.eatwell.gov.uk/. Accessed October 27, 2016. [Google Scholar]
- 17. Healthy Star Rating System . Government of Australia website. http://healthstarrating.gov.au/internet/healthstarrating/publishing.nsf/content/home. Accessed October 27, 2016.
- 18. MERCOSUL/GMC/Res No. 46/03 . Regulamento Técnico Mercosul Sobre Rotulagem Nutricional de Alimentos Embalados. Monterndies: MERCOSUL. http://www.temasactuales.com/assets/pdf/gratis/GMCRes_044_03.pdf. Accessed October 27, 2016.
- 19. Grunert K, Wills J. A review of European research on consumer response to nutrition information on food labels. J Public Health. 2007;15:385‐399. [Google Scholar]
- 20. US National Academies . Examination of Front‐of‐Package Nutrition Rating Systems and Symbols: Promoting Healthier Choices. Phase II Report. Washington, DC: The National Academies Press; 2011. [DOI] [PMC free article] [PubMed] [Google Scholar]
- 21. Roberto C, Bragg M, Schwartz M, et al. Facts up front versus traffic light food labels: a randomized controlled trial. Am J Prev Med. 2012;43(2):134‐141. [DOI] [PubMed] [Google Scholar]
- 22. Roberto C, Bragg M, Livingston K, et al. Choosing front‐of‐package food labelling nutritional criteria: how smart were “Smart Choices”? Public Health Nutr. 2012;15(2):262‐267. [DOI] [PubMed] [Google Scholar]
- 23. Hawley K, Roberto C, Bragg M, Liu P, Schwartz M, Brownell K. The science of front‐of‐package food labels. Public Health Nutr. 2012;16(3):430‐439. [DOI] [PMC free article] [PubMed] [Google Scholar]
- 24. Malam S, Clegg S, Kirwan S, Research McGinigal S; BMRB Social. Comprehension and use of UK nutrition signpost labelling schemes. http://webarchive.nationalarchives.gov.uk/20131104005023/ http://www.food.gov.uk/multimedia/pdfs/pmpreport.pdf. Published May 2009. Accessed June 20, 2017.
- 25. Sacks G, Rayner M, Swinburn B. Impact of front‐of‐pack “traffic‐light” nutrition labelling on consumer food purchases in the UK. Health Promot Int. 2009;24(4):344‐352. [DOI] [PubMed] [Google Scholar]
- 26. Feunekes G, Gortmaker I, Willems A, Lion R, van den Kommer M. Front‐of‐pack nutrition labelling: testing effectiveness of different nutrition labelling formats front‐of‐pack in four European countries. Appetite. 2008;50:57‐70. [DOI] [PubMed] [Google Scholar]
- 27. Thorndike A, Sonnenberg S, Riis J, Barraclough S, Levy D. A 2‐phase labeling and choice architecture intervention to improve healthy food and beverage choices. Am J Public Health. 2012; 102(3):527‐533. [DOI] [PMC free article] [PubMed] [Google Scholar]
- 28. Office of the Prime Minister of Canada . Minister of health mandate letter. http://pm.gc.ca/eng/minister‐health‐mandate‐letter. Accessed October 27, 2016.
- 29. Front‐of‐Package Labeling Initiative . US Food and Drug Administration website. http://www.fda.gov/Food/IngredientsPackagingLabeling/LabelingNutrition/ucm202726.htm. Updated October 20, 2015. Accessed October 27, 2016.
- 30. Touraine, Marisol . Projet de loi n°2302 relatif à la Santé, présenté au nom de M. Manuel Valls, Premier ministre, par Mme Marisol Touraine, ministre des affaires sociales, de la santé et des droits des femmes. Exposé des motifs. Paris: Assemblée Nationale; April 22, 2015.
- 31. Cameron A, Charlton E, Ngan W, Sacks G. A systematic review of the effectiveness of supermarket‐based interventions involving product, promotion, or place, on the healthiness of consumer purchases. Curr Nutr Rep. 2016;5:129. [Google Scholar]
- 32. Escaron A, Meinen A, Nitzke S, Martinez‐Donate A. Supermarket and grocery store‐based interventions to promote healthful food choices and eating practices: a systematic review. Prev Chronic Dis. 2013;10:E50. [DOI] [PMC free article] [PubMed] [Google Scholar]
- 33. NuVal Nutritional Scoring System . NuVal LLC website. http://www.nuval.com. Accessed October 27, 2016.
- 34. Guiding Stars. Hannaford website . http://www.hannaford.com/content.jsp?pageName=GuidingStars&leftNavArea=HealthLeftNav. Accessed October 27, 2016.
- 35. Nikolova H, Inman J. Healthy choice: the effect of simplified point‐of‐sale nutritional information on consumer food choice behavior. J Marketing Research. 2015;52(6):817‐835. [Google Scholar]
- 36. Sutherland L, Kaley L, Fischer L. Guiding Stars: the effect of a nutrition navigation program on consumer purchases at the supermarket. Am J Clin Nutr. 2010;91(4):1090S‐1094S. [DOI] [PubMed] [Google Scholar]
- 37. Cawley J, Sweeney M, Sobal J, et al. The impact of a supermarket nutrition rating system on purchases of nutritious and less nutritious foods. Public Health Nutr. 2014;18(1):1‐7. [DOI] [PMC free article] [PubMed] [Google Scholar]
- 38. Rahkovsky I, Lin B, Lin T, et al. Effects of the Guiding Stars program on purchases of ready‐to‐eat cereals with different nutritional attributes. Food Policy. 2013;43:100‐107. [Google Scholar]
- 39. About . Guiding Stars Canada website. http://guidingstars.ca/about/. Accessed October 27, 2016.
- 40. Guiding Stars Canada . Understanding the science behind the Guiding Stars algorithm for Canada. http://guidingstars.ca/downloads/. Published January 14, 2012. Accessed October 27, 2016.
- 41. Fisher L, Sutherland L, Kaley L, et al. Development and implementation of the Guiding Stars nutrition guidance program. Am J Health Promot. 2011; 26(2):e55‐e62. [DOI] [PubMed] [Google Scholar]
- 42. Raymond James Ltd . Canada Research. Loblaw Companies Ltd. http://www.raymondjames.ca/en_ca/equity_capital_markets/equity_research/sample_research/docs/Loblaw%20Companies%20Ltd.%20011612.pdf. Published January 16, 2012. Accessed October 27, 2016.
- 43. Census Tract Profiles, 2006 Census . Statistics Canada website. http://www12.statcan.ca/census‐recensement/2006/dp‐pd/prof/92‐597/. Accessed October 27, 2016.
- 44. United States Department of Agriculture . What We Eat in America food categories. http://www.ars.usda.gov/SP2UserFiles/Place/80400530/pdf/1112/food_category_list.pdf. Published 2012. Accessed November 17, 2016.
- 45. Canadian Nutrient File . Government of Canada website. https://food‐nutrition.canada.ca/cnf‐fce/index‐eng.jsp. Modified July 14, 2016. Accessed November 17, 2016.
- 46. American Association for Public Opinion Research . Standard definitions: final dispositions of case codes and outcomes for surveys. https://www.esomar.org/uploads/public/knowledge‐and‐standards/codes‐and‐guidelines/ESOMAR_Standard‐Definitions‐Final‐Dispositions‐of‐Case‐Codes‐and‐Outcome‐Rates‐for‐Surveys.pdf. Revised 2011. Accessed October 27, 2016.
- 47. US Centers for Disease Control and Prevention . National Health and Nutrition Examination Survey, 2009–2010. http://www.cdc.gov/nchs/data/nhanes/nhanes_07_08/screener1_07_eng.pdf. Accessed October 27, 2016.
- 48. Statistics Canada . 2006. Census questionnaires and guides. http://www23.statcan.gc.ca/imdb‐bmdi/pub/instrument/3901_Q2_V3‐eng.pdf. Accessed October 27, 2016.
- 49. Statistics Canada . Canadian Community Health Survey (CCHS). http://www23.statcan.gc.ca/imdb‐bmdi/instrument/3226_Q1_V9‐eng.htm. Accessed October 27, 2016.
- 50. McCrory C, Vanderlee L, White CM, Reid JL, Hammond D. Knowledge of recommended calorie intake and influence of calories on food selection among Canadians. J Nutr Educ Behav. 2016;48(3):199‐207. [DOI] [PubMed] [Google Scholar]
- 51. Hawley K, Roberto C, Bragg M, Liu P, Schwartz M, Brownell K. The science of front‐of‐package food labels. Public Health Nutr. 2012;16(3):430‐439. [DOI] [PMC free article] [PubMed] [Google Scholar]
- 52. Rao M, Afshin A, Singh G, Mozaffarian D. Do healthier foods and diet patterns cost more or less than less healthy options? A systematic review and meta‐analysis. BMJ Open. 2013;3(12):e004277. [DOI] [PMC free article] [PubMed] [Google Scholar]
- 53. Mackenbach J, Burgoine T, Lakerveld J, et al. Accessibility and affordability of supermarkets: associations with the DASH diet. Am J Prev Med. 2017;53(1):55‐62. [DOI] [PMC free article] [PubMed] [Google Scholar]
- 54. Grunert K, Wills J, Fernandez‐Celemin L. Nutrition knowledge, and use and understanding of nutrition information on food labels among consumers in UK. Appetite. 2010;55(2):177‐189. [DOI] [PubMed] [Google Scholar]
- 55. Goodman S, Hammond D, Pillo‐Blocka F, Glanville T, Jenkins R. Use of nutritional information in Canada: national trends between 2004 and 2008. J Nutr Educ Behav. 2011;43(5):356‐365. [DOI] [PubMed] [Google Scholar]
- 56. Campos S, Doxey J, Hammond D. Nutrition labels on pre‐packaged foods: a systematic review. Public Health Nutr. 2011;14(8):1496‐1506. [DOI] [PubMed] [Google Scholar]
- 57. Skubisz C. Naturally good: front‐of‐package claims as message cues. Appetite. 2017;108:506‐511. [DOI] [PubMed] [Google Scholar]
- 58. Higginson C, Rayner M, Draper S, Kirk T. How do consumers use nutrition label information? Nutr Food Sci. 2002;32(4/5) :145‐152. [Google Scholar]
- 59. Drewnowski A. What's next for nutrition labeling and health claims? An update on nutrient profiling in the European Union and the United States. Nutr Today. 2007;24(5):688‐694. [Google Scholar]
- 60. Foltran F, Verduci E, Ghidina M, et al. Nutritional profiles in a public health perspective: a critical review. J Int Med Res. 2010;38(2):318‐385. [DOI] [PubMed] [Google Scholar]
- 61. Kardes R, Sanbonmatsu D, Herr P. Consumer expertise and the feature‐positive effect: implications for judgement and inference. Adv Consum Res. 1990;17:351‐354. [Google Scholar]
Associated Data
This section collects any data citations, data availability statements, or supplementary materials included in this article.
Supplementary Materials
Appendix A. Estimated Effect of the Guiding Stars System on the Log (Share of Star Rating per Serving Purchased)
Appendix B. Estimated Effect of the Guiding Stars System on the Log (Share of Star Ratings per Product [ie, UPC] purchased) for Two Months Postimplementation
Appendix C. Estimated Effect of the Guiding Stars System on the Log (Share of Star Rating per Product [ie, UPC] purchased) in Loblaws Relative to Superstore Supermarkets
Appendix D. Estimated Effect of the Guiding Stars System Using Levels
Appendix E. Estimated Effect of the Guiding Stars System on the Log (Nutritional Effects per Serving Purchased)
Appendix F. Percentage of Exit Survey Participants That are Aware of, Understand, and Self‐Report Using the Guiding Stars System in Supermarkets by Labelling Condition
Appendix G. Percentage of Exit Survey Participants That Support On‐Shelf Nutrition Labels in Supermarkets by Labelling Condition