Investigating the dense meshwork of axons, dendrites, and synapses that form neuronal circuits is possible with high-resolution serial-section electron microscopy1 (ssEM). However, the imaging scale required to comprehensively reconstruct these structures is >10 orders of magnitude smaller than the spatial extents occupied by networks of interconnected neurons2—some spanning nearly the entire brain. Difficulties in generating and handling data for large volumes at nanoscale resolution have thus restricted vertebrate studies to fragments of circuits. These efforts were recently transformed by advances in computing, sample handling, and imaging techniques1, but high-resolution examination of entire brains remains a challenge. Here, we present ssEM data for a complete 5.5 days post-fertilisation (dpf) larval zebrafish brain. Our approach utilizes multiple rounds of targeted imaging at different scales to reduce acquisition time and data management. The resulting dataset can be analysed to reconstruct neuronal processes, permitting us to survey all myelinated axons (the projectome). These reconstructions enable precise investigations of neuronal morphology, which reveal remarkable bilateral symmetry in myelinated reticulospinal and lateral line afferent axons. We further set the stage for whole-brain structure-function comparisons by co-registering functional reference atlases and in vivo two-photon fluorescence microscopy data from the same specimen. All obtained images and reconstructions are provided as an open-access resource.
Pioneering studies in invertebrates established that wiring diagrams of complete neuronal circuits at synaptic resolution are valuable tools for relating nervous system structure and function3–7. These studies benefited from their model organisms’ small sizes and stereotypy, which enabled complete ssEM of an entire specimen or mosaicking from multiple individuals.
Vertebrate nervous systems, however, are considerably larger. Consequently, ssEM of whole vertebrate circuits requires rapid computer-based technologies for acquiring, storing, and analysing many images. Because vertebrate nervous systems can vary substantially between individuals8, anatomical data often must be combined with other experiments on the same animal9–11 to define relationships between structure, function, and behaviour. For mammalian brains, this analysis requires imaging very large volumes that are still technically out of reach (but see ref. 12), thus confining studies to partial circuit reconstructions13–19. One strategy for capturing brain-wide circuits is to generate high-resolution whole-brain datasets in smaller vertebrates.
The larval zebrafish is an ideal system for this endeavour. It is near-transparent, offering convenient optical access that permits whole-brain calcium imaging20. Additionally, its small size is well-suited for ssEM, having already enabled studies of specific brain subregions21, 22. Integrated with established genetic toolkits and quantitative behavioural assays21, it is an excellent model organism for investigating the neuronal basis of behaviour23.
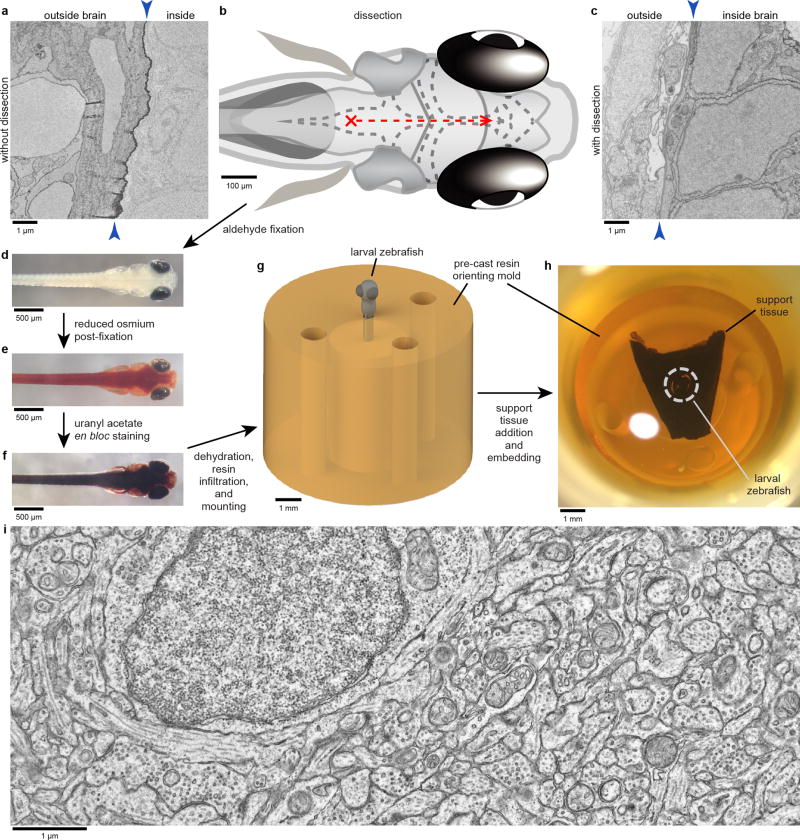
Our goal was to develop a framework for ssEM of complete larval zebrafish brains at 5–7dpf, when complex behaviours including prey capture24 and predator avoidance25 emerge. To preserve ultrastructure across the brain, we developed dissection techniques to remove skin and membranes from the dorsum that resulted in high-quality fixation and staining (Extended Data Fig. 1). Sectioning perpendicular to most axon and dendrite paths is preferable for ease and reliability in reconstructing neuronal morphology. Therefore, we oriented our cutting plane orthogonal to the long (anterior-posterior) axis, despite this requiring ~2.5× more sections than the horizontal orientation. We improved sectioning consistency by embedding samples surrounded by support tissue from mouse cerebral cortex, yielding a section library that could be imaged multiple times at different resolutions (Extended Data Fig. 2).
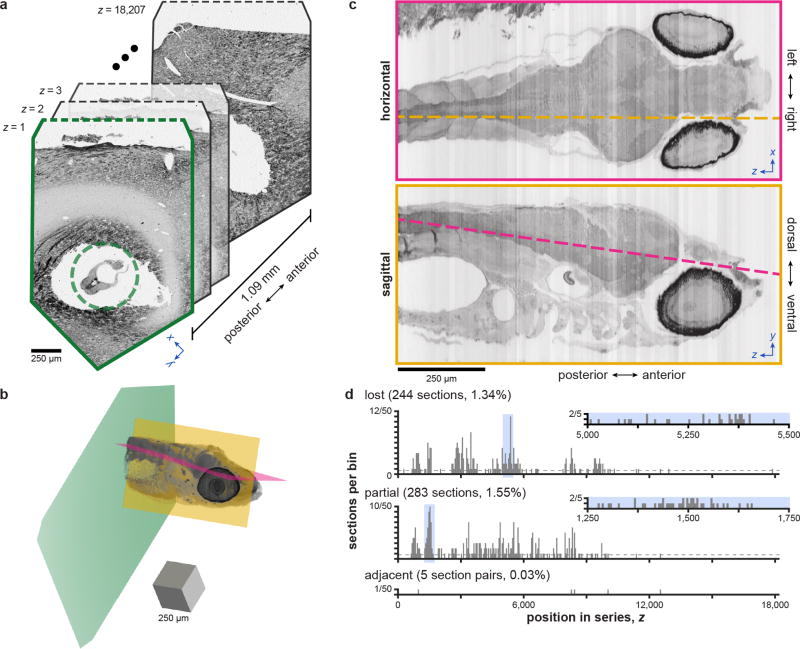
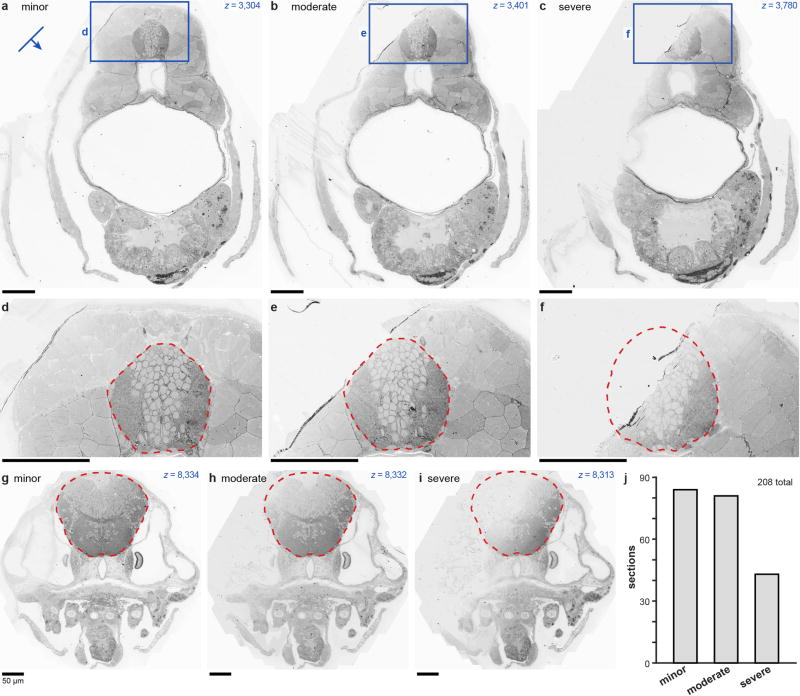
Overview images were acquired to survey all sections (Extended Data Figs. 3–4; Supplementary Video 1–2), resulting in a 1.02×1010 µm3 image volume with 3.01×10¹¹ voxels and occupying 310gigabytes. In total, 17,963×~60nm-thick sections were collected from 18,207 attempted, leaving 244 lost (1.34%), 283 containing partial tissue regions (1.55%; Extended Data Fig. 5), no adjacent losses, and 5 adjacent lost-partial or partial-partial events (0.03%). This low-resolution data confirmed that our approach enabled stable sectioning through a millimetre-long region spanning from myotome 7 to the anterior-most structures—encompassing some spinal cord and the entire brain.
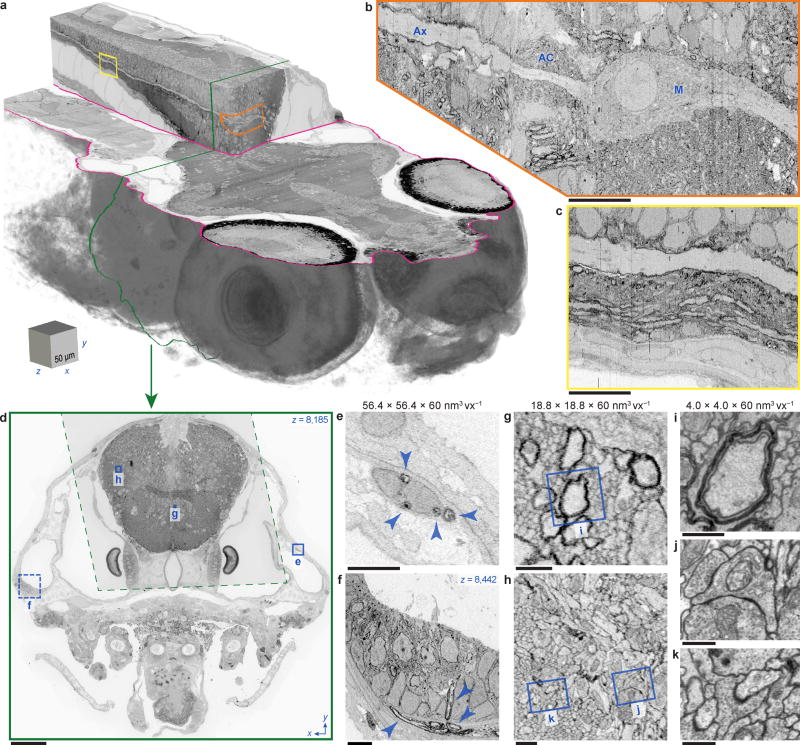
We next selected sub-regions to capture areas of interest at higher resolutions26, 27, first performing isotropic imaging over the anterior-most 16,000 sections (Fig. 1a–d; Supplementary Video 3). All cells are labelled in ssEM, so this data offers a dense picture of the fine anatomy across the anterior quarter of the larval zebrafish including the brain, sensory organs, and other tissues. Furthermore, its 56.4×56.4×60 nm3vx−1 resolution is ~500× greater than that afforded by diffraction-limited light microscopy. The 2.28×108µm3 volume consisted of 1.12×10¹² voxels and occupied 2.4 terabytes (TB). In this data, one can reliably identify cell nuclei and track large-calibre myelinated axons (Fig. 1e–f; Supplementary Video 4). To resolve its tightly packed structures, 18.8×18.8×60 nm3vx−1 imaging was performed for the brain over 12,546 sections (Fig. 1g–h). The resulting 5.49×107 µm3 volume consisted of 2.36×10¹²voxels and occupied 4.9TB. Additional 4.0×4.0×60 nm3vx−1 acquisition was used for inspecting regions of interest, resolving finer axons and dendrites, and identifying synapses between neurons (Fig. 1i–k). Image co-registration across sections and scales then formed a coherent multi-resolution dataset.
Figure 1. Targeted, multi-scale ssEM of a larval zebrafish brain.
a, The anterior quarter of a larval zebrafish was captured at 56.4×56.4×60 nm3vx−1 resolution from 16,000 sections. b, The Mauthner cell (M), axon cap (AC), and axon (Ax) illustrate features visible in the 56.4×56.4×60 nm3vx−1 image volume. c, Posterior Mauthner axon extension. d, Targeted re-acquisition of brain tissue at 18.8×18.8×60 nm3vx−1 (dashed) from 12,546 sections was completed after 56.4×56.4×60 nm3vx−1 full cross-sections (solid). e–f, Peripheral myelinated axons (arrowheads) recognized at 56.4×56.4×60 nm3vx−1 in nerves (e) and the ear (f). g–h, Neuronal processes including myelinated fibres can be segmented at 18.8×18.8×60 nm3vx−1. i–k, Targeted re-imaging to distinguish finer neuronal structures and their connections. Scale box: a, 50×50×50 µm3. Scale bars: b–c, 10µm; d, 50µm; e–f, 5µm; g–h, 1µm; i–k, 500nm.
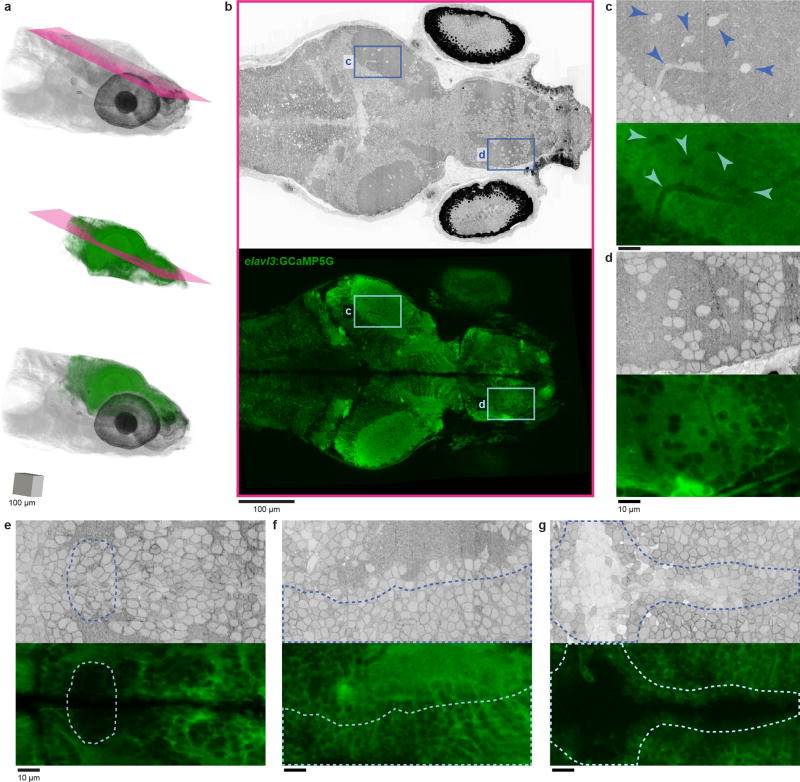
With a framework in place for whole-brain ssEM, we tested our ability to identify the same neurons or regions across imaging modalities9–11 at this scale (Extended Data Figs. 6–8). Using common structural features, we matched nuclei in ssEM data to their locations in two-photon calcium imaging data from the same animal (Supplementary Video 5). Reference atlases containing molecular labels were similarly co-registered. These results serve as proof-of-principle for the integration of rich activity maps with subsequent whole-brain structural examination of functionally characterized neurons and their networks.
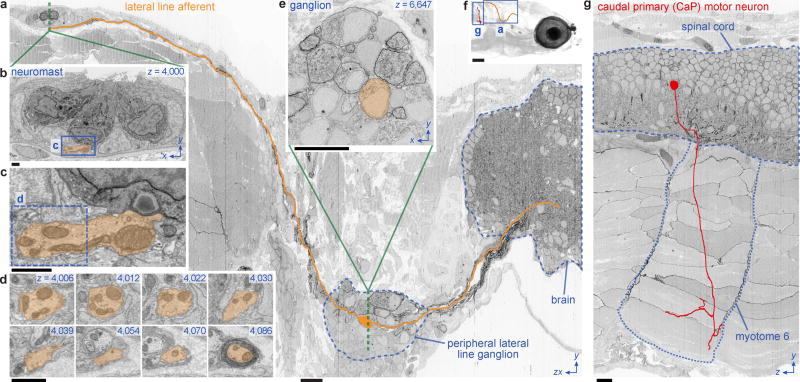
We next tested the general applicability of this dataset for neuron reconstructions. First, we reconstructed a peripheral lateral line afferent neuron that innervated a dorsal neuromast sensory organ (Fig. 2a–e; Supplementary Video 6). By re-imaging at 4.0×4.0×60 nm3vx−1, we identified synapses connecting this afferent with neuromast hair cells. We then annotated a myelinated spinal motor neuron that directly contacted muscle (Fig. 2f). Myelinated axons could also be identified and tracked within the brain. These reconstructions highlight the utility of multi-resolution ssEM for reassembling neuron morphologies from sensory inputs, throughout the brain, and to peripheral innervation of muscle.
Figure 2. Neuron reconstructions capturing sensory input and motor output.
a, Bipolar lateral line afferent neuron tracked from a neuromast (b–d) through its ganglion (e) into the hindbrain over ~5,000 serial sections. b, Dorsal neuromast innervated by the afferent. c, Ribbon synapse connecting the afferent and a hair cell. d, The afferent exiting the neuromast and becoming myelinated. e, Myelinated perikarya evident in the peripheral lateral line ganglion. f, Volume rendering depicting reconstructions in this figure. g, CaP motor neuron leaving the spinal cord and innervating myotome 6. Scale bars: f, 100µm; a,e,g, 10µm; b–d, 1µm.
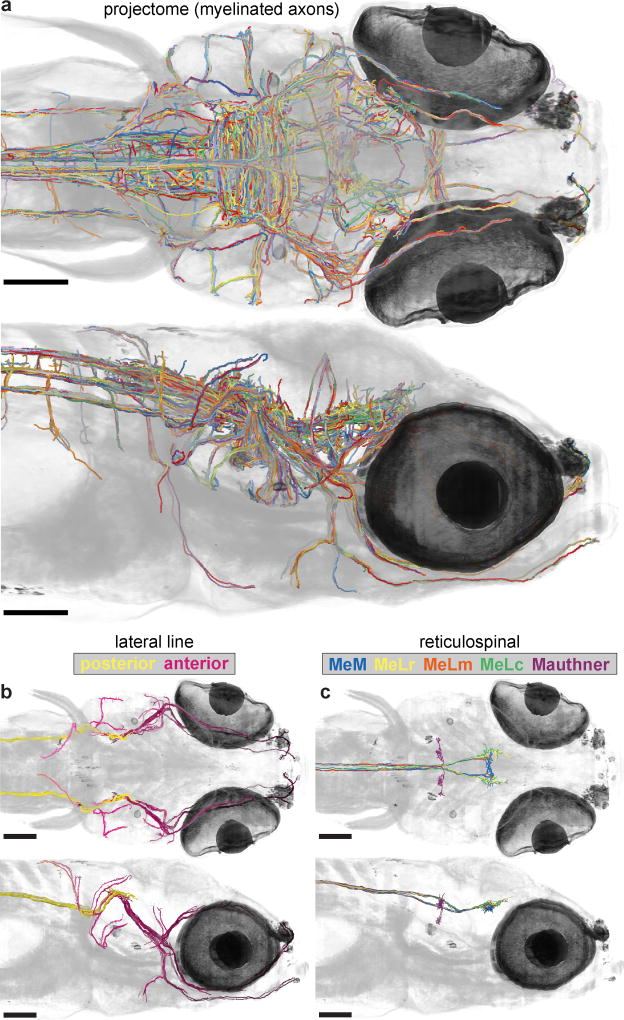
To extend our analysis, we produced a ‘projectome’ reconstruction consisting of all myelinated axons (Fig. 3a; Supplementary Video 7). We reconstructed 2,589 myelinated axon segments along with many attached somata and dendrites to yield 39.9cm of combined length. Of these, 834 myelinated axons comprising 30.6cm were easily followed to somata, while unmyelinated stretches made them difficult to reach for the remaining 9.3cm. The longest reconstruction, of a trigeminal sensory afferent, was 1.2mm long and extended from anterior skin sensory terminals to the hindbrain.
Figure 3. Reconstruction of a larval zebrafish projectome.
a, Myelinated axon reconstructions from top (upper) and side (lower) views. b, Lateral line afferent reconstructions. Those innervating identified neuromasts are labelled anterior (purple, darker more anterior), while posterior lateral line nerve members are labelled posterior (yellow). c, Reticulospinal neuron reconstructions including the Mauthner and nucleus of the medial longitudinal fasciculus (nucMLF) neurons including MeLc (green), MeLr (yellow), MeLm (orange), and MeM (blue). Note bilateral symmetry apparent in b–c. Scale bars: a–c, 100µm; d–e, 50µm.
The resulting projectome included 94 lateral line afferents that innervated 41 neuromasts (Fig. 3b). These reconstructions revealed striking bilateral symmetry in the lateral line system (Supplementary Video 8). Only one neuromast and its afferents lacked contralateral counterparts. This may be an important anatomical feature that facilitates comparisons of local velocity vector fields for detecting differential flow along the left and right sides, which is essential for larval zebrafish rheotaxis behaviour28.
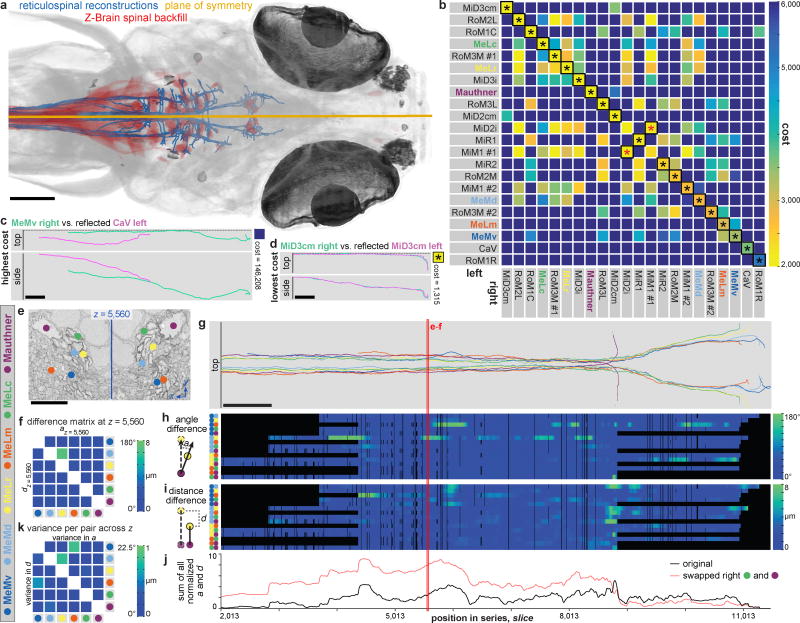
Also included was a significant fraction of midbrain and hindbrain reticulospinal neurons, which send axons to the spinal cord (Fig. 3c,e). Similar to lateral line neurons, these appeared bilaterally symmetric (Supplementary Video 9). However, our ability to identify reticulospinal neurons by their known positions and morphologies29 afforded the opportunity to precisely examine the extent of their symmetry (Extended Data Fig. 9a–d). We selected 22 identified left-right reticulospinal neuron pairs (44 total) whose myelinated axons form the medial longitudinal fasciculus (MLF) to quantify the degree of bilateral symmetry (Fig. 4a–d). Developing a cost metric allowed us to investigate whether myelinated MLF axons of one hemisphere are symmetric in three-dimensional shape and position to axons of their contralateral homologs. Notably, globally optimal pairwise assignment based on computed costs matched left-right homologs in all but one pair (Fig. 4b).
Figure 4. Bilateral symmetry in myelinated reticulospinal axon reconstructions.
a–d, Analysis of symmetry in 3-D position and shape for 22 identified left-right neuron pairs with axons in the medial longitudinal fasciculus (MLF). a, Plane of symmetry fit from reticulospinal reconstructions, which were identified by morphology and Z-Brain spinal backfill label overlap. b, Costs computed from comparisons of each axon with every reflected contralateral axon. Globally optimal pairwise assignment matched left-right homologs (asterisks) for all but one pair (red). Low off-diagonal costs highlight similarities across neuron types. c–d, Highest (c) and lowest (d) cost comparisons. e–k, Analysis of symmetry in 2-D neighbour relations for a subset of 6 left-right pairs. e, Apparent mirror-symmetric relative positioning across the midline. f, Angle and distance differences from one slice, with every vector between two left axons compared to the reflected vector between the right axons having the same identities. g, Examined myelinated axon subset. h–i, Mirror-symmetric relative positional arrangements over long MLF stretches apparent by linearizing angle (h) and distance (i) differences. Neighbour relations return to a symmetric state despite local perturbations. Black indicates insufficient data. j, Summing normalized differences uncovered regions with perturbations (peaks), as where axons entered the MLF. Artificially swapping two left axon identities nearly doubled this sum. k, Axon sets with weaker neighbour relations exhibit greater variance in angle and distance difference across slices. Scale bars: a, 100µm; c,d,g, 50µm; e, 5µm.
We additionally noticed that axons appeared to occupy similar domains within the left and right tracts (Fig. 4e), leading us to investigate possible symmetry in neighbour relations. We selected a subset of 6 left-right pairs and analysed their spatial relationships by comparing the vector between each set of two left axons to the reflected vector between the right axons having the same identities (Extended Data Fig. 9e–h) on every slice. From all 15 pairwise combinations, we observed that these positional arrangements within the MLF were mirror-symmetric over long stretches (Fig. 4f–j; Supplementary Video 10). Moreover, the neighbour relations returned to a symmetric state away from local perturbations (e.g., new axon entering the MLF). Similar relationships were seen in the larger set of 22 reticulospinal axon pairs (Extended Data Fig. 9i–k).
Although these axons originate from stereotyped locations29, we expected the MLF would become progressively more scrambled like peripheral mammalian motor nerves, which show no mirror symmetry8. If this were true, MLF configurations should become less symmetric as they travel further posterior. The fact that scrambling does not occur suggests that axon bundles preserve positional information along their length, an idea with precedent in ribbon-shaped optic nerves of certain fish species but thought to be a special feature of this structure30. Our results instead indicate that stereotyped neighbour relations may be a general feature of central nerve tracts.
However, we can only speculate about the purpose of maintaining this positional information. We cannot say if symmetrical axon trajectories are accompanied by symmetrical connections. If so, symmetry might assure that axons find appropriate postsynaptic targets. Importantly, not all MLF axons exhibited strong positional stereotypy (Fig. 4k; Extended Data Fig. 9i–k). Perhaps larval zebrafish central nerve tracts contain both axons that rely on intrinsically stereotyped positions to innervate specific targets and others that do not. Developing axons could rely on fasciculation with existing axons that previously pioneered the pathway, or positional information acting on a growth cone could alternatively maximize the likelihood of reaching intended postsynaptic partners. Whatever the purpose and mechanism, the evident stereotypy indicates that some neurons are identifiable from their axon’s precise location within nerve tracts.
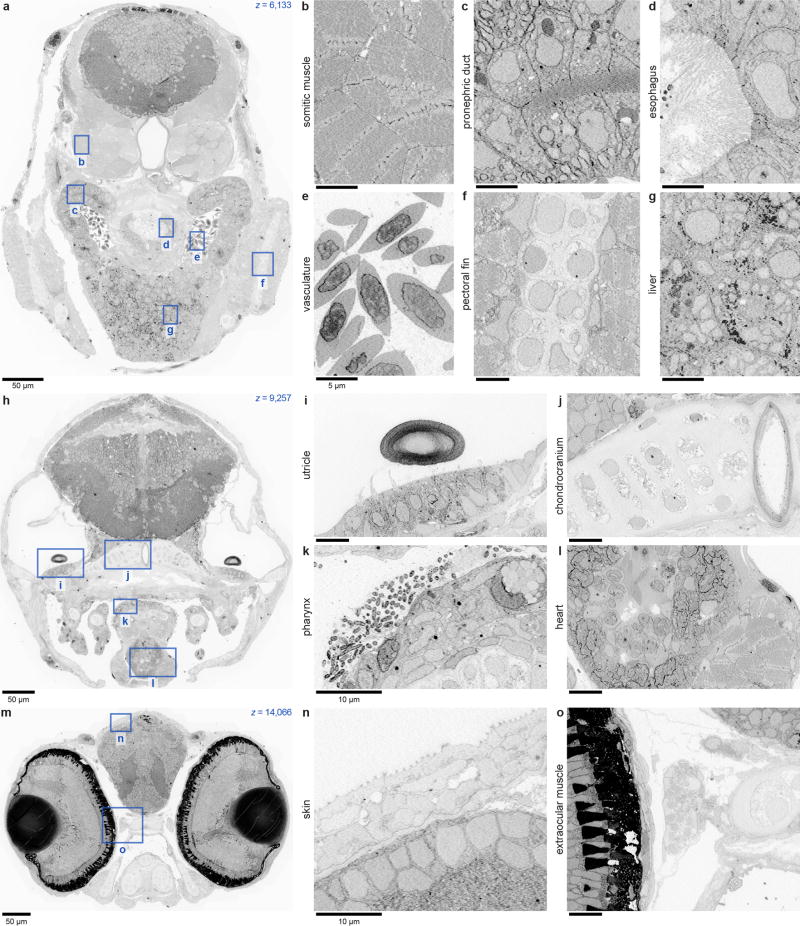
Here, we demonstrate the feasibility of whole-brain ssEM for neuron reconstructions in larval zebrafish and illustrate the utility of re-imaging at multiple scales for reducing imaging time and data storage requirements. Finally, the presented dataset is not limited to nervous system analyses. It also contains other organ systems, including musculoskeletal, cardiac, intestinal, and pancreatic tissues (Extended Data Fig. 10), thus serving as an open-access resource that is available for the scientific community (http://zebrafish.link/hildebrand16).
Methods
Animal care
Adult zebrafish (Danio rerio) for breeding were maintained at 28 °C on a 14 hr:10 hr light:dark cycle following standard methods31. The Tg(elavl3:GCaMP5G)a4598 transgenic line32 used in this study was of genotype elavl3:GCaMP5G+/+; nacre (mitfa−/−), conveying nearly pan-neuronal expression of the calcium indicator GCaMP5G33 and increased transparency due to the nacre mutation34. The larval zebrafish samples described in this study were raised in filtered fish facility water31 until 5–7 days post-fertilization (dpf).
Mice from which support tissue was collected had been previously euthanized for other experiments. Only unused, to-be-discarded tissue was harvested to serve as support tissue.
The Standing Committee on the Use of Animals in Research and Training of Harvard University approved all animal experiments.
Two-photon laser-scanning microscopy
Larval zebrafish were immobilized by immersion in 1 mg mL−1 α-bungarotoxin (Invitrogen) and mounted dorsum-up in 2% low-melting-temperature agarose in a small dish containing a silicone base (Sylgard® 184, Dow Corning). Upon agarose hardening, E3 solution (5 mM NaCl, 0.17 mM KCl, 0.33 mM CaCl2, and 0.33 mM MgSO4) was added to the dish. In vivo structural imaging of elavl3-driven GCaMP5G signal was conducted with a custom-built two-photon microscope equipped with a Ti:Sapphire laser (Mai Tai®, Spectra-Physics) excitation source tuned to 800 nm. Frames with a 764.4×509.6 µm2 field of view size (1200×800 px2) were acquired at 1 µm intervals (0.637×0.637×1 µm3vx−1) at ~1 Hz with a scan pattern of four evenly spaced, interlaced passes35. A low-noise anatomical snapshot of brain fluorescence was captured in 300 planes, each the sum of 50 single frames. All light-based imaging was performed without any intentional stimulus presentation.
Dissection and tissue preparation
Initial attempts at high-quality larval zebrafish brain preservation were impeded by skin and membranes, which prevented sufficient fixation with whole-fish immersion alone (Extended Data Fig. 1a). To overcome this, the skin and membranes covering the brain36 were dissected away.
Each larval zebrafish, previously immobilized and embedded for two-photon laser-scanning microscopy, was introduced to a dissection solution (64 mM NaCl, 2.9 mM KCl, 10 mM HEPES, 10 mM glucose, 164 mM sucrose, 1.2 mM MgCl2, 2.1 mM CaCl2, and pH 7.5; ref. 37) containing 0.02% (w/v) tricaine mesylate (MS-222, Sigma-Aldrich). Flow of red blood cells through the vasculature was confirmed before proceeding as an indicator of good health. A portion of agarose was removed to expose the dorsum from the posterior hindbrain to the anterior optic tectum. The dissection was initiated by puncturing the thin epithelial layer over the rhombencephalic ventricle above the hindbrain38 with a sharpened tungsten needle. Small incremental anterior-directed incisions were made along the midline as close to the surface as possible until the brain was exposed from the hindbrain entry to the middle of the optic tectum (Extended Data Fig. 1b). The majority of damage associated with this dissection was restricted to medial tectal proliferation zone progenitor cells39 that are unlikely to have integrated into functional neuronal circuits.
Dissections lasted 1–2 min, upon which time the complete dish was immersed in a 2.0% formaldehyde and 2.5% glutaraldehyde fixative solution (Electron Microscopy Sciences) overnight at room temperature (Extended Data Fig. 1d). Following washes, larval zebrafish were cut out from the dish in a block of agarose with a scalpel and moved to a round-bottom microcentrifuge tube. Specimens were then incubated in post-fixation solution containing 1% osmium tetroxide and 1.5% potassium ferricyanide for 2 hr (Extended Data Fig. 1e), washed with water, washed with 0.05M maleate buffer (pH 5.15), and stained with 1% uranyl acetate in maleate buffer overnight (Extended Data Fig. 1f). During the subsequent wash step with maleate buffer, larval zebrafish were freed from the surrounding agarose block and moved to a new microcentrifuge tube. Next, specimens were washed with water, dehydrated with serial dilutions of acetonitrile in water (25%, 50%, 70%, 70%, 80%, 90%, 95%, 100%, 100%, 100%) for 10 min each, and infiltrated with serial dilutions of a diepoxyoctane-based low viscosity resin40 in acetonitrile (25%, 50%, 75%, 100%) for 1 hr each. The samples were then embedded in the diepoxyoctane-based resin with surrounding support tissue and hardened for 2–3 days at 60 °C (Extended Data Fig. 1g–h). Aqueous solutions were prepared with water passed through a purification system (typically Arium 611VF, Sartorius Stedim Biotech). This process resulted in high-quality ultrastructure preservation (Extended Data Fig. 1i).
Additional solution, washing, and timing details were described previously in a step-by-step protocol41.
Serial sectioning
Consistent ultrathin sectioning was difficult to achieve in samples containing heterogeneous tissues but imperative for reconstructing three-dimensional (3-D) structure from a series of two-dimensional (2-D) sections. Tests revealed that errors occur primarily when the sample composition changed dramatically (e.g., borders between tissue and empty resin). We overcame this by embedding samples within a surrounding support tissue of mouse cerebral cortex (Extended Data Figs. 1g–h,2f).
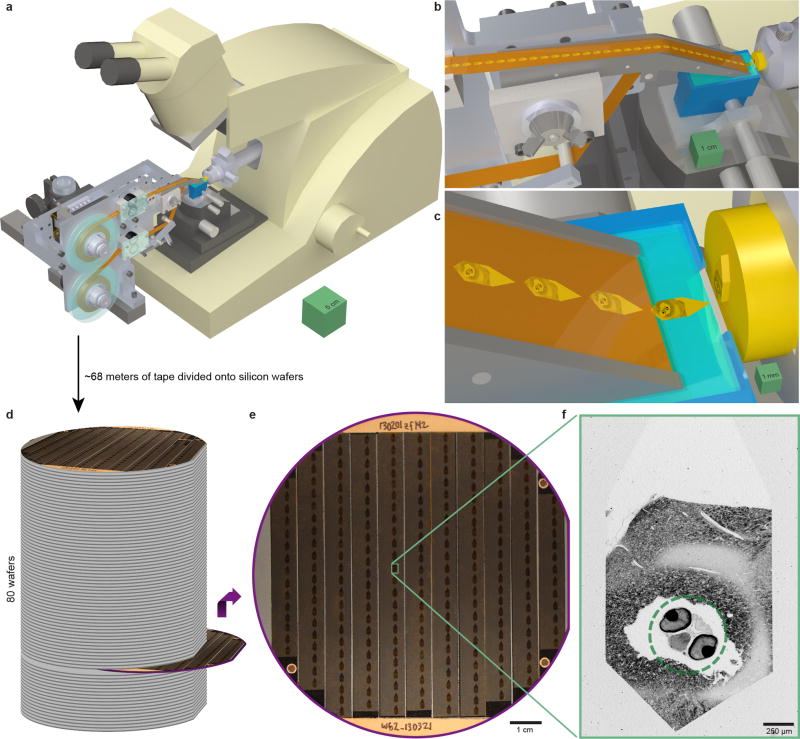
We preferred sectioning perpendicular to most axon and dendrite paths for ease and reliability in reconstructing neuronal morphology. For this, our cutting plane was oriented perpendicular to the long (anterior-posterior) axis, which required ~2.5× more sections than alternative orientations. This was made possible by customising an automated tape-collecting ultramicrotome26 by extending the device’s main mounting plate and enlarging its reels (compare Extended Data Fig. 2a with Fig. 1E from ref. 26) to accommodate one long tape stretch capable of collecting all sections.
Sections were continuously cut with a diamond knife (Extended Data Fig. 2b–c) affixed to an ultramicrotome (EM UC6, Leica) and collected onto 8mm-wide and 50–75 µm-thick tape (Kapton® polyimide film, DuPont). Restarts were occasionally required for three reasons: fine-tuning of tape positioning or settings is necessary at the beginning of a run; the ultramicrotome design is constrained by a cutting depth range of ~200 µm; and diamond knives must be shifted after cutting several thousand sections to expose the sample to a fresh edge before dulling impairs sectioning quality. When necessary, restarts were completed as quickly as possible (typically 1–2 min) to minimize possible thermal, electrostatic, or other fluctuations. For the same reason, tape reels were fed continuously without ever being reloaded or exchanged. This combination of fast restarts and continuous tape feeding successfully maintained a steady state across restarts.
We sectioned two larval zebrafish specimens and these represent the only two samples we have attempted to cut with the surrounding support tissue approach. The primary focus of this study was a 5.5 dpf larval zebrafish sectioned with a 45° ultra diamond knife (Diatome) and a nominal sectioning thickness that averaged 60 nm with a variable setting ranging from 50–70 nm depending on sectioning consistency. Restarts occurred after sections 276, 3,669, 6,967, 10,346, 12,523, 12,916, and 15,956. Knife shifts occurred after sections 6,967 and 12,916. After sectioning, the tape was cut into segments with a razor blade between collected sections and adhered with double-sided conductive carbon adhesive tape (Ted Pella) to 4 in-diameter silicon wafers (University Wafer), which served as an imaging substrate. A total of 17,963 × ~60 nm-thick sections were spread across 80 wafers (Extended Data Figs. 2d–e, 3).
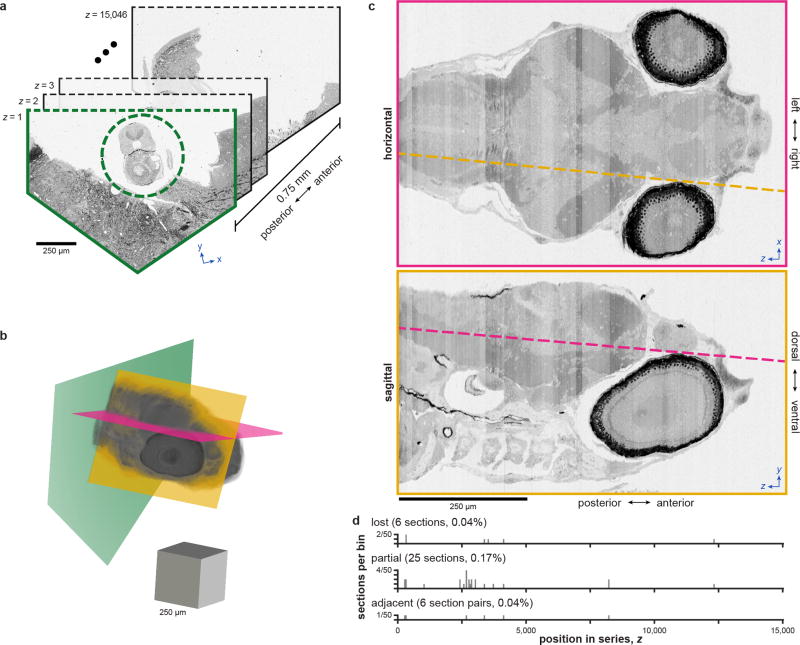
One potential limitation of the 5.5 dpf larval zebrafish series is the section thickness. Minimizing section thickness is an important factor in the success of axon and dendrite reconstructions1. Small neuronal processes (on the order of the section thickness) are difficult to reconstruct in thicker sections, especially when they are running roughly parallel to the plane of the section. To be sure that our approach was not fundamentally limited to thicker sections, we sectioned the second sample—a 7 dpf larval zebrafish—with a nominal sectioning thickness that remained constant at 50 nm throughout the entire cutting session using a 45° histo diamond knife (Diatome). Restarts occurred after sections 296, 312, 4,114, 8,233, and 12,333. Knife shifts occurred after sections 4,114 and 12,333. A total of 15,046 × ~50 nm-thick sections were obtained from 15,052 attempted (Extended Data Fig. 4) and spread across 70 wafers. The thinner sections did not result in more lost material: this series contained 6 losses (0.04%; Extended Data Fig. 4d upper), 25 partial sections (0.17%; Extended Data Fig. 4d middle), no adjacent losses, and 6 adjacent lost-partial or partial-partial events (0.04%; Extended Data Fig. 4d lower).
The nominal section thickness of ~60 nm made it possible to span the entire 5.5 dpf larval zebrafish brain in ~18,000 sections, as determined by finding the location of the spinal cord-hindbrain boundary42. Though the 7 dpf sample was sectioned at 50nm, it was not made the focus of subsequent imaging because of an over-trimming error that caused less of the brain to be captured. However, improved reliability for this sample despite a ~17% reduction in nominal sectioning thickness suggests that yet higher axial resolution is attainable. A section thickness of ≤30 nm would increase confidence in the ability to reconstruct complete neuronal circuit connectivity, and thicknesses of ≤30 nm are known to be possible for mammalian brain sections of comparable sizes27, 43 using a similar approach.
Once wafers contained tape segments, they were made hydrophilic by glow discharging very briefly, post-section stained for 1–2 min inside a chamber containing sodium hydroxide pellets using a stabilised lead citrate solution (UltroStain II, Leica) filtered through a 0.2 µm syringe filter, and then washed thoroughly with boiled water. A thin layer of carbon was then deposited onto each wafer to prevent charging during scanning electron microscopy.
Electron microscopy
WaferMapper software was then used with light-based wafer overview images to semi-automatically map the positions of all sections and relate them to fiducial markers. This enabled targeted section overview acquisition (758.8×758.8×60 nm3vx−1 for 5.5 dpf; 741.5×741.5×50 nm3vx−1 for 7 dpf). Semi-automated alignment of section overviews in WaferMapper then permitted targeting for imaging at higher resolutions26.
Field emission scanning electron microscopy of back-scattered electrons was primarily conducted on a Zeiss Merlin equipped with a large-area imaging scan generator (Fibics) and stock back-scattered electron detector. An accelerating voltage of 5.0 kV and beam current of 7– 10 nA were used for most acquisition. Imaging of back-scattered electrons at the highest resolutions (4.0×4.0×60 nm3vx−1) was performed on an FEI Magellan XHR 400L with an accelerating voltage of 5.0 kV and beam current of 1.6–3.2 A. Field of view sizes acquired from a given section varied depending on the cross-sectional area occupied by tissue. All acquisition was performed with a scan rate at or under 1 Mpx s−1. For the 5 dpf larval zebrafish, this resulted in overhead-inclusive acquisition times of 5.4 days for section overviews (758.8×758.8×60 nm3vx−1), 97 days for full transverse cross-sections (56.4×56.4×60 nm3vx−1), and 100 days for high-resolution brain images (18.8×18.8×60 nm3vx−1).
Continued development of faster ssEM technologies44 will hasten the re-imaging process and permit whole-brain studies in a fraction of the time required here.
Image alignment and intensity normalization
Producing anatomically consistent image registration over ~18,000 sections required control of region of interest drift, over-fitting, magnification changes, and intensities. In order to quickly assess the quality of the dataset and begin reconstructions, we initially performed affine intra- and inter-section image registrations with Fiji45 TrakEM2 alignment plug-ins46. These results revealed that additional nonlinear registration was required in order to compensate for distortions likely caused by section compression during cutting and sample charging during imaging. While the state-of-the-art elastic registration method47 also provided in Fiji45 as a TrakEM2 alignment plug-in achieved excellent local registration, we experienced difficulty—at least without modification to the existing implementation—in achieving an anatomically consistent result that preserved the overall larval zebrafish structure, largely due to struggles with constraining region of interest drift across magnification changes and correcting for shearing caused by sectioning. We also determined that the similar AlignTK9 method, which uses Pearson correlation as the matching criterion coupled with spring mesh relaxation to stabilize the global volume, was likely to suffer from similar problems and would require substantial additional data handling to operate on our multi-resolution dataset.
Therefore, in order to preserve the overall larval zebrafish structure and simultaneously achieve high-quality local registration, we turned to a new Signal Whitening Fourier Transform Image Registration (SWiFT-IR) method43, 48. Compared to conventional Pearson or phase correlation-based registration approaches, SWiFT-IR produces more robust image matching by using modulated Fourier transform amplitudes, adjusting its spatial frequency response during matching to maximize a signal-to-noise measure as its indicator of alignment quality. This alignment signal better handles variations in biological content and typical data distortions. Additionally, SWiFT-IR achieves higher precision in block matching as a result of the signal whitening, improves computational speeds with the computational complexity advantages of fast-Fourier transforms, and reduces iterative convergence from thousands to dozens of steps. Together, these capabilities enable a model-driven alignment in place of the usual approach of comparing and aligning a given section to a pre-selected number of adjacent sections.
The SWiFT-IR model we used consisted of an estimate of local aligned volume content formed by a windowed average, typically spanning ~6 µm along the axis orthogonal to the sectioning plane (z, anterior-posterior). Damaged regions, in particular partial sections, were removed from the model to avoid adversely influencing alignment results. This model then served as a registration template, where raw images were matched to the current model rather than nearby sections. Alignment proceeded in an iterative fashion starting at 758.8×758.8×60 nm3vx−1 (section overviews) and progressing incrementally to 56.4×56.4×60 nm3vx−1 for most regions outside the brain and 18.8×18.8×60 nm3vx−1 for most regions inside.
At each resolution, source images were iteratively aligned to the current model until no further significant alignment gain could be achieved, as indicated by the SWiFT-IR signal-to-noise figure of merit. The model was then transferred to higher resolution data by applying the current warpings to source data for that scale. Iterative model refinement then continued at this subsequent level. Although most computations were locally affine, residual nonlinear deformations, particularly at the highest resolutions, were represented by a triangulation mesh that deformably mapped raw data onto the model volume.
Importantly, access to the lowest resolution section overview data for each section permitted us to build an initial model that constrained subsequent registration steps to the overall larval zebrafish structure. Although their resolution and signal quality were intentionally low in favour of rapid acquisition, the fact that overviews were quickly captured with the same microscope settings and included support tissue provided key constraints for model refinement that resulted in a more accurate global result.
More specifically, the 17,963-section overview image volume was processed using SWiFT-IR to produce an initial model at 564×564×600 nm3vx−1. Although the lowest resolution section overview images were each captured at 758.8×758.8×60 nm3vx−1, the relative oversampling orthogonal to the sectioning plane enabled a geometrically accurate model at 564×564×600 nm3vx−1. This initial model was then cropped and warped using SWiFT-IR–driven matching across the midline axis to remove cutting compression, rotations, and other systematic variations in the specimen pose. The 16,000-section 56.4×56.4×60 nm3vx−1 volume was next downsampled to 564×564×600 nm3vx−1 and aligned to the initial overview model, resulting in an improved model. The matching and remodeling process was iterated at this scale until there was no further improvement in SWiFT-IR match quality. The final model at this scale was then expanded to 282×282×300 nm3vx−1 and similarly aligned in an iterative fashion. This model volume (~6 Gvx, 1600×1400×2667 vx) was convenient for rapid viewing to identify and manually correct defects and refine the pose. Further scales at 169.2×169.2×180 nm3vx−1 and 56.4×56.4×60 nm3vx−1 were similarly processed by successively expanding the model and aligning until no significant improvement in the figure of merit was reached. The 12,546-section highest resolution 18.8×18.8×60 nm3vx−1 image set was then registered using the final 56.4×56.4×60 nm3vx−1 volume as its model.
Image intensity was next adjusted across sections to achieve a consistent background level to match the average over a tissue-free region defined by a 256×256 px2 area. Many images were acquired at 16-bit depth and were converted in this process to 8-bit depth. The target background level was mapped to intensity 250, which left headroom for bright pixels while keeping tissue of interest from saturating. Next, a linear intensity fit between the background and a second level, typically the average grey level of a continuous trajectory region on the right side of the brain, was made to adjust the intensity values for each section.
Correspondence across light and ssEM datasets
Correspondence of individual neurons or functional reference atlas regions across imaging modalities was achieved with landmark-based 3-D thin-plate spline warping of each fluorescence dataset to the ssEM dataset using BigWarp49.
For matching in vivo two-photon laser-scanning microscopy data from the same specimen, we primarily chose landmarks consisting of distinctive arrangements of low-fluorescence regions where GCaMP5G was excluded and could be easily matched to similar patterns of nuclei in the ssEM dataset. This process was difficult in regions with low fluorescence signal (Extended Data Fig. 7e), where many cells were packed closely together (Extended Data Fig. 7f), and at locations where new neurons were likely added between light microscopy and preparation for ssEM (Extended Data Fig. 7g). In the future, improving the light-level data with specific labelling of all nuclei and faster light-based imaging approaches should improve the ease and accuracy of matching neuron identity.
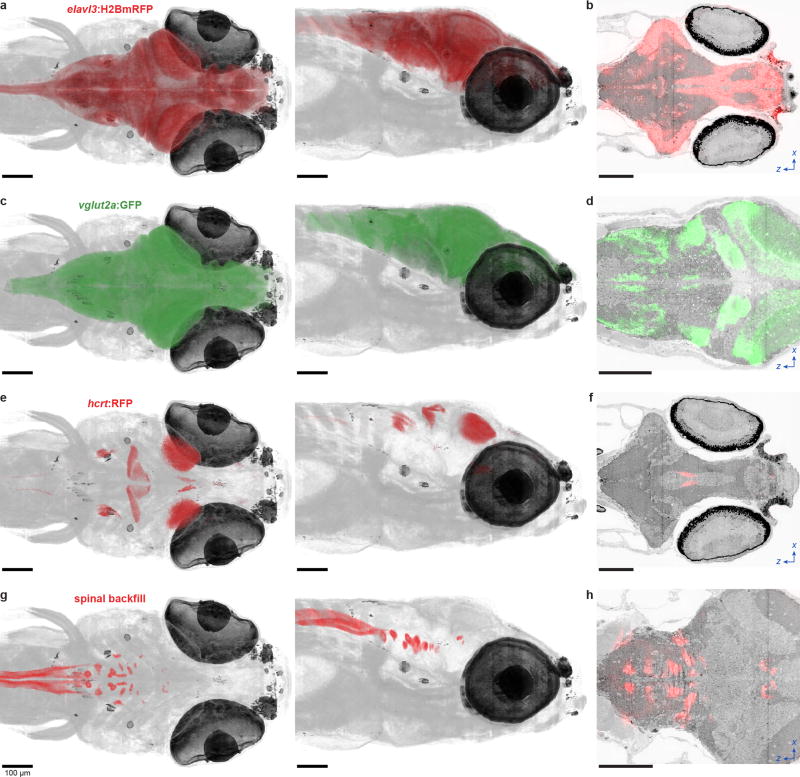
Two functional reference atlases with many separate labels were also registered to the ssEM dataset. For matching the Z-Brain atlas50, we chose landmarks based on identifiable structures in the Z-Brain averaged elavl3:H2B-RFP or anti-tERK fluorescence image stacks that were also observed in the ssEM dataset. These structures primarily consisted of region boundaries, known clusters of neurons, midline points, ganglia, and the brain outline. The same Z-Brain landmarks were used for transforming a version51 of the Zebrafish Brain Browser52 that was previously registered into the Z-Brain atlas.
Image annotation and neuron reconstruction
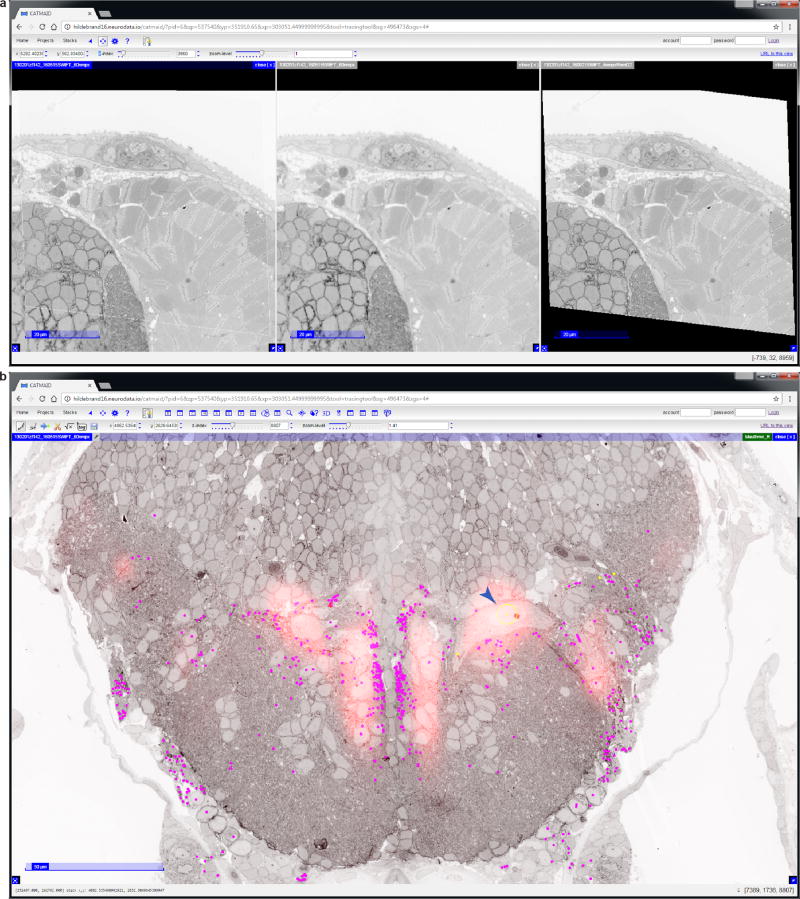
Reconstructions across multi-resolution ssEM image volumes profits from being able to simultaneously access and view separate but co-registered datasets. Without this, some of the time benefits of our imaging approach would be offset by the need to register and track each structure across volumes that span both low-resolution, large fields of view and high-resolution, specific regions of interest. With this in mind, we added a feature to the Collaborative Annotation Toolkit for Massive Amounts of Image Data (CATMAID) neuronal circuit mapping software53, 54 to overlay and combine image stacks acquired with varying resolutions in a single viewer (Extended Data Fig. 6). This is made possible by rendering using WebGL. Additionally, this new feature combines stacks via a configurable overlay order, introduces blending operations for each overlaid stack, and enables programmatic shaders for dynamic image processing. When overlaid stacks resolutions differ, the nearest available zoom level for each stack is interpolated. Missing data regions can be omitted or rendered with interpolation. To account for the increase in data storage and bandwidth when viewing multiple image stacks, the CATMAID image data hierarchy was also extended with a shared graphics card memory cache of image tiles using a least-recently-used replacement policy. All additions and modifications to the CATMAID software are now incorporated into the main open-source release.
Manual reconstruction was conducted using our modified CATMAID by placing nodes near the centre of each neuronal structure on every section in which it could be clearly identified. This led to a wire-frame model for each annotated structure. Starting points for reconstruction (“seeds”) of myelinated processes were manually identified by searching for profiles surrounded by the characteristic thick, densely stained outline associated with staining of the myelin sheath55 (Fig. 1e,g,i). The search protocol required viewing all tissue on a given section from the upper-left corner to lower-right at the highest available resolution. To obtain seeds for projectome reconstruction, searching was repeated every 50 sections throughout all 16,000 sections acquired at or higher than 56.4×56.4×60 nm3vx−1. Many annotations were produced in an affine-only alignment space before being mapped into the final SWiFT-IR alignment space. The reconstructions reported here represent ~450 days of human annotation.
For visualization and reported length measurements, each mapped wire-frame was smoothed using custom python-based implementation of a Kalman smoothing algorithm on a space defined by manually annotated points within unique segments. The initial state variables for smoothing were derived by an optimization of point-to-line distance to connected reconstruction segments. Other variables were tuned with the Estimation Maximization algorithm of the pykalman library to compensate for a lack of human input where data was unavailable due to lost or partial sections. Because the final image alignment was of good quality, smoothing in this manner should produce a slight underestimate in reported reconstruction path lengths.
Neurons with known projection patterns or identities were named in the CATMAID database. For example, the reconstruction of a neuron innervating the right anterior macula (utricle) might be named as “Ear_AnteriorMacula_R_01”, while an identified neuron such as the left Mauthner neuron was named “Mauthner_L”. Two identifiable left-right neuron pairs belonged to the “MeM” class, which emanates from the nucleus of the medial longitudinal fasciculus (nucMLF). On each side, these were differentiated into dorsal (MeMd) and ventral (MeMv) subclasses based on consistent soma positioning.
Visualization
Image volumes and reconstructions were primarily visualized using Vivaldi56, a domain-specific language for rendering and processing on distributed systems, because it provides access to the parallel computing power of multi-GPU systems with language syntax similar to python.
For volume visualizations, we used a direct volume rendering ray-casting technique in which an orthogonal or perspective iterator was marched along a viewing ray while sampled voxel colours were accumulated using an alpha compositing algorithm. We screened out regions containing only support tissue during rendering with labelled volumes constructed by interpolating between manually produced masks indicating which image voxels belong to each separate tissue region. In cases where separate image volumes of the same region were rendered together (e.g., ssEM and fluorescence combined), direct volume rendering was performed by combining front-to-back colour and alpha compositions formed from the different transfer function belonging to each image volume.
For volume visualizations including reconstructions, direct volume rendering of image data was combined with streamline rendering of reconstructions using two different techniques. The first combined an OpenGL framebuffer with the Vivaldi volume rendering. In this case, each streamline was rendered using OpenGL as a tube into an off-screen buffer (i.e., Framebuffer Object). Vivaldi then compared the resulting render and depth buffers to perform direct volume rendering of only the image data above the streamline depth value. This made it possible to ignore image voxels obscured by streamlines, which were treated as opaque. The second technique involved generating a complete streamline volume by 3-D rasterization. This streamline volume was then combined with the image volume for direct volume rendering. The former technique is faster and can cope with dynamic streamline changes, but the latter was found to yield better overall rendering quality. Visualizations of reconstructions without the image volume context were rendered either in the CATMAID 3-D WebGL viewer or plotted in MATLAB. When reconstructions are shown without specific labelling, colours were assigned randomly from a custom palette.
Reference plane (e.g., horizontal, sagittal, and section) images were rendered with Vivaldi by detecting the zero-crossing of each viewing ray and the plane. Support for viewing opaque data views in some spatial regions alongside the semi-transparent volume visualization views in other regions was introduced as a new Vivaldi function, clipping_plane. Similarly, contour (nonplanar) reslice support was developed to illustrate a flattened view along a specific reconstruction path consisting of vertical line segments extracted from the image volume.
For many cases, the size of the volume being rendered was larger than available memory. In order to support out-of-core processing, we developed and integrated into Vivaldi a slice-based streaming computing framework using the Hadoop distributed file system (HDFS) that will be reported elsewhere.
Symmetry analyses
Initial observations of apparent myelinated axon symmetry were found during visual inspection (Fig. 3; Supplementary Videos 8–9). To quantitatively assess the extent of symmetry, we developed a 3-D symmetry plane fitting method and two symmetry analyses: one that produces a cost associated with the 3-D shape and position similarity between reconstructed structures and another that compares the relative 2-D (cross-sectional) positioning of two identified neuron axons on one side with that for the contralateral axons with the same identities Only the longest reconstructed path from the soma through the myelinated axon projection was considered in plane fitting and symmetry analyses. Dendrites or short axonal branches were ignored. Each resulting reconstruction path (skeleton) was represented as an ordered list of nodes (points) taken directly from manual reconstructions. Sidedness (left or right) was determined by soma position.
The new 3-D symmetry plane fitting and 3-D symmetry comparison analyses approaches were described elsewhere57. The symmetry plane fitting, in brief, involves choosing an approximate symmetry plane, reflecting the complete set of points belonging to the reconstruction subset of interest with respect to this plane, registering the original and reflected point clouds with an iterative closest point algorithm, and inferring the optimal symmetry plane from the reflection and registration mappings. The subset of reconstructions from which this plane fitting was performed consisted entirely of identified neurons whose axon projections formed part of the ~30µm-diameter medial longitudinal fasciculus (MLF), recognized with the help of refs. 29, 58.
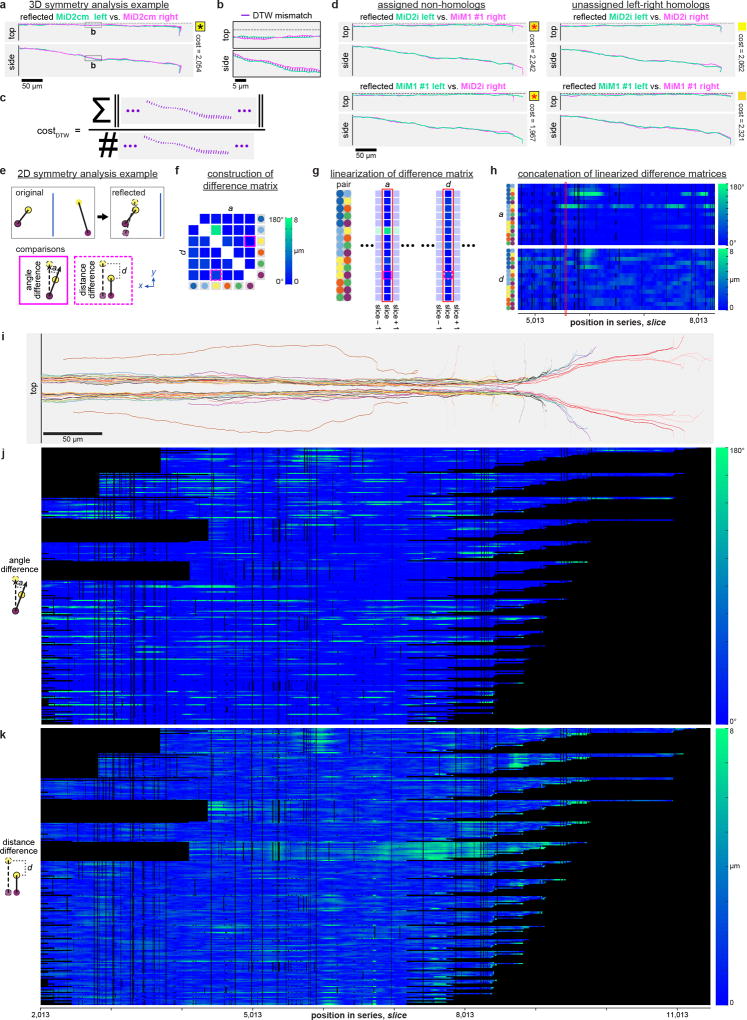
The 3-D symmetry comparison for each template reconstruction on one side, in brief, involved reflecting all contralateral skeletons and computing a matching cost via dynamic time warping (DTW) between the template and each reflected skeleton. The reconstruction subset analysed in this fashion was restricted to identified neuron classes with 1-2 members per side whose axons formed part of the MLF. For our purposes, the DTW cost was taken as the sum of the Euclidian distances between all matched points normalized to the number of matched point pairs (Extended Data Fig. 9a–c). The DTW gap cost parameter for matching a point in one sequence with a gap in another was set to zero because our data was sampled at a nearly constant rate and we sought the optimal subsequence match even in cases where one is shorter than or offset with respect to the other. To compensate for unmatched regions (i.e., overhangs), the DTW cost was then multiplied by a penalty factor proportional to the sequences lengths remaining unmatched (total length divided by matched length). Comparing each reconstruction on one side to all reconstructions from the opposite side formed a cost matrix (Fig. 4b) from which an optimal pairwise assignment could be determined without any bias introduced from the previously determined identities. The Munkres algorithm59 was then used to compute a globally optimal pairwise assignment.
We next sought to compare the relative 2-D positioning for each set of two axons on one side with the contralateral set having the same identities. The reconstruction subset analysed in this fashion was restricted either to the Mauthner cell and nucMLF neurons (Fig. 4e–g) or the larger set of 44 identified reticulospinal neurons (Extended Data Fig. 9i–k).
To start, we compensated for a small angle offset in the sectioning plane relative to the true transverse plane by projecting the point coordinates of reconstructions such that the previously computed symmetry plane became the plane x = 0. Given the transverse planes Z0, Z1, and a projected skeleton S containing points s = (sx, sy, sz), we let SZ0,Z1 = {s ∈ S : Z0 ≤ sZ < Z1}. That is, SZ0,Z1 was taken as the subset of points from S whose coordinates sZ are contained in the interval [Z0, Z1). We refer to the subset of ℝ3 bounded by Z ∈ [Z0, Z1) as the slice [Z0, Z1). For each slice [Z0, Z1) and skeleton S, we defined 〈SZ0, Z1〉 as the mean of the elements in SZ0, Z1. This mean was then taken as representative of the skeleton S in slice [Z0, Z1) for analysis and plotting. Note that all analysis and plotting presented in static form was based on a slice thickness corresponding to a single section (~60 nm), where each slice consisted simply of adjacent sections. Larger slice sizes were used for dynamic presentation (Supplementary Video 10) in order to reduce video duration and size.
For comparing a set of two axons with its contralateral counterpart, we then took s1, …, sn to be the set of representative points in a fixed slice for skeletons S1, …, Sn and took t1, …, tn to be the representative points (for the same slice) of the respective skeletons T1, …, Tn that were previously matched to S1, …, Sn by the Munkres algorithm assignment after 3-D symmetry analysis.
To quantify the degree of similarity, we devised two measures (Extended Data Fig. 9e). The first, termed the angle difference, ai,j, between a set of two axons and their contralateral counterparts, was defined as:
The second, termed the distance difference, di,j, between a set of two axons and their contralateral counterparts, was defined as:
where i, j were skeleton indices, was the reflections of {ti} with respect to the computed plane of symmetry, and M is the maximum of across all axon sets and all slices. Note that ai,j and di,j were normalized such that they could vary from 0 (no difference, 0° or 0 µm) to 1 (maximum difference, 180° or ~8 µm). Further, when the points si and sj were perfectly symmetric with respect to points ti and tj, then ai,j = 0 and di,j = 0.
To visualize this quantification, a difference matrix, D, was generated for each slice such that D(i,j) = ai,j if j > i and D(i,j) = di,j if j < i (Fig. 4f; Extended Data Fig. 9f; Supplementary Video 10). Calculating the variance for each element in D across all slices showed which axon sets deviated most with respect to the reflection of their contralateral counterparts (Fig. 4k). Heatmaps of the vectorised upper (j > i) and lower (j < i) triangles of D across slices additionally revealed locations with differences between axon sets and their contralateral counterparts (Fig. 4h–i; Extended Data Fig. 9f–h; Supplementary Video 10). Plotting the sum of all ai,j and di,j values for a given slice further illustrated where differences were present across the subset (Fig. 4j). Finally, the same analysis was performed after artificially swapping the identities (assignment) of the two axon reconstructions with the lowest 3-D symmetry analysis costs (MeLc and Mauthner) to provide a basis for comparison (Fig. 4j).
Code availability
Custom software tools generated for data handling, visualization, and analysis are publicly available (http://zebrafish.link/hildebrand16/code). Our modifications to CATMAID53, 54 software are included in the main open-source release (http://github.com/catmaid/catmaid). More information on SWiFT-IR alignment software is publicly available (http://www.mmbios.org/swift-ir-home).
Data availability
All aligned ssEM data, reconstructions, transformed functional reference atlases, and an introductory guide are publicly available (http://zebrafish.link/hildebrand16). Image data is served as a collection of 8-bit 1024×1024 px2 PNG images with an optional tRNS value of 255 specified to enable transparency. The original resolution for each image stack was down-sampled multiple times to create a resolution hierarchy that provides a smooth visualization experience, where each level in the hierarchy corresponds to an image that is half the size as in the previous level. The entire aligned image dataset requires ~2.7 TB of disk space as compressed PNG images (607 GB for 56.4×56.4×60 nm3vx−1 ssEM data, 1,824 GB for 18.8×18.8×60 nm3vx−1 ssEM data, 355 GB for 4.0×4.0×60 nm3vx−1 ssEM of dorsal neuromasts, 1 GB for 600×600×1200 nm3vx−1 Z-Brain data, and 3 GB for 600×600×1200 nm3vx−1 Zebrafish Brain Browser data). Data and reconstructions are served to end users via Amazon Web Services (AWS), with an instance of our modified CATMAID53, 54 software deployed on the Elastic Compute Cloud (EC2) that points to static images hosted by the Simple Storage Service (S3) built-in web server.
Extended Data
Extended Data Figure 1. Preparing larval zebrafish brain tissue for ssEM.
a, Immersion of intact specimens into tissue processing solutions resulted in poor preservation of brain ultrastructure due to membranes (arrowheads). b–c, Dissecting away the skin and membranes allowed solutions to diffuse into the brain, resulting in improved preservation. To minimize damage, dissections were initiated by puncturing the rhombencephalic ventricle dorsal to the hindbrain with a sharpened tungsten needle (red cross). Small anterior-directed incisions along the midline were then made as close to the surface as possible until the brain up to the anterior optic tectum was exposed (red dashed line). d–f, Following dissection and aldehyde fixation (d), samples were post-fixed with a reduced osmium solution (e) and stained with uranyl acetate (f). g–h, Processed specimens were then dehydrated with acetonitrile, infiltrated with a low-viscosity resin, mounted in a micromachined pre-cast resin mould to orient the sample for transverse sectioning (g), and surrounded by support tissue that stabilized sectioning (h). i, Representative ultrastructure acquired as a transmission electron micrograph from a section through the optic tectum of an early dissection test specimen. Scale bars: g–h, 1 mm; d–f, 500 µm; b, 100 µm; a,c,i, 1 µm.
Extended Data Figure 2. Serial sectioning and ultrathin section library assembly.
a, Serial sections of resin-embedded samples were picked up with an automated tape-collecting ultramicrotome modified for compatibility with larger reels containing enough tape to accommodate tens of thousands of sections. b–c, Direct-to-tape sectioning resulted in consistent section spacing and orientation. Just as a section left the diamond knife (blue), it was caught by the tape. d, After sectioning, the tape was divided onto silicon wafers that functioned as a stage in a scanning electron microscope and formed an ultrathin section library. For a series containing all of a 5.5 dpf larval zebrafish brain, ~68 m of tape was divided onto 80 wafers (~227 sections per wafer). e, Wafer images were used as a coarse guide for targeting electron microscopic imaging. Fiducial markers (copper circles) further provided a reference for a per-wafer coordinate system, enabling storage of the position associated with each section for multiple rounds of re-imaging at varying resolutions as needed. f, 758.8×758.8×60 nm3vx−1 overview micrographs were acquired for each section to ascertain sectioning reliability and determine the extents of the ultrathin section library. Scale boxes: a, 5×5×5 cm3; b, 1×1×1 cm3; c, 1×1×1 mm3. Scale bars: e, 1 cm; f, 250 µm.
Extended Data Figure 3. Serial sectioning through the anterior quarter of a 5.5 dpf larval zebrafish.
a, Overview micrographs from a collection of 17,963 × ~60 nm-thick transverse serial sections that span 1.09 mm through a 5.5 dpf larval zebrafish. Embedding the larval zebrafish (green dashed circle) in support tissue stabilized sectioning. Dashed lines indicate cropping. b, Volume rendering of aligned overview micrographs. Magenta and yellow planes correspond to reslice planes in c. Green plane corresponds to section outlined in a. c, Reslice planes through an aligned overview image volume reveal structures contained within the series and illustrate the sectioning plane relative to the horizontal (upper) and sagittal (lower) body planes. This series spans from myotome 7 through the anterior larval zebrafish, encompassing part of the spinal cord and the entire brain. Dashed lines indicate where reslice planes intersect. d, Histograms of lost, partial (missing any larval zebrafish tissue), or adjacent (lost-partial or partial-partial) events per bin of 50 sections. In total, 244 (1.34%) sections were lost and 283 (1.55%) were partial for this series. No two adjacent sections were lost. Inset histograms expand the shaded regions to provide a detailed view of sectioning reliability with bin sizes of 5 sections. Dashed lines indicate the number of lost sections if uniformly distributed throughout the series. Scale box: b, 250×250×250 µm3. Scale bars: a,c, 250 µm.
Extended Data Figure 4. Serial sectioning through most of a 7 dpf larval zebrafish brain.
a, Overview micrographs from a collection of 15,046 × ~50 nm-thick transverse serial sections that span 0.75 mm through a 7 dpf larval zebrafish. Surrounding part of the larval zebrafish (green dashed circle) with support tissue stabilized sectioning. Dashed lines indicate cropping. b, Volume rendering of aligned overview micrographs. Magenta and yellow planes correspond to reslice planes in c. Green plane corresponds to section outlined in a. c, Reslice planes through an aligned overview image volume reveal structures contained within the series and illustrate the sectioning plane relative to the horizontal (upper) and sagittal (lower) body planes. This series spans from posterior hindbrain through the anterior larval zebrafish, encompassing most of the brain. Dashed lines indicate where reslice planes intersect. d, Histograms depicting the number of lost, partial (missing any larval zebrafish tissue), or adjacent (lost-partial or partial-partial) events per bin of 50 sections throughout the series. In total, 6 (0.04%) sections were lost and 25 (0.17%) were partial for this series. No two adjacent sections were lost. Scale box: b, 250×250×250 µm3. Scale bars: a,c, 250 µm.
Extended Data Figure 5. Description and categorization of partial sections.
Collected sections were deemed partial if any larval zebrafish tissue appeared to be missing. In total, 283 sections of 18,207 attempted were classified as partial. Those imaged at 56.4×56.4×60 nm3vx−1 were further categorized into minor, moderate, or severe subclasses. In minor cases, only tissue outside the brain was absent. Moderate cases lacked less than half of the brain. Severe cases were missing more than or equal to half of the brain. Note that it is possible that apparently missing tissue is contained in a slightly thicker adjacent section, in which case it is not entirely lost and may be accessible with different imaging strategies. a–c, Posterior examples of partial sections from each category. Line and arrow indicate the orientation and direction of sectioning. e–f, Expanded views of brain tissue from the sections depicted in a–c. Red dashed contours define the brain outline expected from an adjacent section. g–h, Anterior examples of partial sections from each category. j, Number of sections in each category for the 208 partial sections contained within the 16,000 imaged at 56.4×56.4×60 nm3vx−1. Scale bars: a–i, 50 µm.
Extended Data Figure 6. Software modifications for co-registered ssEM datasets and reference atlas overlays.
Reconstructing neuronal structures across multi-resolution ssEM image volumes acquired from the same specimen profits from being able to simultaneously access and view separate but co-registered datasets. Without this, some time benefits of our imaging approach would be offset by needing to register and track structures across volumes that span both low-resolution, large fields of view and high-resolution, specific regions of interest. With this in mind, we added a feature to the Collaborative Annotation Toolkit for Massive Amounts of Image Data (CATMAID) neuronal circuit mapping software to overlay and combine image stacks acquired with varying resolutions in a single viewer. This feature is now available in the main open-source release. a, Images from two co-registered ssEM datasets acquired at different resolutions from the same section. The combined view (left) overlays 4.0×4.0×60 nm3vx−1 data (right) onto 56.4×56.4×60 nm3vx−1 data (middle). b, Integrated view of co-registered ssEM datasets overlaid with manual reconstructions (coloured dots) and the spinal backfill label (red) from the Z-Brain reference atlas. As expected, spinal backfill fluorescence is visible directly over the Mauthner cell body (arrowhead).
Extended Data Figure 7. Neuron identity correspondence across whole-brain in vivo light and post hoc ssEM datasets.
Co-registration of in vivo light microscopy and post hoc ssEM datasets can be accomplished with thin-plate spline coordinate transformations guided by manually identified landmarks. a, Volume renderings of the ssEM dataset (upper), warped in vivo two-photon imaging of elavl3:GCaMP5G fluorescence from the same specimen (middle), and a merge (lower). Reslice planes shown in b are indicated by magenta planes. b, Near-horizontal reslice planes from the ssEM volume (upper) and the warped in vivo light microscopy image volume (lower) show gross correspondence throughout the brain. c–d, Magnified views reveal single-neuron matches in the optic tectum (c) and telencephalon (d). e–g, This exercise revealed the imaging conditions, labelling density, and structural tissue features necessary for reliable matching across imaging modalities. This process was difficult in regions (enclosed by dotted contours) where fluorescence signal was low (e), where many cells were packed closely together (f), and where new neurons were likely added in between light microscopy and preparation for ssEM (g). Improving the light-level data with specific labelling of all nuclei and faster light-sheet or other imaging approaches should greatly improve the ease and accuracy of matching. This ability to assign neuron identity across imaging modalities demonstrates proof-of-principle for the integration of rich neuronal activity maps with subsequent whole-brain structural examination of functionally characterized neurons and their networks. Arrowheads in c indicate the same structures as observed in each modality. Elongated structures are blood vessels. Scale box: a, 100×100×100 µm3. Scale bars: b, 100 µm; c–g, 10 µm.
Extended Data Figure 8. Registration of functional reference atlases to the ssEM dataset.
Cross-modal registration of the Z-Brain atlas and the Zebrafish Brain Browser allows for characterization of specific domains within the ssEM dataset defined, for example, by genetically restricted labels (a–f) or retrograde labelling (g–h). a,c,e,g, Dorsal (left) and lateral (right) views through dual-volume renderings of the ssEM dataset and Z-Brain atlas data from a elavl3:H2BmRFP transgenic line (a), vglut2a:GFP transgenic line (c), hcrt:RFP transgenic line (e), and spinal backfill retrograde labelling (g). b,d,f,h, Z-Brain atlas fluorescence signal for the same labels overlaid onto horizontal reslice planes through the ssEM dataset. As expected, the Mauthner cell and nucleus of the medial longitudinal fasciculus (nucMLF) neuron positions overlap in the spinal backfill label and ssEM reslice (h). Scale bars: a–h, 100 µm.
Extended Data Figure 9. Symmetry analysis descriptions and examples.
a–c, Analysis of symmetry in 3-D position and shape for one example left-right neuron pair with axons in the medial longitudinal fasciculus (MLF). a, In the comparison between the left MiD2cm axon and its right homolog, the left side was first reflected across the plane of symmetry (dotted line). b, The comparison cost value representing the similarity in position and shape of the two axons was then computed using a dynamic time warping sequence matching approach. c, Each cost value was calculated as the sum of the Euclidian distances between points matched by a dynamic time warping algorithm, normalized by the number of matches, and finally multiplied by a penalty factor proportional to the unmatched sequence lengths (total length divided by matched length; not illustrated). d, In a globally optimal pairwise assignment for a selection of 22 identified left-right MLF homologs, one pair of myelinated axon reconstructions were not assigned to their contralateral homologs (see Fig. 4b, red asterisks). Upon investigating this unexpected assignment further, it was clear that similar pairwise comparison costs resulted for the assigned non-homologs (left column) and unassigned left-right homologs (right column). However, the combined non-homolog cost was slightly lower than the combined left-right homolog cost (by 174). Because the global assignment sought to minimize the total cost summed over all pairwise comparisons, this difference likely explains why non-homologs were grouped over left-right homologs. e–h, Analysis of symmetry in 2-D neighbour relations. e, The vector between each pair of left axons was compared to the reflected vector between the right axons having the same identities. Two metrics were then calculated to relate the original and reflected pairs: the angle difference (measured as the dot product between the vectors) and the distance difference (measured as the difference between the lengths of the vectors). f, For each slice, a difference matrix was constructed from the angle and distance difference values for all pairwise combinations. g–h, Linearizing difference matrices (g) and then concatenating them (h) enables visualization of changes in relative positional arrangements across slices. i–k, Extension of 2-D symmetry analysis to the 22 identified MLF pairs. i, Examined myelinated axon reconstructions. j–k, Trend toward mirror-symmetric relative positional arrangements over long MLF stretches apparent by linearizing angle (j) and distance (k) differences. Neighbour relations for many pairs returned to symmetric state despite local perturbations, while others showed more variability. Black indicates insufficient data for comparing the given pair. Scale bars: a,d,i, 50 µm; b, 5 µm.
Extended Data Figure 10. Examples of non-neuronal tissues contained within the dataset.
In addition to capturing the whole brain, the 56.4×56.4×60 nm3vx−1 image volume contains the anterior quarter of a larval zebrafish, thus serving as a high-resolution atlas for several other tissues and structures. Three selected sections (a,h,m) are accompanied by example images (b–g,i–l,n–o) to illustrate the variety of tissues and structures contained within the dataset. Scale bars: a,h,m, 50 µm; i–l,n–o, 10 µm; b–g, 5 µm.
Acknowledgments
We thank D.D. Bock and K.-H. Huang for preliminary studies; L.-H. Ma, M.B. Ahrens, and D. Schoppik for dissection help; E. Raviola, H.S. Kim, J.A. Buchanan, E.J. Benecchi, and S. Ito for histology guidance; K.J. Hayworth, J.L. Morgan, N. Kasthuri, and R. Schalek for EM advice; T. Kazimiers and J.A. Bogovic for software assistance the Harvard CBS Neuroengineering Core; B.L. Shanny, A.M. Roberson, M.A. Afifi, F. Gao, A.D. Wong, F. Camacho Garcia, C.S. Elkhill, T.J. Cawley, R.J. Plummer, K.M. Runci, A. Haddad, P.E. Lewis, I. Odstrcil, A.H. Cohen, and P.I. Petkova for reconstructions; and R.I. Wilson and J.R. Sanes for valuable input. Support provided by the NIH through NINDS to F.E. (DP1NS082121, RC2NS069407) and W.-C.A.L. (R21NS085320) and the Harvard CBS Neuroengineering Core (P30NS062685), through NIGMS to MMBioS via the Pittsburgh Supercomputing Center (P41GM103712); by the DARPA SIMPLEX program through SPAWAR to R.B. and J.T.V. (N66001-15-C-4041); by the Korea NRF through MSIP (NRF-2015M3A9A7029725) and MOE (NRF-2014R1A1A2058773) to W.-K.J.; and by the NIH (T32MH20017, T32HL007901) and the NSF (IIA-EAPSI-1317014) to D.G.C.H.
Footnotes
Author Contributions
F.E. and D.G.C.H. designed experiments. R.P., D.G.C.H., and I.H.B. conducted light microscopy. D.G.C.H. prepared and sectioned samples. D.G.C.H. and G.S.P. completed ssEM. A.W.W., S.S., and D.G.C.H. aligned ssEM. D.G.C.H. and O.R. registered light and ssEM. R.M.T., B.J.G., and D.G.C.H. processed reconstructions. M.C. and D.G.C.H. analysed symmetry. W.C., T.M.Q., J.M., D.G.C.H., and W.-K.J. made visualizations. A.S.C. modified annotation software. A.B., K.L., R.B., and J.T.V. provided hosting. F.E., J.W.L., W.-C.A.L., and A.F.S. supplied resources. D.G.C.H., F.E., and J.W.L. wrote the manuscript.
The authors declare no competing financial interests.
Readers are welcome to comment on the online version of the paper.
References
- 1.Briggman KL, Bock DD. Volume electron microscopy for neuronal circuit reconstruction. Curr. Opin. Neurobiol. 2012;22:154–161. doi: 10.1016/j.conb.2011.10.022. [DOI] [PubMed] [Google Scholar]
- 2.Lichtman JW, Denk W. The big and the small: challenges of imaging the brain's circuits. Science. 2011;334:618–623. doi: 10.1126/science.1209168. [DOI] [PubMed] [Google Scholar]
- 3.White JG, Southgate E, Thomson JN, Brenner S. The structure of the nervous system of the nematode Caenorhabditis elegans. Phil. Trans. R Soc. Lond. B. 1986;314:1–340. doi: 10.1098/rstb.1986.0056. [DOI] [PubMed] [Google Scholar]
- 4.Jarrell TA, et al. The connectome of a decision-making neural network. Science. 2012;337:437–444. doi: 10.1126/science.1221762. [DOI] [PubMed] [Google Scholar]
- 5.Randel N, et al. Neuronal connectome of a sensory-motor circuit for visual navigation. eLife. 2014;3:e02730. doi: 10.7554/eLife.02730. [DOI] [PMC free article] [PubMed] [Google Scholar]
- 6.Ohyama T, et al. A multilevel multimodal circuit enhances action selection in Drosophila. Nature. 2015;520:633–639. doi: 10.1038/nature14297. [DOI] [PubMed] [Google Scholar]
- 7.Chalfie M, et al. The neural circuit for touch sensitivity in Caenorhabditis elegans. J. Neurosci. 1985;5:956–964. doi: 10.1523/JNEUROSCI.05-04-00956.1985. [DOI] [PMC free article] [PubMed] [Google Scholar]
- 8.Lu J, Tapia JC, White OL, Lichtman JW. The interscutularis muscle connectome. PLoS Biol. 2009;7 doi: 10.1371/journal.pbio.1000032. [DOI] [PMC free article] [PubMed] [Google Scholar]
- 9.Bock DD, et al. Network anatomy and in vivo physiology of visual cortical neurons. Nature. 2011;471:177–182. doi: 10.1038/nature09802. [DOI] [PMC free article] [PubMed] [Google Scholar]
- 10.Briggman KL, Helmstaedter M, Denk W. Wiring specificity in the direction-selectivity circuit of the retina. Nature. 2011;471:183–188. doi: 10.1038/nature09818. [DOI] [PubMed] [Google Scholar]
- 11.Lee W-CA, et al. Anatomy and function of an excitatory network in the visual cortex. Nature. 2016 doi: 10.1038/nature17192. [DOI] [PMC free article] [PubMed] [Google Scholar]
- 12.Mikula S, Denk W. High-resolution whole-brain staining for electron microscopic circuit reconstruction. Nat. Methods. 2015;12:541–546. doi: 10.1038/nmeth.3361. [DOI] [PubMed] [Google Scholar]
- 13.Sjöstrand FS. Ultrastructure of retinal rod synapses of the guinea pig eye as revealed by three-dimensional reconstructions from serial sections. J. Ultrastruct. Res. 1958;2:122–170. doi: 10.1016/s0022-5320(58)90050-9. [DOI] [PubMed] [Google Scholar]
- 14.Sterling P. Microcircuitry of the cat retina. Annu. Rev. Neurosci. 1983;6:149–185. doi: 10.1146/annurev.ne.06.030183.001053. [DOI] [PubMed] [Google Scholar]
- 15.Hamos JE, Van Horn SC, Raczkowski D, Sherman SM. Synaptic circuits involving an individual retinogeniculate axon in the cat. J. Comp. Neurol. 1987;259:165–192. doi: 10.1002/cne.902590202. [DOI] [PubMed] [Google Scholar]
- 16.Somogyi P, Tamás G, Lujan R, Buhl EH. Salient features of synaptic organisation in the cerebral cortex. Brain Res. Brain Res. Rev. 1998;26:113–135. doi: 10.1016/s0165-0173(97)00061-1. [DOI] [PubMed] [Google Scholar]
- 17.Shepherd GMG, Harris KM. Three-dimensional structure and composition of CA3→CA1 axons in rat hippocampal slices: implications for presynaptic connectivity and compartmentalization. J. Neurosci. 1998;18:8300–8310. doi: 10.1523/JNEUROSCI.18-20-08300.1998. [DOI] [PMC free article] [PubMed] [Google Scholar]
- 18.Mishchenko Y, et al. Ultrastructural analysis of hippocampal neuropil from the connectomics perspective. Neuron. 2010;67:1009–1020. doi: 10.1016/j.neuron.2010.08.014. [DOI] [PMC free article] [PubMed] [Google Scholar]
- 19.da Costa NM, Fürsinger D, Martin KAC. The synaptic organization of the claustral projection to the cat's visual cortex. J. Neurosci. 2010;30:13166–13170. doi: 10.1523/JNEUROSCI.3122-10.2010. [DOI] [PMC free article] [PubMed] [Google Scholar]
- 20.Ahrens MB, Engert F. Large-scale imaging in small brains. Curr. Opin. Neurobiol. 2015;32:78–86. doi: 10.1016/j.conb.2015.01.007. [DOI] [PMC free article] [PubMed] [Google Scholar]
- 21.Friedrich RW, Jacobson GA, Zhu P. Circuit neuroscience in zebrafish. Curr. Biol. 2010;20:R371–R381. doi: 10.1016/j.cub.2010.02.039. [DOI] [PubMed] [Google Scholar]
- 22.Wanner AA, Genoud C, Masudi T, Siksou L, Friedrich RW. Dense EM-based reconstruction of the interglomerular projectome in the zebrafish olfactory bulb. Nat. Neurosci. 2016;19 doi: 10.1038/nn.4290. [DOI] [PubMed] [Google Scholar]
- 23.Fetcho JR, Higashijima S-i, McLean DL. Zebrafish and motor control over the last decade. Brain Res. Rev. 2008;57:86–93. doi: 10.1016/j.brainresrev.2007.06.018. [DOI] [PMC free article] [PubMed] [Google Scholar]
- 24.Bianco IH, Kampff AR, Engert F. Prey capture behavior evoked by simple visual stimuli in larval zebrafish. Front. Syst. Neurosci. 2011;5:101. doi: 10.3389/fnsys.2011.00101. [DOI] [PMC free article] [PubMed] [Google Scholar]
- 25.Dunn TW, et al. Neural circuits underlying visually evoked escapes in larval zebrafish. Neuron. 2016;89 doi: 10.1016/j.neuron.2015.12.021. [DOI] [PMC free article] [PubMed] [Google Scholar]
- 26.Hayworth KJ, et al. Imaging ATUM ultrathin section libraries with WaferMapper: a multi-scale approach to EM reconstruction of neural circuits. Front. Neural Circuits. 2014;8:68. doi: 10.3389/fncir.2014.00068. [DOI] [PMC free article] [PubMed] [Google Scholar]
- 27.Kasthuri N, et al. Saturated reconstruction of a volume of neocortex. Cell. 2015;162:648–661. doi: 10.1016/j.cell.2015.06.054. [DOI] [PubMed] [Google Scholar]
- 28.Oteiza P, Odstrcil I, Lauder G, Portugues R, Engert F. A novel mechanism for mechanosensory based rheotaxis in larval zebrafish. Nature. doi: 10.1038/nature23014. in press. [DOI] [PMC free article] [PubMed] [Google Scholar]
- 29.Metcalfe WK, Mendelson B, Kimmel CB. Segmental homologies among reticulospinal neurons in the hindbrain of the zebrafish larva. J. Comp. Neurol. 1986;251 doi: 10.1002/cne.902510202. [DOI] [PubMed] [Google Scholar]
- 30.Scholes JH. Nerve fibre topography in the retinal projection to the tectum. Nature. 1979;278 doi: 10.1038/278620a0. [DOI] [PubMed] [Google Scholar]
- 31.Brand M, Granato M, Nüsslein-Volhard C. In: Zebrafish: A Practical Approach. Nüsslein-Volhard C, Dahm R, editors. Oxford: 2002. pp. 7–37. Ch. 1. [Google Scholar]
- 32.Ahrens MB, Orger MB, Robson DN, Li JM, Keller PJ. Whole-brain functional imaging at cellular resolution using light-sheet microscopy. Nat. Methods. 2013;10:413–420. doi: 10.1038/nmeth.2434. [DOI] [PubMed] [Google Scholar]
- 33.Akerboom J, et al. Optimization of a GCaMP calcium indicator for neural activity imaging. J. Neurosci. 2012;32:13819–13840. doi: 10.1523/JNEUROSCI.2601-12.2012. [DOI] [PMC free article] [PubMed] [Google Scholar]
- 34.Lister JA, Robertson CP, Lepage T, Johnson SL, Raible DW. nacre encodes a zebrafish microphthalmia-related protein that regulates neural-crest-derived pigment cell fate. Development. 1999;126 doi: 10.1242/dev.126.17.3757. [DOI] [PubMed] [Google Scholar]
- 35.Portugues R, Feierstein CE, Engert F, Orger MB. Whole-brain activity maps reveal stereotyped, distributed networks for visuomotor behavior. Neuron. 2014;81:1328–1343. doi: 10.1016/j.neuron.2014.01.019. [DOI] [PMC free article] [PubMed] [Google Scholar]
- 36.Xiao T, Baier H. Lamina-specific axonal projections in the zebrafish tectum require the type IV collagen Dragnet. Nat. Neurosci. 2007;10:1529–1537. doi: 10.1038/nn2002. [DOI] [PubMed] [Google Scholar]
- 37.Ma L-H, Gilland E, Bass AH, Baker R. Ancestry of motor innervation to pectoral fin and forelimb. Nature Communications. 2010;1:49. doi: 10.1038/ncomms1045. [DOI] [PMC free article] [PubMed] [Google Scholar]
- 38.Turner MH, Ullmann JFP, Kay AR. A method for detecting molecular transport within the cerebral ventricles of live zebrafish (Danio rerio) larvae. J. Physiol. 2012;590:2233–2240. doi: 10.1113/jphysiol.2011.225896. [DOI] [PMC free article] [PubMed] [Google Scholar]
- 39.Mueller T, Wulliman MF. Atlas of early zebrafish brain development: a tool for molecular neurogenetics. 1. Elsevier; 2005. p. 183. [Google Scholar]
- 40.Luft JH. In: Advanced Techniques in Biological Electron Microscopy. Koehler JK, editor. Springer-Verlag; 1973. pp. 1–34. Ch. 1. [Google Scholar]
- 41.Hildebrand DGC. Whole-brain functional and structural examination in larval zebrafish. Harvard University; 2015. [Google Scholar]
- 42.Ma L-H, Punnamoottil B, Rinkwitz S, Baker R. Mosaic hoxb4a neuronal pleiotropism in zebrafish caudal hindbrain. PLoS ONE. 2009;4:e5944. doi: 10.1371/journal.pone.0005944. [DOI] [PMC free article] [PubMed] [Google Scholar]
- 43.Morgan JL, Berger DR, Wetzel AW, Lichtman JW. The fuzzy logic of network connectivity in mouse visual thalamus. Cell. 2016;165:192–206. doi: 10.1016/j.cell.2016.02.033. [DOI] [PMC free article] [PubMed] [Google Scholar]
- 44.Eberle AL, et al. High-resolution, high-throughput imaging with a multibeam scanning electron microscope. Journal of Microscopy. 2015;259:114–120. doi: 10.1111/jmi.12224. [DOI] [PMC free article] [PubMed] [Google Scholar]
- 45.Schindelin J, et al. Fiji: an open-source platform for biological-image analysis. Nat. Methods. 2012;9:676–682. doi: 10.1038/nmeth.2019. [DOI] [PMC free article] [PubMed] [Google Scholar]
- 46.Saalfeld S, Cardona A, Hartenstein V, Tomančák P. As-rigid-as-possible mosaicking and serial section registration of large ssTEM datasets. Bioinformatics. 2010;26:i57–i63. doi: 10.1093/bioinformatics/btq219. [DOI] [PMC free article] [PubMed] [Google Scholar]
- 47.Saalfeld S, Fetter R, Cardona A, Tomancak P. Elastic volume reconstruction from series of ultra-thin microscopy sections. Nat. Methods. 2012;9 doi: 10.1038/nmeth.2072. [DOI] [PubMed] [Google Scholar]
- 48.Wetzel AW, et al. Registering large volume serial-section electron microscopy image sets for neural circuit reconstruction using FFT signal whitening. Applied Imagery Pattern Recognition Workshop (AIPR) IEEE. 2016 in press. [Google Scholar]
- 49.Bogovic JA, Hanslovsky P, Wong A, Saalfeld S. Robust registration of calcium images by learned contrast synthesis; International Symposium on Biomedical Imaging (ISBI) IEEE 13th; 2016. pp. 1123–1126. [Google Scholar]
- 50.Randlett O, et al. Whole-brain activity mapping onto a zebrafish brain atlas. Nat. Methods. 2015;12:1039–1046. doi: 10.1038/nmeth.3581. [DOI] [PMC free article] [PubMed] [Google Scholar]
- 51.Marquart GD, Tabor KM, Brown M, Burgess A. High precision registration between zebrafish brain atlases using symmetric diffeomorphic normalization. bioRxiv. 2016;081000 doi: 10.1093/gigascience/gix056. [DOI] [PMC free article] [PubMed] [Google Scholar]
- 52.Marquart GD, et al. A 3D searchable database of transgenic zebrafish Gal4 and Cre lines for functional neuroanatomy studies. Front. Neural Circuits. 2015;9 doi: 10.3389/fncir.2015.00078. [DOI] [PMC free article] [PubMed] [Google Scholar]
- 53.Saalfeld S, Cardona A, Hartenstein V, Tomančák P. CATMAID: collaborative annotation toolkit for massive amounts of image data. Bioinformatics. 2009;25:1984–1986. doi: 10.1093/bioinformatics/btp266. [DOI] [PMC free article] [PubMed] [Google Scholar]
- 54.Schneider-Mizell CM, et al. Quantitative neuroanatomy for connectomics in Drosophila. eLife. 2016;5:e12059. doi: 10.7554/eLife.12059. [DOI] [PMC free article] [PubMed] [Google Scholar]
- 55.Peters A, Palay SL, Webster Hd. The fine structure of the nervous system: neurons and their supporting cells. Oxford. 1991 [Google Scholar]
- 56.Choi H, et al. Vivaldi: a domain-specific language for volume processing and visualization on distributed heterogeneous systems. IEEE Transactions on Visualization and Computer Graphics. 2014;20:2407–2416. doi: 10.1109/TVCG.2014.2346322. [DOI] [PubMed] [Google Scholar]
- 57.Cicconet M, Hildebrand DGC, Elliott HL. Finding mirror symmetry via registration. arXiv. 1611.05971 [cs.CV] [Google Scholar]
- 58.Kimmel CB, Powell SL, Metcalfe WK. Brain neurons which project to the spinal cord in young larvae of the zebrafish. J. Comp. Neurol. 1982;205:112–127. doi: 10.1002/cne.902050203. [DOI] [PubMed] [Google Scholar]
- 59.Munkres J. Algorithms for the assignment and transportation problems. Journal of the Society for Industrial and Applied Mathematics. 1957;5 [Google Scholar]
Associated Data
This section collects any data citations, data availability statements, or supplementary materials included in this article.
Data Availability Statement
All aligned ssEM data, reconstructions, transformed functional reference atlases, and an introductory guide are publicly available (http://zebrafish.link/hildebrand16). Image data is served as a collection of 8-bit 1024×1024 px2 PNG images with an optional tRNS value of 255 specified to enable transparency. The original resolution for each image stack was down-sampled multiple times to create a resolution hierarchy that provides a smooth visualization experience, where each level in the hierarchy corresponds to an image that is half the size as in the previous level. The entire aligned image dataset requires ~2.7 TB of disk space as compressed PNG images (607 GB for 56.4×56.4×60 nm3vx−1 ssEM data, 1,824 GB for 18.8×18.8×60 nm3vx−1 ssEM data, 355 GB for 4.0×4.0×60 nm3vx−1 ssEM of dorsal neuromasts, 1 GB for 600×600×1200 nm3vx−1 Z-Brain data, and 3 GB for 600×600×1200 nm3vx−1 Zebrafish Brain Browser data). Data and reconstructions are served to end users via Amazon Web Services (AWS), with an instance of our modified CATMAID53, 54 software deployed on the Elastic Compute Cloud (EC2) that points to static images hosted by the Simple Storage Service (S3) built-in web server.


