Significance
Diffuse large B-cell lymphoma (DLBCL) is the most common adult lymphoma, accounting for 37% of all non-Hodgkin lymphoma cases in the United States. Despite an approximate 50% cure rate, refractory or relapsed cases have a poor prognosis and require timely medical interventions. Therefore, accurate diagnostic methods play a pivotal role in managing DLBCL. 18F- fluorodeoxyglucose positron emission tomography ([18F]FDG-PET) imaging, the current standard imaging modality for diagnosing DLBCL, often fails to differentiate inflamed from malignant lymph nodes in patients with DLBCL. To address this urgent medical need, we have developed a targeted PET imaging method that accurately distinguishes malignancy from inflammation in the lymph nodes. Our targeted PET imaging approach could play an essential role in the clinical development of therapies that induce significant inflammation in DLBCL.
Keywords: PET/CT, PARP1, [18F]PARPi, diffuse large B-cell lymphoma, inflammation
Abstract
Diffuse large B-cell lymphoma (DLBCL) is the most common lymphoma in adults. DLBCL exhibits highly aggressive and systemic progression into multiple tissues in patients, particularly in lymph nodes. Whole-body 18F-fluodeoxyglucose positron emission tomography ([18F]FDG-PET) imaging has an essential role in diagnosing DLBCL in the clinic; however, [18F]FDG-PET often faces difficulty in differentiating malignant tissues from certain nonmalignant tissues with high glucose uptake. We have developed a PET imaging strategy for DLBCL that targets poly[ADP ribose] polymerase 1 (PARP1), the expression of which has been found to be much higher in DLBCL than in healthy tissues. In a syngeneic DLBCL mouse model, this PARP1-targeted PET imaging approach allowed us to discriminate between malignant and inflamed lymph nodes, whereas [18F]FDG-PET failed to do so. Our PARP1-targeted PET imaging approach may be an attractive addition to the current PET imaging strategy to differentiate inflammation from malignancy in DLBCL.
Diffuse large B-cell lymphoma (DLBCL) is the most common adult lymphoma, accounting for 37% of all cases of non-Hodgkin lymphoma in the United States (1). The current standard-of-care treatment is R-CHOP, consisting of a targeted antibody against CD20 (rituximab) and four chemotherapeutic drugs: cyclophosphamide, doxorubicin hydrochloride, vincristine sulfate, and prednisone. Although R-CHOP is curative in approximately 50% of patients with DLBCL, refractory or relapsed cases have a very poor prognosis and require timely medical interventions (2). Therefore, accurate and sensitive diagnostic methods play pivotal roles in improving the clinical outcome of DLBCL (3).
At early stages, DLBCL infiltrates lymphatic tissues, such as lymph nodes, spleen, and bone marrow, across the body; at advanced stages, DLBCL tends to metastasize to nonlymphatic tissues, including brain and spinal cord, as well as to many other tissues (4). To address the systemic nature of DLBCL, whole-body imaging techniques, such as positron emission tomography (PET), computed tomography (CT), and magnetic resonance imaging (MRI), were adopted to improve the diagnosis and disease staging of DLBCL (5). PET imaging is an important imaging modality for diagnosing DLBCL owing to its high sensitivity, short acquisition time, and availability of several imaging probes (6, 7). Particularly for DLBCL, 18F-fluorodeoxyglucose positron emission tomography ([18F]FDG-PET) imaging is the current standard for diagnosis, because the fast-proliferating lymphoma cells consume high levels of glucose and incorporate large amounts of [18F]FDG (8).
The [18F]FDG tracer has been shown to be a reliable diagnostic tool for detection of DLBCL (6, 9), identification of bone marrow metastasis (10, 11), and monitoring of therapy (12). However, the reliability of [18F]FDG-PET can be affected by uptake of the tracer by nonmalignant tissues that also consume high levels of glucose. For example, inflamed lymph nodes are rich in immune cells with high [18F]FDG uptake, which can produce high [18F]FDG-PET signals and result in a false-positive diagnosis of DLBCL (13, 14).
In addition, several immunotherapies, particularly checkpoint inhibitors (15) and chimeric antigen receptor T cells (16), have shown great efficacy in refractory/relapsed DLBCL and are likely to receive clinical approval in the near future. These immunotherapies can induce inflammation-driven “pseudoprogression,” which cannot be easily distinguished from true tumor progression with [18F]FDG-PET (17). Thus, there is an unmet clinical need for an imaging approach that can distinguish malignant tissues from inflammatory tissues. Such a method would reduce the frequency of biopsies, provide accurate monitoring of therapy, and increase the precision of surgical interventions.
In response to this need, we have developed a PET imaging strategy based on a potential new DLBCL biomarker. We found that DLBCL expresses much higher levels of poly[ADP-ribose] polymerase 1 (PARP1) than all other major cancer types, as well as healthy tissues in humans. In a mouse DLBCL model, we used a PARP1-targeted PET imaging probe to accurately differentiate malignant from normal or inflamed lymph nodes with both noninvasive PET/CT imaging and ex vivo γ-counting. Clinically established [18F]FDG-PET failed to distinguish malignancy from inflammation in the same settings. Our PARP1-targeted PET imaging approach is an attractive addition to PET imaging for DLBCL, particularly when inflammation poses a high risk of misdiagnosis of the disease.
Results
PARP1 Expression in DLBCL.
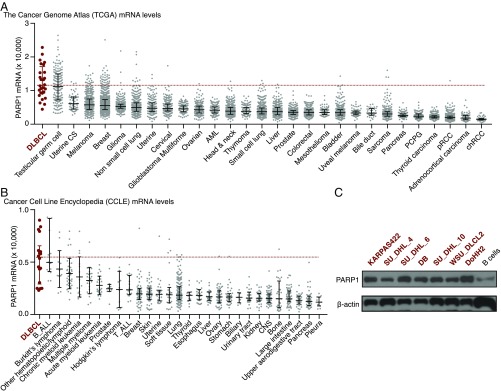
According to The Cancer Genome Atlas (TCGA) database (18), human DLBCL expresses the highest levels of PARP1 among all major cancer types (Fig. 1A). Using the Cancer Cell Line Encyclopedia (19), we also found that the average PARP1 expression of 18 DLBCL-derived human cell lines was higher than the average expression of cell lines from other major human cancers (Fig. 1B). Finally, we found that seven selected DLBCL cell lines expressed higher levels of PARP1 protein than normal human B cells (Fig. 1C). These data suggest that PARP1 is a potential target to help differentiate DLBCL from normal tissues in humans.
Fig. 1.
DLBCL highly expresses PARP1. (A) PARP1 mRNA levels in human cancers. The data were collected from TCGA. One sample in the DLBCL group is outside of the upper limit of the y-axis, with a value of 35,575. (B) PARP1 mRNA levels in human cancer cell lines. The data were derived from the Cancer Cell Line Encyclopedia from the Broad Institute. In A and B, the middle bars represent the median value, and error bars represent IQR. (C) PARP1 protein expression levels in human B-cell lymphoma cell lines and primary human B cells.
A DLBCL Mouse Model Mimicking Human Disease.
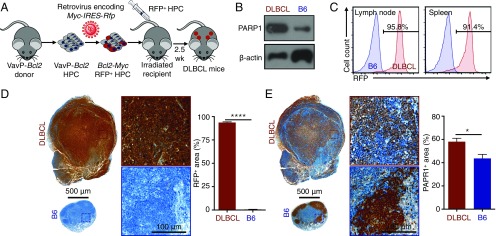
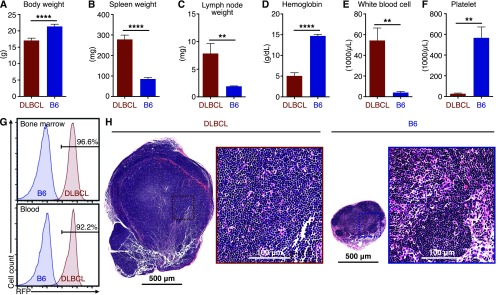
To evaluate PARP1 as a potential diagnostic marker for DLBCL, we created an animal model that closely simulates the human disease. Previous studies have identified MYC and BCL2 as two essential oncogenes to drive the pathogenesis of DLBCL (20–22). In our model, we used retroviral infection to introduce the murine Myc oncogene into hematopoietic precursor cells (HPCs) with the oncogene Bcl2 driven by the Vav promoter (23). HPCs expressing Myc and Bcl2 proteins were transplanted into sublethally irradiated immunocompetent C57BL/6 (B6) mice, so that a disease with an identical genetic makeup as its human counterpart could be established in the animals. The expression of red fluorescent protein (RFP) is linked to that of Myc to track the progeny cells derived from the transplanted HPCs (Fig. 2A). At 20 d after HPC transplantation, the animals exhibited an ∼10% loss of body weight, splenomegaly, lymphadenopathy, low blood hemoglobin levels, elevated white blood cell counts, and decreased blood platelets, all of which are similar to human DLBCL (24) (Fig. S1 A–F). As in human DLBCL (Fig. 1B), lymphoma cells from DLBCL mouse spleens expressed much higher levels of PARP1 compared with spleens from healthy B6 mice (Fig. 2B). In addition, >90% of immune cells in the lymphatic tissues of DLBCL mice expressed RFP, confirming their origin as the transplanted HPCs (Fig. 2C and Fig. S1G). In DLBCL lymph nodes, >90% of the area of the tissue sections was stained positive with RFP (Fig. 2D), and the integrity of germinal centers was lost (Fig. S1H), demonstrating massive lymphoma penetration. Finally, the area that stained positive with PARP1 was significantly higher in DLBCL lymph nodes than in the healthy controls (Fig. 2E; P < 0.05). These data demonstrate that our animal model accurately recapitulates the physiopathology and genetic makeup of human DLBCL, particularly the high PARP1 levels in the disease.
Fig. 2.
A mouse DLBCL model recapitulates the pathophysiology of human DLBCL. (A) Schematic depiction of the development of the mouse model that mimics human DLBCL. (B) Western blot analysis showing higher PARP1 expression levels in DLBCL cells from mouse spleens compared with B cells from B6 mouse spleens. (C) Representative flow cytometry graphs showing that most immune cells (CD45+) in DLBCL mice express RFP and thus are derived from the transplanted HPCs. (D) Immunohistochemistry showing that the lymph nodes of DLBCL mice (n = 5) are larger than those of B6 mice (n = 5), and that most cells express RFP. (E) Immunohistochemistry results for the adjacent slides showing higher PARP1 expression levels in the lymph nodes of DLBCL mice (n = 5) compared with B6 mice (n = 5). Error bars represent SEM. *P < 0.05, ****P < 0.0001, nonparametric Student’s t test.
Fig. S1.
Physiological characteristics of the DLBCL mice. (A) Body weights of DLBCL mice and irradiated control B6 mice. (B) Spleen weights. (C) Lymph node weights. (D) Hemoglobin concentrations in blood. (E) White blood cell counts. (F) Blood platelet counts. Five DLBCL mice and five B6 mice were used for these measurements. (G) Representative flow cytometry measurements of the RFP-positive immune cells (CD45+) in bone marrow and blood, demonstrating that the majority cells of were derived from transformed HPCs. (H) Representative H&E staining of superficial cervical lymph nodes showing a loss of germinal center integrity. Five DLBCL mice and five B6 mice were used. Error bars represent SD. **P < 0.01; ****P < 0.0001, two-tailed Student’s t test with assumption of unequal SD.
Evaluation of PARP1 as a DLBCL Diagnostic Marker.
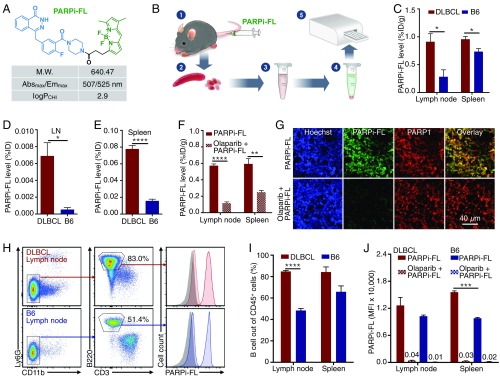
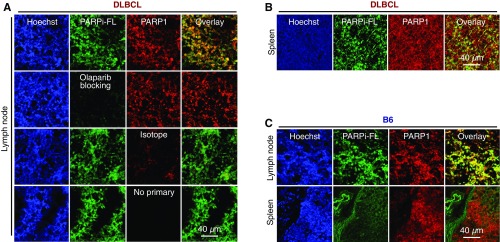
To test the feasibility of PARP1 imaging in DLBCL, we used a fluorescent PARP1-targeted imaging probe, PARPi-FL (25–27). PARPi-FL is based on the PARP-specific inhibitor olaparib, a Food and Drug Administration-approved drug for treating ovarian, lung, and breast cancer with BRCA mutations (28) (Fig. 3A). PARPi-FL has been shown to specifically target PARP1 in glioblastoma, oral cancers, lung cancers, and other types of cancer (25, 26, 29, 30). We first tested whether PARPi-FL accumulated in a PARP1-specific manner in lymph nodes and spleens of DLBCL mice, because of their high PARP1 expression levels. Using a spectrofluorimetric protocol (31) (Fig. 3B), we found that PARPi-FL accumulated at higher levels in the tissues of DLBCL mice compared with healthy B6 mice (Fig. 3 C–E). Furthermore, preexposure to olaparib significantly reduced PARPi-FL accumulation, corroborating that the observed retention was PARP1-specific (Fig. 3F). Finally, immunofluorescence confirmed the PARP1-specific nature of PARPi-FL accumulation in the nuclei of PARP1+ cells in the lymph nodes (Fig. 3G) and spleens (Fig. S2 A–C), as preexposure with olaparib diminished retention of the signal in PARP1-expressing nuclei.
Fig. 3.
Evaluation of a PARP1-targeted diagnostic strategy. (A) Physiochemical properties of the PARPi-FL probe. (B) Schema of the experimental spectrofluorimetry procedure for measurement of PARPi-FL concentrations in spleen and lymph nodes of DLBCL and B6 mice. (C) Spectrofluorimetry measurement of PARPi-FL accumulation in DLBCL mice (n = 5) and B6 mice (n = 5). The concentration of PARPi-FL is presented as the percentage of injected dose per gram of tissue (%ID/g). (D) PARPi-FL accumulation in lymph nodes as measured by %ID. (E) PARPi-FL accumulation in spleen as measured by %ID. (F) Preexposure of olaparib blocks the accumulation of PARPi-FL in the lymph nodes and spleen of DLBCL mice. (G) Representative confocal microscopic images of lymph node sections from DLBCL mice with PARPi-FL injection or blocking with olaparib. (H) Flow cytometry gating procedure to identify B cells from the lymph nodes of DLBCL or B6 mice injected with PARPi-FL. (I) Flow cytometry enumeration showing the percentage of B cells out of all CD45+ immune cells in the lymph nodes and spleen. (J) Quantification of average PARPi-FL level in B cells by flow cytometry as measured by the mean fluorescence intensity (MFI). The numbers over the short bars indicate MFI value (×10,000). Error bars represent SEM. *P < 0.05; **P < 0.01; ***P < 0.001; ****P < 0.0001, nonparametric Student’s t test.
Fig. S2.
Confocal microscopic images of DLBCL and B6 mice. (A) Images of lymph node histological sections from DLBCL mice. The first row shows a PAPR1-stained section from a DLBCL mouse injected with PARPi-FL. The second row shows a PARP1-stained lymph node section from a mouse preblocked with olaparib. The third row shows a nonspecific antibody-stained control for PARP1. The fourth row shows the nonspecific signal of the secondary fluorescent antibodies without primary antibodies for PARP1. (B) Representative image of an immunostaining slide from the spleen of a DLBCL mouse injected with PARPi-FL. (C) Representative images from slides of lymph node and spleen from a B6 mouse injected with PARPi-FL.
PARPi-FL accumulation in cells derived from lymph node tissue and spleens was quantified with flow cytometry by measuring the fluorescent signal of PARPi-FL in single cells (Fig. 3H). Flow cytometry analysis revealed that B220+ B-like cells composed >84% of all immune cells (CD45+) in the lymph nodes and spleens of DLBCL mice (Fig. 3I), suggesting that DLBCL is fully established in these tissues. We also found greater PARPi-FL accumulation in B lymphoma cells from DLBCL mice than in B cells from healthy B6 mice (Fig. 3J). Most importantly, preblocking with olaparib reduced the PARPi-FL accumulation in these cells by 96–99%, further indicating that the imaging agent accumulation was PARP1-specific. These data demonstrate that PARP1-targeted imaging probes can be used to evaluate PARP1 expression at tissue and single-cell levels in DLBCL.
Measuring PARP1-Specific Radioactive Probe Accumulation at Single-Cell Levels.
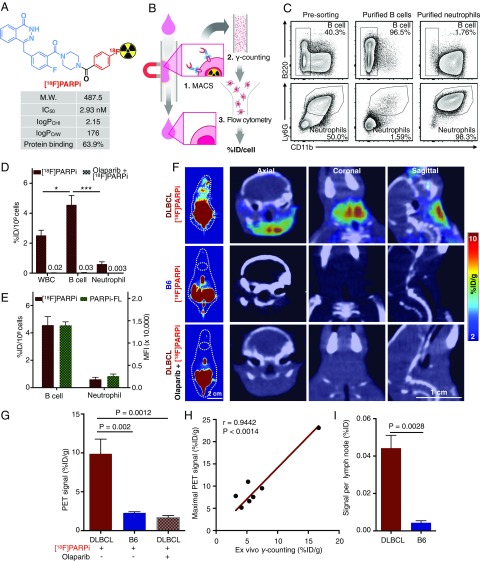
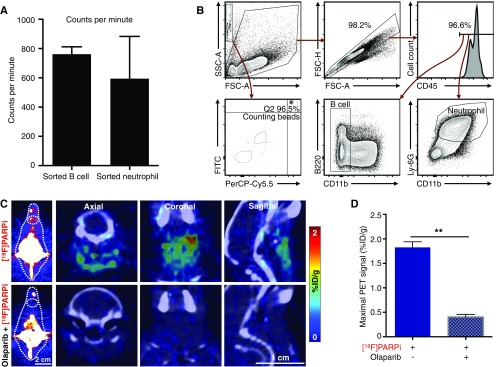
[18F]PARPi, a 18F-fluorinated PARP-specific probe based on olaparib, has been shown to have excellent retention in PARP1-expressing tumors, as well as good pharmacokinetics (32) (Fig. 4A). In a proof-of-concept study, we sought to measure the specific accumulation of the probe on the single-cell level. We collected the blood of DLBCL mice injected with [18F]PARPi and isolated both B lymphoma cells and neutrophils by magnetic-activated cell sorting (MACS). We then measured the total radioactivity of the purified cells and enumerated the cells by flow cytometry (Fig. 4B). This protocol generated sufficient cells to produce a high signal in γ-counting (Fig. S3A). We chose neutrophils as a reference because the cells are known to express low levels of PARP1 (33) and thus would be expected to accumulate less [18F]PARPi. We devised a flow cytometry protocol to identify and calculate the numbers of B lymphoma cells and neutrophils in the decayed cell suspension (Fig. S3B). The flow cytometry results showed that our MACS procedure produced >96% purity of the isolated B cells and >98% purity of the isolated neutrophils (Fig. 4C). As expected, [18F]PARPi accumulated at higher levels in B lymphoma cells than in neutrophils (P < 0.001) (Fig. 4D). Preexposure with olaparib reduced [18F]PARPi accumulation in these cells by >99% (Fig. 4D), in line with the results found with PARPi-FL (Fig. 3J). We then compared the differential accumulation of [18F]PARPi and PARPi-FL in B lymphoma cells and neutrophils, and used these results to calculate the average percentage of injected dose per billion cells in DLBCL mice (%ID/109 cells) (Fig. 4E). Both tracers showed higher accumulation in B lymphoma cells than in neutrophils, with similar ratios of difference (Fig. 4E). These data therefore provide quantitative cell type-specific measurement of a radioactive imaging probe at the single-cell level in animals. [18F]PARPi shares the same PARP1 specificity as PARPi-FL in our DLBCL animal model.
Fig. 4.
Use of a PARP1-targeted radioactive agent to detect DLBCL at single-cell and whole-body levels. (A) Physiochemical properties of the [18F]PARPi probe. (B) Schema of the procedure for measuring average [18F]PARPi accumulation per cell in blood B lymphoma cells. (C) Flow cytometry of the final step of this experiment showing high purity of isolated B cells (>96%) and neutrophils (>98%). (D) Accumulation of [18F]PARPi at the single-cell level, presented as %ID/109 cells. The average accumulation of [18F]PARPi per cell was measured in nonpurified white blood cells, purified B cells, and purified neutrophils. Preinjection of olaparib reduced the accumulation by 99%. The numbers over the short bars indicate the value of the bars. (E) Comparison of [18F]PARPi and PARPi-FL accumulation in B cells and neutrophils from the blood of DLBCL mice (n = 7 for [18F]PARPi; n = 4 for PARPi-FL), demonstrating similar specificity of the two PARP1-targeted probes. (F) Representative [18F]PARPi PET (Left) and PET/CT (Right) hybrid images of DLBCL mice (n = 7), B6 mice (n = 4), and DLBCL mice preexposed to olaparib (n = 4). (G) Quantification of PET signals in lymph nodes. The signal was calculated by averaging the maximal signals of five consecutive axial slices (1 mm thick) that cover superficial cervical lymph nodes. (H) Correlation of radioactivity measurement between in vivo PET imaging and ex vivo γ-counting (n = 7). Pearson correlation was used to calculate statistics and correlation coefficients. (I) Accumulation of [18F]PARPi in lymph nodes in DLBCL mice (n = 9) and B6 mice (n = 4) as measured by ex vivo γ-counting. Error bars represent SEM. *P < 0.05; **P < 0.01; ***P < 0.001; ****P < 0.0001, nonparametric Student’s t test.
Fig. S3.
PET/CT imaging of B6 mice and key parameters of single-cell radioactivity measurements in DLBCL mouse blood. (A) Average cpm of purified B cells or neutrophils; the background cpm was <30. (B) Flow cytometry procedure for enumerating purified B cells and neutrophils with counting beads and identifying B lymphoma cells and neutrophils. (C) Representative PET/CT images of the lymph nodes of B6 mice injected with [18F]PARPi (n = 4) and preblocked with olaparib (n = 3). (D) Quantification of PET signals in these lymph nodes. Error bars represent SEM. **P < 0.01, two-tailed Student’s t test with assumption of unequal SD.
PARP1-Targeted PET Imaging for DLBCL Diagnosis.
PET/CT imaging is the current standard for diagnosing and monitoring DLBCL (34). To test whether [18F]PARPi is a feasible PET imaging probe for DLBCL, we first measured its specificity in our DLBCL mouse model. We performed [18F]PARPi PET/CT imaging (Fig. 4F) on DLBCL mice (n = 7), B6 mice (n = 4), and DLBCL mice preinjected with olaparib (500 μg, 1.15 μmol; n = 4). Compared with B6 mice, DLBCL mice exhibited a 5.6-fold increase in PET signal in their lymph nodes (P = 0.002). Preinjection of olaparib decreased the accumulation by 87% (P = 0.0012), demonstrating that [18F]PARPi accumulation was specific to PARP1 (Fig. 4 F and G). This PARP1-specific accumulation was found in B6 mouse lymph nodes, which express relatively high levels of PARP1 as well (Fig. S3 C and D). Furthermore, the ex vivo radioactivity measurement with γ-counting linearly agreed with the in vivo PET/CT reading, demonstrating the highly quantitative rigor of this approach (Fig. 4H). Finally, the total amount of [18F]PARPi per DLBCL lymph node was 10-fold higher than that in B6 lymph nodes (P = 0.0028) (Fig. 4I). These data demonstrate that PARP1-targeted PET imaging can accurately differentiate malignant DLBCL lymph nodes from the normal lymph nodes.
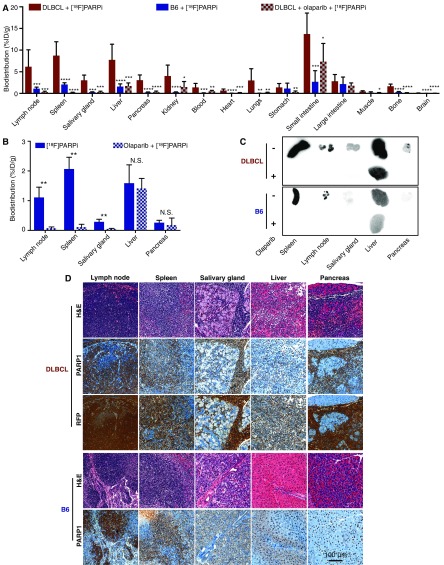
We then performed comparative biodistribution of [18F]PARPi in DLBCL mice, B6 mice, and DLBCL mice preinjected with olaparib (500 μg, 1.15 μmol). Significantly higher [18F]PARPi retention was seen in most tissues of the DLBCL mice compared with the B6 mice (Fig. S4A). Importantly, the high accumulation in DLBCL tissues could be blocked by preinjection of olaparib, demonstrating that the retention was PARP1-specific and suggesting that infiltration of B lymphoma cells as the cause of the greater [18F]PARPi retention (Fig. S4A). To confirm this, we focused on lymph nodes, spleen, salivary glands, liver, and pancreas. In B6 mice, lymph nodes, spleen, and salivary glands, but not liver and pancreas, showed PARP1-specific accumulation of [18F]PARPi (Fig. S4 B and C). In contrast, in DLBCL mice, all five tissues displayed greater [18F]PARPi accumulation (Fig. S4 A and C). In all five DLBCL tissues, the cells rich in PARP1 also expressed RFP, the genetic tag of B lymphoma cells, demonstrating that the high PARP1-specific accumulation of [18F]PARPi was a direct result of B lymphoma cell infiltration (Fig. S4D). These data suggest that [18F]PARPi, along with being an appealing PET imaging probe, also can be used to monitor the metastatic progression of DLBCL in multiple tissues.
Fig. S4.
[18F]PARPi reveals DLBCL metastases in multiple tissues. (A) Biodistribution showing PARP1-specific accumulation of [18F]PARPi in multiple tissues from DLBCL mice injected with [18F]PARPi (n = 12), B6 mice injected with [18F]PARPi (n = 4), and DLBCL mice injected with [18F]PARPi and blocked with olaparib (n = 7). (B) Biodistribution in B6 mice showing PARP1-specific accumulation in lymph nodes, spleen, and salivary glands. B6 mice were injected with [18F]PARPi (n = 4) or preblocked with olaparib (n = 3). (C) Representative autoradiographs showing accumulation of [18F]PARPi in the selected tissues in DLBCL and B6 mice injected with [18F]PARPi and with additional olaparib blocking. (D) Representative histological images of the five tissues from DLBCL (n = 5) and B6 mice (n = 5). Consecutive sections were stained with H&E, PARP1, or RFP. Error bars represent SD. *P < 0.05; **P < 0.01; ***P < 0.001; ****P < 0.0001, nonparametric Student’s t test.
PARP1-Targeted PET Imaging to Differentiate Malignant from Inflamed Lymph Nodes.
Because of the high uptake of glucose exhibited by inflammatory immune cells in the tissues, [18F]FDG-PET has difficulty distinguishing inflammation from true malignancy in lymph nodes. Although B cells express rather high levels of PARP1 among the major immune cell types themselves (33), DLBCL cells express higher levels of PARP1 than normal B cells (Figs. 1 and 2). Therefore, we hypothesized that PARP1-targeted PET imaging could exploit this biological difference and differentiate malignant from inflamed lymph nodes in vivo.
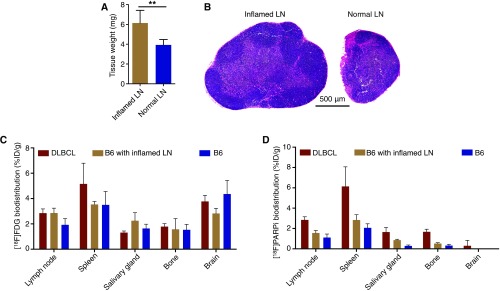
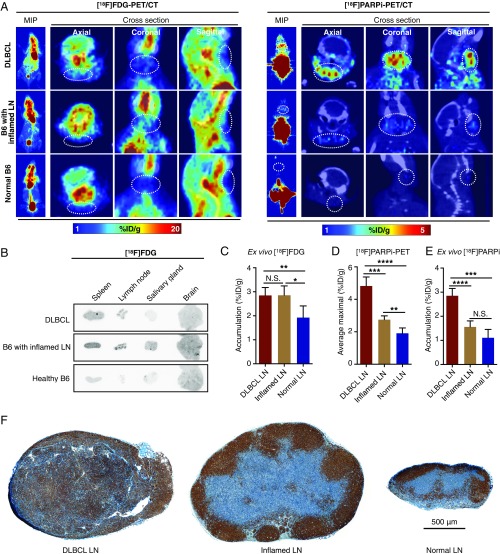
We induced inflammation in superficial cervical lymph nodes by systemically injecting Flt3L, a peptide that induces dendritic cell production (35), and locally injecting Poly-IC around these lymph nodes of B6 mice to induce regional inflammation. Lymph nodes derived from this mouse model exhibited larger volumes (Fig. S5A) but intact structure (Fig. S5B) compared with the normal nodes, demonstrating the established inflammation. We first performed [18F]FDG PET/CT imaging in DLBCL mice, B6 mice with inflamed lymph nodes, and normal B6 mice, and found greater [18F]FDG uptake in nonlymphatic tissues around the head and neck area than in lymph nodes (Fig. 5A). Autoradiography confirmed the PET imaging results by showing high uptake of [18F]FDG in the salivary glands and brain in mice with inflamed lymph nodes (Fig. 5B), consistent with ex vivo γ-counting (Fig. S5C). Importantly, inflamed lymph nodes had identical [18F]FDG uptake levels as DLBCL lymph nodes, demonstrating the inability of [18F]FDG-PET to differentiate inflammation from malignancy in DLBCL lymph nodes (Fig. 5C).
Fig. S5.
Validation of the inflamed lymph node model. (A) Average weight of superficial cervical lymph nodes from mice with local inflammation (n = 8) and healthy mice (n = 8). (B) Representative H&E staining showing the enlarged lymph nodes with inflammation compared with normal nodes. (C) Biodistribution showing accumulation of [18F]FDG in five selected tissues from DLBCL mice (n = 5), B6 mice with inflamed lymph nodes (n = 5), and normal B6 mice (n = 5). (D) Biodistribution of [18F]PARPi in the same tissues from DLBCL mice (n = 5), B6 mice with inflamed lymph nodes (n = 5), and normal B6 mice (n = 5). Error bars represent SD.
Fig. 5.
PARP1-targeted PET imaging differentiates malignant from inflamed lymph nodes. (A) Representative [18F]FDG PET (Left) and [18F]PARPi (Right) images of DLBCL mice (n = 3 for [18F]FDG; n = 5 for [18F]PARPi), B6 mice with inflamed lymph nodes (n = 3 for [18F]FDG; n = 5 for [18F]PARPi), and B6 mice with normal lymph nodes (n = 3 for [18F]FDG; n = 5 for [18F]PARPi). (B) Representative autoradiographic images of five selected tissues from the three groups of mice injected with [18F]FDG PET. (C) Ex vivo γ-counting of lymph node radioactivity from DLBCL mice (n = 5), B6 mice with inflamed lymph nodes (n = 5), and normal B6 (n = 5) injected with [18F]FDG. (D) Quantification of [18F]PARPi PET signal in lymph nodes from DLBCL mice (n = 5), B6 mice with inflamed lymph nodes (n = 5), and normal B6 mice (n = 4). Signals were calculated by averaging the maximal signals of five consecutive axial slices (1 mm thick) that cover superficial cervical lymph nodes. (E) Ex vivo γ-counting of lymph node radioactivity from DLBCL mice (n = 5), B6 mice with inflamed lymph nodes (n = 5), and normal B6 mice (n = 5) injected with [18F]PARPi. (F) Representative PARP1 immunostaining images of lymph nodes from DLBCL mice (n = 10), B6 mice with local inflammation (n = 10), and normal B6 mice (n = 10).
We then performed [18F]PARPi-PET/CT imaging in DLBCL mice, B6 mice with inflamed lymph nodes, and normal B6 mice. The PARP1-targeted imaging clearly differentiated the malignant lymph nodes from either inflamed or normal nodes (Fig. 5A). Compared with the high background of [18F]FDG-PET imaging in the head and neck area, the low uptake of [18F]PARPi in other nonlymphatic tissues highlighted malignant lymph nodes (Fig. 5A). Quantification of PET imaging revealed a 76% higher signal in malignant lymph nodes than in inflamed nodes (P < 0.001) and a 152% higher signal than in normal nodes (P < 0.0001) (Fig. 5D). Compared with normal lymph nodes, inflamed nodes showed only a modest increase in [18F]PARPi-PET signal (P < 0.01), and this increase was not significant on ex vivo γ-counting (P = 0.078) (Fig. 5 D and E). Quantitative biodistribution confirmed significantly greater [18F]PARPi accumulation in lymph nodes and spleens from DLBCL mice compared with those from the other two groups (Fig. S5D). Finally, immunostaining of lymph nodes from the three groups of mice showed that DLBCL lymph nodes displayed consistently high PARP1 expression across the whole tissue, whereas inflamed and normal lymph nodes showed much lower PARP1 expression confined to germinal centers (Fig. 5F). Taken together, these results demonstrate that PARP1-targeted PET imaging can accurately differentiate malignant from inflamed or normal lymph nodes in DLBCL, owing to the differential expression of PARP1 in these conditions.
Discussion
In this study, we found that DLBCL cells expressed higher levels of PARP1 than other types of cancer cells and normal B cells, identifying this nuclear DNA repair enzyme as a potential diagnostic marker for DLBCL (Fig. 1). We tested two PARP1-targeted imaging probes in a DLBCL mouse model that accurately mimics the physiopathology and genetic makeup of human DLBCL (Fig. 2). In DLBCL mice, the two probes specifically targeted PARP1 (Fig. 3), identified malignancies in lymph nodes (Fig. 4), and detected metastases in multiple tissues (Fig. S4). Finally, a direct comparison of our PARP1-targeted PET imaging approach with [18F]FDG-PET imaging demonstrated that our approach clearly differentiated malignant from inflamed lymph nodes, whereas the current standard-of-care [18F]FDG-PET imaging failed to do so (Fig. 5).
The high glucose uptake of certain nonmalignant cells in inflamed lymph nodes produces a high [18F]FDG-PET signal, which has been shown to lead to false-positive results in the posttreatment setting (13, 14, 36). For example, Moskowitz et al. (37) reported a very low positive predictive value of [18F]FDG PET/CT for the presence of viable lymphoma after R-CHOP therapy; only 5 of 38 patients with a positive [18F]FDG PET/CT after treatment demonstrated viable lymphoma on histology. Furthermore, PET-positive and PET-negative patients demonstrated identical progression-free survival. False-positive results on [18F]FDG PET/CT are expected to increase in the future owing to the increasing use of immunotherapy, which may cause “pseudoprogression” on FDG PET/CT, i.e., the appearance of new lesions or increased metabolic activity of existing lesions due to an inflammatory reaction triggered by the immunotherapy (38). Therefore, the international criteria for treatment monitoring in lymphoma have recently been revised to include an “indeterminate response” category. Our experimental data suggest that in this setting, PARP1 could be an alternative imaging target that allows for better separation between tumor and inflammation and thus more accurate assessment of tumor response to therapy.
Our mouse model recapitulates a prevalent genetic makeup of DLBCL pathogenesis, namely MYC and BCL2 double alteration. MYC and BCL2 are two of the most common oncogenes in DLBCL, and they drive the pathogenesis of the disease (21, 22). In addition, the DLBCL mice in this study exhibited loss of body weight, splenomegaly, lymphadenopathy, low blood hemoglobin levels, elevated white blood cell counts, and decreased blood platelet counts, all of which accurately mimic the pathophysiological symptoms of human DLBCL (24). Many previous lymphoma PET imaging studies used xenograft lymphoma tumors in immunocompromised mice (39–42). Our study conducted in this elaborate DLBCL mouse model more accurately simulates the clinical scenario than those studies.
Despite the importance of measuring the accumulation of tracers on the cellular level in animals, doing so is a challenge when using 18F-labeled imaging agents, which generally produce extremely low radioactivity per cell and are constrained by the short decay half-life of 18F (109.8 min) (43, 44). We have devised a protocol that combines MACS, γ-counting, and flow cytometry (Fig. 4B). Using this approach, we report the percentage of injected dose of 18F radiotracer per billion cells (%ID/109 cells) in animals. With our method, one could deduce the number of tracer molecules per cell, calculate the Bmax, and measure the radiation exposure of each cell. In addition, [18F]PARPi has been shown to efficiently target PARP1-expressing tumor cells in a glioblastoma mouse model (32). Combined with hybrid imaging modalities featuring enhanced soft tissue contrast (e.g., PET/MRI, PET/CT) (45), this imaging probe could complement the current standard-of-care imaging for DLBCL to also detect DLBCL invasion in the central nervous system.
Despite the ability of [18F]PARPi to detect DLBCL metastases with high contrast ratios shown in our ex vivo analyses (Fig. 5), the limited PET resolution of our preclinical PET/CT scanner (1∼2 mm) precluded detection of small, infiltrative lesions in vivo. Nevertheless, with a three orders of magnitude increase in body mass (and volume) when translating [18F]PARPi to the clinic, we hypothesize that [18F]PARPi-PET/CT imaging may be able to monitor the metastases of DLBCL noninvasively in most patient tissues. Similarly, although the accumulation of [18F]PARPi in the hepatobiliary system is high in mice, the use of a recently translated PARP1 tracer suggests that imaging of abdominal metastases with [18F]PARPi might be feasible in humans (46). In addition, preclinical studies have suggested that PARP inhibitors can be used to treat DLBCL (47, 48), and two ongoing clinical trials (NCT00576654 and NCT01366144) are testing PARP inhibitors to treat patients with DLBCL. We envision that our PARP1-targeted PET imaging potentially could be adapted to select and monitor patients with DLBCL lesions expressing high levels of PARP1 who could especially benefit from PARP inhibitor therapies.
Moving forward, we would like to evaluate the capability of our PARP1-targeted PET imaging in assessing cancer immunotherapies for DLBCL. Cancer immunotherapies often induce massive immune cell infiltration and consequently cause pronounced inflammation in tumors, increasing local metabolism levels (49). This inflammatory phenomenon presents tremendous challenges for the traditional therapeutic response evaluation methods, which often use a high metabolic rate as an indicator for cancer progression (50, 51). For DLBCL, immunotherapies such as checkpoint inhibitors (15) and CAR-T-cell therapy (16) are rapidly advancing in clinical development. An imaging method that can differentiate inflammation from malignancy is needed to evaluate the clinical efficacy of these new therapies. In this case, our PARP1-targeted PET imaging approach appears to be an appealing solution to this urgent need.
In conclusion, we have identified PARP1 as a potential diagnostic marker for DLBCL from patient samples, and have developed a PARP1-targeted PET imaging approach that shows greater sensitivity than the current standard-of-care [18F]FDG-PET imaging in differentiating malignant lymph nodes from inflamed or normal lymph nodes. This targeted PET imaging approach has the potential to shift the paradigm of PET imaging in DLBCL.
Materials and Methods
PARP1 Expression Data in Human Tissues and Cell Lines.
For PAPR1 expression in human cancer samples, data were downloaded from cBioportal (www.cbioportal.org/), which imported the raw sequencing data from TCGA (https://cancergenome.nih.gov/) (18). PARP1 mRNA expression levels were analyzed in 9,129 patient samples. All available PARP1 mRNA data as of June 2016 were downloaded and transformed to a plot with GraphPad Prism 6. For PARP1 expression in human cancer cell lines, data were downloaded from the Cancer Cell Line Encyclopedia (http://www.broadinstitute.org/ccle). Similarly, all available PARP1 mRNA expression data from 1,036 cancer cell lines were downloaded in June 2016.
Generation of the DLBCL Animal Model.
All animal experiments were approved by the Institutional Animal Care and Use Committee of Memorial Sloan Kettering Cancer Center. The 8- to 16-wk-old female C57BL/6 (B6) mice used in these experiments were purchased from Jackson Laboratories. vavP-Bcl2 transgenic fetal liver cells were obtained from vavP-Bcl2 heterozygous animals at embryonic day 14.5. The HPCs were grown in vitro for 4 d in a specially adapted growth medium as described previously (52) and then retrovirally transduced with MSCV vectors directing the expression of Myc-IRES-Rfp. The HPCs were transplanted into sublethally irradiated wild-type recipients, and the onset of disease was monitored twice weekly by palpation.
Spectrofluorimetry.
DLBCL mice were injected i.v. with 50 μg of PARPi-FL, with or without 500 μg of olaparib injected 30 min before the PARPi-FL injection. Animals were killed at 2.5 h after the injection and then perfused with 20 mL PBS. Lymph nodes and spleens were collected, weighed, and stored in 500 μL of RIPA lysis buffer (Boston Bioproducts) in bead-filled homogenizing vials (Lysing Matrix D, 6913–050; MP Biomedicals). Tissues were homogenized in an MP homogenizer (MP Biomedicals). Then 200 μL of homogenate was transferred to a new 1.5-mL tube, and 750 μL of acetonitrile, 200 μL of water, and 50 μL of 10% Triton X-100 (vol/vol) were added to the vials. The vials were vortexed for 60 s, incubated at 4 °C for 16 h, and then centrifuged at 15,000 × g for 20 min. Then 200 μL of supernatant was collected for analysis. In a plate reader (SpectraMax; Molecular Devices), the solution was excited at 507 nm, and the fluorescent signal was measured at 530 nm. The concentration of PARPi-FL in the solution was calculated by comparing the readings to standards with various concentrations of PARPi-FL. The total amount of PARPi-FL in the original tissues was calculated, and the accumulation was recorded as the percentage of injected dose of PARPi-FL per gram of tissue (%ID/g).
Flow Cytometry.
Previously established protocols were adapted to analyze the tissues in this study (53). In brief, at 2.5 h after i.v. injection of PARPi-FL, blood was collected in EDTA-treated tubes, and the mice were perfused with 20 mL of PBS. For the PARP1-blocking experiments, 500 μg of olaparib was injected i.v. into the mice at 30 min before the injection of PARPi-FL. Then lymph nodes, bone marrow, and spleen were collected and gently diced. A single-cell suspension was created by removing tissue aggregates, extracellular matrix, and cell debris from the solution. Red blood cells were removed from the blood sample using a red blood cell lysis buffer (Biolegend; 420301). PARPi-FL was detected on the FITC channel. B cells, T cells, neutrophils, and other myeloid cells were identified using antibodies specific to CD45 (clone 30-F11), CD11b (clone M1/70), CD11c (clone N418), B220 (clone RA3-6B2), and CD3 (clone 145–2C11). These antibodies were purchased from eBioscience and Biolegend. The FITC channel of the flow cytometer was calibrated using FITC calibration beads (Spherotech; ECFP-F1-3), and FITC channel variation was corrected by normalizing to the beads’ signal. All samples were analyzed using a LSRFortessa flow cytometer (BD Biosciences). The results were analyzed with FlowJo (Ashland), and statistics were calculated with Prism (GraphPad).
Micro PET/CT Imaging.
Mice were injected with [18F]PARPi or [18F]FDG at a dose of ≈300 μCi/mouse, and the mice were imaged on an Inveon small-animal micro-PET/CT scanner (Siemens Healthineers Global) under isoflurane-induced (Baxter Healthcare) anesthesia at 2 h after the radioactive tracer injection. For PARP1 blocking experiments, 500 μg of olaparib was injected i.v. into the mice at 30 min before the injection of [18F]PARPi. Whole-body static PET scans were recorded for 15 min, with ∼50 million coincidence events. The imaging data were normalized to correct for nonuniform PET response, dead-time count losses, positron branching ratio, and physical decay to the time of injection, but with no attenuation, scatter, or partial-volume averaging correction applied. The counting rates in the reconstructed images were converted to activity concentrations (%ID/g) using a system calibration factor derived from imaging a mouse-sized water-equivalent phantom containing 18F. Images were analyzed using an Inveon Research Workspace (Siemens Healthineers Global). Activity concentration was quantified by averaging the maximal values of at least five regions of interest drawn on consecutive slices of the chosen organs.
Radioactive Cell Sorting.
DLBCL mice were injected with [18F]PARPi at a dose of ≈300 μCi per animal. For PARP1 blocking experiments, 500 μg of olaparib was injected i.v. 30 min before the injection of [18F]PARPi. At 2.5 h after the [18F]PARPi injection, the mice were killed, and 500 μL of blood was collected and stored in tubes prefilled with EDTA. Red blood cells were removed as described above. The enriched white blood cells were purified following standard MACS procedures as specified by the device manufacturer (Miltenyi Biotec). In brief, the white blood cells were incubated with anti-B220 (Miltenyi Biotec; 30–049-501) or anti-Ly6G (Miltenyi Biotec; 130–092-332) antibodies conjugated with paramagnetic beads for 30 min. After a washing with flow cytometry buffer, the solution was passed through a magnetic column, followed by another washing with buffer. Finally, cells with bound antibodies were eluted from the columns. The cells were then immediately stained with a mixture of antibodies recognizing CD45, CD11b, Ly6G, and B220. After the staining, cells were fixed (00–8222-49; eBioscience) and their radioactivity was measured with a γ-counter (PerkinElmer) and decay-corrected. After counting, the stained cells were left at 4 °C for 24 h (>10 decay half-life times for 18F fluorine) for the decay of 18F. After radioactivity decay, counting beads were added to the cell suspension to allow for analysis of the purity and the numbers of cells in each sample with an LSRFortessa flow cytometer (BD Biosciences). Finally, the percentage of injected dose per billion cells (%ID/109 cells) was calculated using the following formula: average percentage of injected dose of [18F]PARPi per purified billion cells in a tube (%ID/109 cells) = percentage of decay-corrected injected dose (%ID)/the number of cells in that tube.
Statistics.
PARP1 mRNA expression data of patient samples and human cancer-derived cell lines are presented as median with IQR. Other data are presented as mean with SEM or SD as error bars. A nonparametric two-tailed Student’s t test with assumption of unequal SDs was used to calculate statistics. A P value <0.05 was considered to indicate statistical significance.
SI Materials and Methods
Synthesis of PARPi-FL.
BODIPY-FL NHS ester (5.0 mg, 12.8 mmol; Invitrogen) was conjugated to 4-(4-fluoro-3-(piperazine-1-carbonyl)benzyl)phthalazin-1(2H)-one (9.4 mg, 25.6 mmol) in the presence of triethylamine (4.6 μL). Purification by preparative HPLC (Waters XTerra C-18; 5-μm column, 7 mL/min, 5–95% acetonitrile in 15 min) afforded PARPi-FL in 70–79% yield as a red solid. Analytical HPLC analysis (Waters Atlantis T3 C18; 5 μm 4.6 × 250 mm column) showed high purity (>97%) of the imaging agent. The identity of PARPi-FL was confirmed by ESI-MS, MS(+) m/z = 663.4 [M+Na]+. For imaging studies, PBS (115 μL) was slowly added to an aliquot of PARPi-FL (50 μg, 78 nmol) in 50 μL of PEG300 (Sigma-Aldrich) to obtain a final injection volume of 165 μL.
Synthesis of [18F]PARPi.
In brief, a QMA cartridge containing cyclotron-produced [18F] fluoride (50 mCi, 1.85 GBq) was eluted with a solution containing 9 mg of Kryptofix [2.2.2] (4,7,13,16,21,24-hexaoxa-1,10-diazabicyclo[8.8.8]hexacosane), 0.08 mL of 0.15 M K2CO3, and 1.92 mL of MeCN into a 5-mL reaction vial. Solvents were removed azeotropically at 120 °C under nitrogen gas. Then 500 µg of ethyl 4-nitrobenzoate (Sigma-Aldrich) in 100 µL of dry DMSO was added, and the mixture was heated to 150 °C for 15 min. Then 50 µL of 1 M NaOH was added, followed by 50 µL of 1 M HCl. Then 2 mg of 4-(4-fluoro-3-(piperazine-1-carbonyl)benzyl)phthalazin-1(2H)-one in 100 µL of dry DMSO was added, followed by 10 mg of HBTU dissolved in 100 µL of DMSO and 20 µL of Et3N. Then 400 µL of MeCN and 1 mL of H2O were added to the mixture, and the product was purified by HPLC with a yield (non–decay-corrected) of 38.4 ± 2.5% and a specific activity of 0.97 ± 0.41 Ci/µmol.
Histology.
Lymph nodes of DLBCL and B6 mice were collected and fixed in 4% paraformaldehyde for 2 d. The tissues were then washed with 70% ethanol and embedded in paraffin following a standard histology protocol. Histology slides were stained with standard H&E, followed by immunostaining with antibodies specific to PARP1 (SC-7150; Santa Cruz Biotechnology) or specific to B220 (clone RA3-6B2; Abcam). The stained slides were digitalized with a slide scanner (Panoramic MIDI; PerkinElmer), and images were analyzed and quantified with a Panoramic Viewer (PerkinElmer). An average of five lymph node images were analyzed per DLBCL mouse (n = 5 in total) or B6 mouse (n = 5 in total).
Biodistribution and Autoradiography.
Mice were injected with 300 μCi of [18F]PARPi or [18F]FDG. Blocking with olaparib was performed by administering 500 μg 30 min before [18F]PARPi injection. Animals were killed at 2.5 h postinjection of the radioactive probe and perfused with 20 mL PBS. Radiotracer accumulation in lymph nodes, spleen, salivary glands, liver, pancreas, kidneys, blood, heart, lung, stomach, small intestine, large intestine, muscle, bone, and brain was determined by first weighing the tissues and then measuring their radioactivity in a γ-counter (PerkinElmer). The relative activity per tissue is presented as %ID/g. For autoradiography, radiotracer accumulation in spleen, lymph node, salivary glands, liver, and pancreas was determined by placing the tissues in a film cassette against a phosphor imaging plate (BASMSM-2325; Fujifilm) for ≈30 min. Phosphor imaging plates were read in a Typhoon 7000IP plate reader (GE Healthcare).
Inflammation of Lymph Nodes.
C57BL/6 mice age 8-to-16 wk received daily i.p. injections of Flt3L (Celldex) at a dose of 30 μg for 5 d. On day 4, 100 μg of PolyI:C (tlrl-pic; InvivoGen) dissolved in 50 μL of PBS was injected s.c. around the superficial cervical lymph nodes. On day 5, after the Flt3L injection, the mice were injected with [18F]FDG or [18F]PARPi and imaged with a PET/CT scanner (Inveon; Siemens Healthineers Global). After the imaging, lymph nodes, spleen, salivary glands, brain, and tibias were collected, weighed, and counted with a γ-counter. Accumulation of radioactive tracers in the tissues is presented as %ID/g.
Western Blot Analysis.
DLBCL cell lines (KARPAS422, SU_DHL_4, Su_DHL_6, DB, SU_DHL_10, WSU_DLCL2, and DoHH2) and human primary B cells were purchased from American Type Cultur Collection and cultured in the conditions recommended by the vendor. Western blot analysis was performed using the whole-cell lysates or supernatant. In brief, 30 μg of protein per sample was resolved on SDS/PAGE gels and transferred to Immobilon-P membranes (EMD Millipore). Antibodies specific to PARP1 (Cell Signaling Technology; 9542) and actin (Cell Signaling Technology; 3700) were used. Detection was done using ECL (GE Healthcare).
Confocal Microscopy.
PARPi-FL accumulation was correlated with PARP1 expression in lymph nodes by immunofluorescence staining on histological sections. Lymph nodes of DLBCL mice were snap-frozen at 2 h after i.v. injection of 50 μg of PARPi-FL, with or without injection of 500 μg of olaparib 30 min before the PARPi-FL injection. Then 10-μm cryosections of DLBCL lymph nodes were fixed in 4% paraformaldehyde for 8 min, followed by blocking with 3% (vol/vol) goat serum (Sigma-Aldrich). Antibodies were diluted in 1% (wt/vol) BSA and 0.3% (vol/vol) Triton X-100 in PBS. Anti-PARP1 primary antibody (sc-7150; Santa Cruz Biotechnology) was incubated overnight at 4 °C (1 μg/mL), followed by incubation with secondary Alexa Fluor 680 goat anti-rabbit antibody (A21076; Molecular Probes) for 1 h at 4 °C (2 μg/mL). Sections were mounted with Mowiol (Sigma-Aldrich) containing Hoechst 33342 DNA stain (Sigma-Aldrich). Fluorescence images were captured using a Leica SP5 upright confocal microscope equipped with a 405-nm laser for detection of cell nuclei, a 488-nm laser for detection of in vivo applied PARPi-FL, and a 633-nm laser for detection of PARP1 antibody stain, each paired with suitable emission filters.
Acknowledgments
We thank staff members at the Small Animal Imaging Core (V. Longo and P. Zanzonico), the Radiochemistry and Molecular Imaging Probes Core (S. Lyashchenko and P. DeNoble), and the Molecular Cytology Core (N. Fang, M. Turkekul, and D. Yarilin) at Memorial Sloan Kettering Cancer Center for support. We especially thank Dr. Miriam Merad (Icahn School of Medicine at Mount Sinai) for sharing an important reagent. This work was supported by National Institutes of Health Grants, R01 CA204441 (to T.R.), R21 CA191679 (to T.R. and W.A.W.), and P30 CA008748-50. Financial support was also provided by the Center for Molecular Imaging and Nanotechnology (to T.R.), the Tow Fellowship Program in Molecular Imaging and Nanotechnology (to B.C. and S.K.), and the National Science Foundation’s Integrative Graduate Education and Research Traineeship program (IGERT 0965983, to B.C.).
Footnotes
The authors declare no conflict of interest.
This article is a PNAS Direct Submission.
This article contains supporting information online at www.pnas.org/lookup/suppl/doi:10.1073/pnas.1705013114/-/DCSupplemental.
References
- 1.Miller KD, et al. Cancer treatment and survivorship statistics, 2016. CA Cancer J Clin. 2016;66:271–289. doi: 10.3322/caac.21349. [DOI] [PubMed] [Google Scholar]
- 2.Coiffier B, et al. CHOP chemotherapy plus rituximab compared with CHOP alone in elderly patients with diffuse large-B-cell lymphoma. N Engl J Med. 2002;346:235–242. doi: 10.1056/NEJMoa011795. [DOI] [PubMed] [Google Scholar]
- 3.Roschewski M, Staudt LM, Wilson WH. Diffuse large B-cell lymphoma— treatment approaches in the molecular era. Nat Rev Clin Oncol. 2014;11:12–23. doi: 10.1038/nrclinonc.2013.197. [DOI] [PMC free article] [PubMed] [Google Scholar]
- 4.Küppers R. Mechanisms of B-cell lymphoma pathogenesis. Nat Rev Cancer. 2005;5:251–262. doi: 10.1038/nrc1589. [DOI] [PubMed] [Google Scholar]
- 5.Toledano-Massiah S, et al. Whole-body diffusion-weighted imaging in Hodgkin lymphoma and diffuse large B-cell lymphoma. Radiographics. 2015;35:747–764. doi: 10.1148/rg.2015140145. [DOI] [PubMed] [Google Scholar]
- 6.Moskowitz CH, Schöder H. Current status of the role of PET imaging in diffuse large B-cell lymphoma. Semin Hematol. 2015;52:138–142. doi: 10.1053/j.seminhematol.2015.01.004. [DOI] [PubMed] [Google Scholar]
- 7.Juweid ME, Cheson BD. Role of positron emission tomography in lymphoma. J Clin Oncol. 2005;23:4577–4580. doi: 10.1200/JCO.2005.01.904. [DOI] [PubMed] [Google Scholar]
- 8.Juweid ME, et al. Response assessment of aggressive non-Hodgkin’s lymphoma by integrated international workshop criteria and fluorine-18-fluorodeoxyglucose positron emission tomography. J Clin Oncol. 2005;23:4652–4661. doi: 10.1200/JCO.2005.01.891. [DOI] [PubMed] [Google Scholar]
- 9.Kasenda B, et al. 18F-FDG PET is an independent outcome predictor in primary central nervous system lymphoma. J Nucl Med. 2013;54:184–191. doi: 10.2967/jnumed.112.108654. [DOI] [PubMed] [Google Scholar]
- 10.Adams HJA, et al. FDG PET/CT for the detection of bone marrow involvement in diffuse large B-cell lymphoma: Systematic review and meta-analysis. Eur J Nucl Med Mol Imaging. 2014;41:565–574. doi: 10.1007/s00259-013-2623-4. [DOI] [PubMed] [Google Scholar]
- 11.Purz S, et al. [18F]Fluorodeoxyglucose positron emission tomography for detection of bone marrow involvement in children and adolescents with Hodgkin’s lymphoma. J Clin Oncol. 2011;29:3523–3528. doi: 10.1200/JCO.2010.32.4996. [DOI] [PubMed] [Google Scholar]
- 12.Jerusalem G, et al. Persistent tumor 18F-FDG uptake after a few cycles of polychemotherapy is predictive of treatment failure in non-Hodgkin’s lymphoma. Haematologica. 2000;85:613–618. [PubMed] [Google Scholar]
- 13.Zhang MJ, et al. Lymph node uptake of 18F-fluorodeoxyglucose detected with positron emission tomography/computed tomography mimicking malignant lymphoma in a patient with Kikuchi disease. Clin Lymphoma Myeloma Leuk. 2010;10:477–479. doi: 10.3816/CLML.2010.n.083. [DOI] [PubMed] [Google Scholar]
- 14.Skoura E, Ardeshna K, Halsey R, Wan S, Kayani I. False-positive 18F-FDG PET/CT imaging: Dramatic “flare response” after rituximab administration. Clin Nucl Med. 2016;41:e171–e172. doi: 10.1097/RLU.0000000000001083. [DOI] [PubMed] [Google Scholar]
- 15.Lesokhin AM, et al. Nivolumab in patients with relapsed or refractory hematologic malignancy: Preliminary results of a phase Ib study. J Clin Oncol. 2016;34:2698–2704. doi: 10.1200/JCO.2015.65.9789. [DOI] [PMC free article] [PubMed] [Google Scholar]
- 16.Locke FL, et al. Phase 1 results of ZUMA-1: A multicenter study of KTE-C19 anti-CD19 CAR T cell therapy in refractory aggressive lymphoma. Mol Ther. 2017;25:285–295. doi: 10.1016/j.ymthe.2016.10.020. [DOI] [PMC free article] [PubMed] [Google Scholar]
- 17.Chiou VL, Burotto M. Pseudoprogression and immune-related response in solid tumors. J Clin Oncol. 2015;33:3541–3543. doi: 10.1200/JCO.2015.61.6870. [DOI] [PMC free article] [PubMed] [Google Scholar]
- 18.Weinstein JN, et al. Cancer Genome Atlas Research Network The cancer genome atlas pan-cancer analysis project. Nat Genet. 2013;45:1113–1120. doi: 10.1038/ng.2764. [DOI] [PMC free article] [PubMed] [Google Scholar]
- 19.Barretina J, et al. The cancer cell line encyclopedia enables predictive modelling of anticancer drug sensitivity. Nature. 2012;483:603–607. doi: 10.1038/nature11003. [DOI] [PMC free article] [PubMed] [Google Scholar]
- 20.Aukema SM, et al. Double-hit B-cell lymphomas. Blood. 2011;117:2319–2331. doi: 10.1182/blood-2010-09-297879. [DOI] [PubMed] [Google Scholar]
- 21.Savage KJ, et al. MYC gene rearrangements are associated with a poor prognosis in diffuse large B-cell lymphoma patients treated with R-CHOP chemotherapy. Blood. 2009;114:3533–3537. doi: 10.1182/blood-2009-05-220095. [DOI] [PubMed] [Google Scholar]
- 22.Hu S, et al. MYC/BCL2 protein coexpression contributes to the inferior survival of activated B-cell subtype of diffuse large B-cell lymphoma and demonstrates high-risk gene expression signatures: A report from the International DLBCL Rituximab-CHOP Consortium Program. Blood. 2013;121:4021–4031, quiz 4250. doi: 10.1182/blood-2012-10-460063. [DOI] [PMC free article] [PubMed] [Google Scholar]
- 23.Ortega-Molina A, et al. The histone lysine methyltransferase KMT2D sustains a gene expression program that represses B cell lymphoma development. Nat Med. 2015;21:1199–1208. doi: 10.1038/nm.3943. [DOI] [PMC free article] [PubMed] [Google Scholar]
- 24.Flowers CR, Sinha R, Vose JM. Improving outcomes for patients with diffuse large B-cell lymphoma. CA Cancer J Clin. 2010;60:393–408. doi: 10.3322/caac.20087. [DOI] [PubMed] [Google Scholar]
- 25.Irwin CP, et al. PARPi-FL–A fluorescent PARP1 inhibitor for glioblastoma imaging. Neoplasia. 2014;16:432–440. doi: 10.1016/j.neo.2014.05.005. [DOI] [PMC free article] [PubMed] [Google Scholar]
- 26.Kossatz S, et al. Detection and delineation of oral cancer with a PARP1-targeted optical imaging agent. Sci Rep. 2016;6:21371. doi: 10.1038/srep21371. [DOI] [PMC free article] [PubMed] [Google Scholar]
- 27.Kossatz S, Weber WA, Reiner T. Optical imaging of PARP1 in response to radiation in oral squamous cell carcinoma. PLoS One. 2016;11:e0147752. doi: 10.1371/journal.pone.0147752. [DOI] [PMC free article] [PubMed] [Google Scholar]
- 28.Fong PC, et al. Inhibition of poly(ADP-ribose) polymerase in tumors from BRCA mutation carriers. N Engl J Med. 2009;361:123–134. doi: 10.1056/NEJMoa0900212. [DOI] [PubMed] [Google Scholar]
- 29.Kossatz S, et al. Biomarker-based PET imaging of diffuse intrinsic pontine glioma in mouse models. Cancer Res. 2017;77:2112–2123. doi: 10.1158/0008-5472.CAN-16-2850. [DOI] [PMC free article] [PubMed] [Google Scholar]
- 30.Carney B, Kossatz S, Reiner T. Molecular imaging of PARP. J Nucl Med. 2017;58:1025–1030. doi: 10.2967/jnumed.117.189936. [DOI] [PMC free article] [PubMed] [Google Scholar]
- 31.Pérez-Medina C, et al. Nanoreporter PET predicts the efficacy of anti-cancer nanotherapy. Nat Commun. 2016;7:11838. doi: 10.1038/ncomms11838. [DOI] [PMC free article] [PubMed] [Google Scholar]
- 32.Carney B, et al. Non-invasive PET imaging of PARP1 expression in glioblastoma models. Mol Imaging Biol. 2016;18:386–392. doi: 10.1007/s11307-015-0904-y. [DOI] [PMC free article] [PubMed] [Google Scholar]
- 33.Benoist C, Lanier L, Merad M, Mathis D, Project IG. Consortium biology in immunology: The perspective from the Immunological Genome Project. Nat Rev Immunol. 2012;12:734–740, and erratum (2014) 14:578. doi: 10.1038/nri3300. [DOI] [PubMed] [Google Scholar]
- 34.Barrington SF, et al. Role of imaging in the staging and response assessment of lymphoma: Consensus of the International Conference on Malignant Lymphomas Imaging Working Group. J Clin Oncol. 2014;32:3048–3058. doi: 10.1200/JCO.2013.53.5229. [DOI] [PMC free article] [PubMed] [Google Scholar]
- 35.Maraskovsky E, et al. Dramatic increase in the numbers of functionally mature dendritic cells in Flt3 ligand-treated mice: Multiple dendritic cell subpopulations identified. J Exp Med. 1996;184:1953–1962. doi: 10.1084/jem.184.5.1953. [DOI] [PMC free article] [PubMed] [Google Scholar]
- 36.Castellucci P, et al. 18F-FDG PET in malignant lymphoma: Significance of positive findings. Eur J Nucl Med Mol Imaging. 2005;32:749–756. doi: 10.1007/s00259-004-1748-x. [DOI] [PubMed] [Google Scholar]
- 37.Moskowitz CH, et al. Risk-adapted dose-dense immunochemotherapy determined by interim FDG-PET in advanced-stage diffuse large B-cell lymphoma. J Clin Oncol. 2010;28:1896–1903. doi: 10.1200/JCO.2009.26.5942. [DOI] [PMC free article] [PubMed] [Google Scholar]
- 38.Cheson BD, et al. Refinement of the Lugano Classification lymphoma response criteria in the era of immunomodulatory therapy. Blood. 2016;128:2489–2496. doi: 10.1182/blood-2016-05-718528. [DOI] [PubMed] [Google Scholar]
- 39.Olafsen T, et al. Recombinant anti-CD20 antibody fragments for small-animal PET imaging of B-cell lymphomas. J Nucl Med. 2009;50:1500–1508. doi: 10.2967/jnumed.108.060426. [DOI] [PMC free article] [PubMed] [Google Scholar]
- 40.Robertson R, Germanos MS, Manfredi MG, Smith PG, Silva MD. Multimodal imaging with (18)F-FDG PET and Cerenkov luminescence imaging after MLN4924 treatment in a human lymphoma xenograft model. J Nucl Med. 2011;52:1764–1769. doi: 10.2967/jnumed.111.091710. [DOI] [PubMed] [Google Scholar]
- 41.Dhilly M, et al. 2-[18F]fludarabine, a novel positron emission tomography (PET) tracer for imaging lymphoma: A micro-PET study in murine models. Mol Imaging Biol. 2014;16:118–126. doi: 10.1007/s11307-013-0659-2. [DOI] [PubMed] [Google Scholar]
- 42.Natarajan A, Hackel BJ, Gambhir SS. A novel engineered anti-CD20 tracer enables early time PET imaging in a humanized transgenic mouse model of B-cell non-Hodgkin lymphoma. Clin Cancer Res. 2013;19:6820–6829. doi: 10.1158/1078-0432.CCR-13-0626. [DOI] [PubMed] [Google Scholar]
- 43.Lee WW, et al. PET/MRI of inflammation in myocardial infarction. J Am Coll Cardiol. 2012;59:153–163. doi: 10.1016/j.jacc.2011.08.066. [DOI] [PMC free article] [PubMed] [Google Scholar]
- 44.Ciprotti M, et al. Quantitative intratumoural microdistribution and kinetics of (131)I-huA33 antibody in patients with colorectal carcinoma. EJNMMI Res. 2014;4:22. doi: 10.1186/s13550-014-0022-x. [DOI] [PMC free article] [PubMed] [Google Scholar]
- 45.Schwenzer NF, Pfannenberg AC. PET/CT, MR, and PET/MR in lymphoma and melanoma. Semin Nucl Med. 2015;45:322–331. doi: 10.1053/j.semnuclmed.2015.03.006. [DOI] [PubMed] [Google Scholar]
- 46.Michel LS, et al. PET of poly (ADP-ribose) polymerase activity in cancer: Preclinical assessment and first in-human studies. Radiology. 2017;282:453–463. doi: 10.1148/radiol.2016161929. [DOI] [PMC free article] [PubMed] [Google Scholar]
- 47.Williamson CT, et al. Enhanced cytotoxicity of PARP inhibition in mantle cell lymphoma harbouring mutations in both ATM and p53. EMBO Mol Med. 2012;4:515–527. doi: 10.1002/emmm.201200229. [DOI] [PMC free article] [PubMed] [Google Scholar]
- 48.Weston VJ, et al. The PARP inhibitor olaparib induces significant killing of ATM-deficient lymphoid tumor cells in vitro and in vivo. Blood. 2010;116:4578–4587. doi: 10.1182/blood-2010-01-265769. [DOI] [PubMed] [Google Scholar]
- 49.Mellman I, Coukos G, Dranoff G. Cancer immunotherapy comes of age. Nature. 2011;480:480–489. doi: 10.1038/nature10673. [DOI] [PMC free article] [PubMed] [Google Scholar]
- 50.Moghbel MC, et al. Standardized response assessment criteria and their applications in lymphoma: Part 2. J Nucl Med. 2017;58:13–22. doi: 10.2967/jnumed.116.184242. [DOI] [PubMed] [Google Scholar]
- 51.Moghbel MC, et al. Response assessment criteria and their applications in lymphoma: Part 1. J Nucl Med. 2016;57:928–935. doi: 10.2967/jnumed.115.166280. [DOI] [PubMed] [Google Scholar]
- 52.Wendel HG, et al. Survival signalling by Akt and eIF4E in oncogenesis and cancer therapy. Nature. 2004;428:332–337. doi: 10.1038/nature02369. [DOI] [PubMed] [Google Scholar]
- 53.Tang J, et al. Immune cell screening of a nanoparticle library improves atherosclerosis therapy. Proc Natl Acad Sci USA. 2016;113:E6731–E6740. doi: 10.1073/pnas.1609629113. [DOI] [PMC free article] [PubMed] [Google Scholar]


