Significance
Fish school structures are firstly based on social life or prey–predator interactions, but another idea has often been raised by hydrodynamicists, claiming that fish could take advantage of schooling behavior from a locomotion efficiency perspective. By using a controlled swimming experiment with real schools, the present work shows that fish swimming together effectively need a less demanding stroke rate to sustain high swimming velocities, using, however, a different collective strategy compared with the usually suggested diamond pattern predicted by vortex-based interactions. The observed strategy, simply consisting of synchronized side-by-side swimming with nearest neighbors, finally, appears to be a lot more convenient for reaching an energy-saving regime.
Keywords: fish swimming, collective dynamics, pattern formation, synchronization, energy efficiency
Abstract
The question of how individuals in a population organize when living in groups arises for systems as different as a swarm of microorganisms or a flock of seagulls. The different patterns for moving collectively involve a wide spectrum of reasons, such as evading predators or optimizing food prospection. Also, the schooling pattern has often been associated with an advantage in terms of energy consumption. In this study, we use a popular aquarium fish, the red nose tetra fish, Hemigrammus bleheri, which is known to swim in highly cohesive groups, to analyze the schooling dynamics. In our experiments, fish swim in a shallow-water tunnel with controlled velocity, and stereoscopic video recordings are used to track the 3D positions of each individual in a school, as well as their tail-beating kinematics. Challenging the widespread idea of fish favoring a diamond pattern to swim more efficiently [Weihs D (1973) Nature 241:290–291], we observe that when fish are forced to swim fast—well above their free-swimming typical velocity, and hence in a situation where efficient swimming would be favored—the most frequent configuration is the “phalanx” or “soldier” formation, with all individuals swimming side by side. We explain this observation by considering the advantages of tail-beating synchronization between neighbors, which we have also characterized. Most importantly, we show that schooling is advantageous as compared with swimming alone from an energy-efficiency perspective.
The dynamics of animal groups is driven by many different factors, such as foraging, social life, or survival instinct against predators (1). The collective movements are built from local interactions between the individuals constituting the group (2, 3). Apart from behavioral aspects, the benefit from schooling has often been associated with group optimization in terms of hydrodynamic resistance (4). A fish school represents a typical case of such cohesive and collaborative complex systems. The fluid dynamical mechanisms influencing the motion of fish in a school have been described in essence in the early study of Weihs (5). He demonstrated, using a 2D model, that if each fish maintains a specific position within the school, forming a diamond pattern, the hydrodynamic interactions will globally improve the swimming performance. The basic idea is that fish in a school optimize swimming by interacting constructively with the vortices shed by the local leading individuals; such constructive interactions require a precise synchronization between fish. This study has been followed by an extensive number of studies modeling or simulating fish school swimming configurations to validate Weihs’ hypothesis (6–8). It has been shown that by following this strategy, fish could improve their efficiency by 20% (8, 9). However, the idea that a beneficial situation in terms of swimming power can be achieved for the group by maintaining a specific complex pattern remains, in some sense, a pure view from hydrodynamicists rather than an observation from nature. One of the shortcomings of the diamond pattern as a true description of natural systems lies in the strict 2D approach, which limits the comparison with real fish schools. There have certainly been several 3D computational studies on a single fish swimming (9–14), but very few exploring the case of fish swimming in groups (7). Another limitation of the diamond pattern is that its effectiveness imposes the strong constraint of maintaining a precise position and a quasiperfect synchronized kinematics of the individuals within the group (7). To a certain extent, this interesting and elegant view of fish group dynamics may be too idealized for noisy and multiple-parameter-dependent real schools.
In the present study, we investigate the energy-saving mechanisms of a fish school using real fish in a controlled swimming experiment. We chose for this purpose to examine the case of the red nose tetra fish, Hemigrammus bleheri. This species is particularly cohesive (15), thus representing a characteristic system to analyze collaborating interactions. It has been used in a recent study focusing on the interactions of neighboring fish swimming in pairs and triads—which can be considered the elementary subsystems of a fish school—that reported remarkable collaborative swimming features motivated by energy saving (16). This study especially showed that tail-beat synchronization increases dramatically when fish are forced to swim fast (i.e., in more energy-demanding gaits). How the nearest-neighbor dynamics scales up when considering larger schools is the question that we address in this work, where we have analyzed groups of up to nine individuals swimming at different speeds. The experimental apparatus allowed to explore a wide range of swimming speeds, from less than one body length per second (BL/s), which is approximately the natural free swimming gait of H. bleheri, to high-energy-consuming regimes (such as escaping or hunting) at up to 4 BL/s. Additionally, the swimming channel is relatively shallow, such that it constrains the vertical spatial extent of the fish school, leading to quasi-2D patterns. We show that the most efficient swimming mode does not correspond to a diamond pattern, but, rather, to in-line configurations where fish take advantage of side-by-side hydrodynamic interactions. We show in detail, by studying different group sizes, that the global dynamics of the school can be deduced by local basic fish-to-fish interactions. Synchronization between neighbors is shown to be one of the crucial physical mechanisms involved, correlated with the observation of a decreased intensity of the tail-beating stroke when a fish is part of a school.
Results
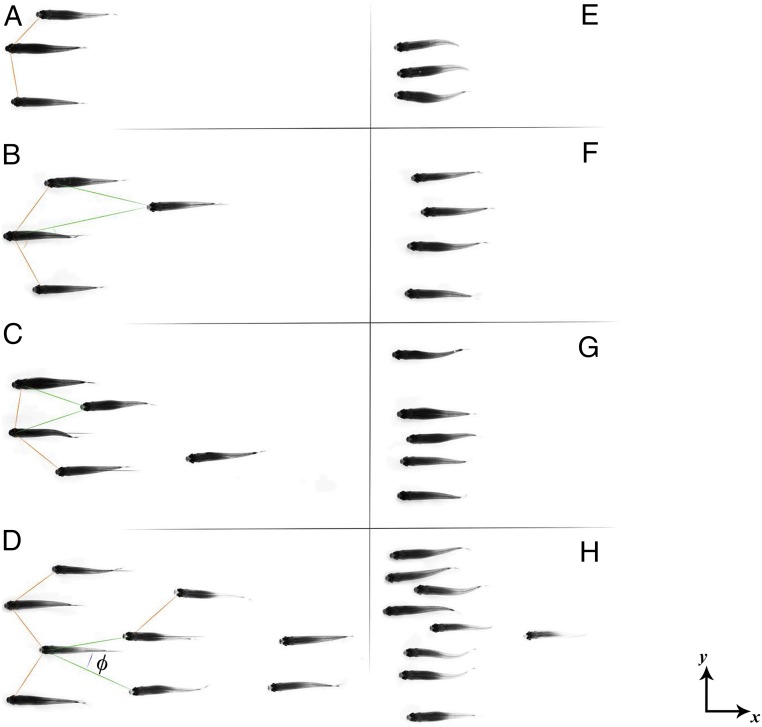
A stereoscopic camera setup has been used to track the 3D position of each fish, constituting the school as a function of time (see Materials and Methods for details). In addition, the body deformation, characterized by the time-resolved kinematics of the body midline, is recovered from top-view visualizations (as in ref. 16), giving information for each individual on the tail-beating frequency and amplitude. The swimming velocity of the school is set by imposing a flow in a shallow-water tunnel, ranging from 2.5 to 15 cm . Fig. 1 shows typical school structures of groups of different sizes (from three to nine individuals) observed at low and high swimming velocities (0.8 and 3.9 BL/s, respectively). As can be seen, there is a strong contrast between these two limiting cases. The patterns observed at low velocities (Fig. 1 A–D) show the individuals spread along the direction of the stream, with the typical spreading length increasing with the group size (pair, triplet, quartet, quintet, and nontet). The spatial patterns formed in this case can be identified as diamond configurations (see, for instance, Fig. 1D). The picture changes markedly for the cases with high swimming velocity (Fig. 1 E–H). Regardless of the school size, these are characterized by in-line configurations, described in the literature as phalanx (8) or soldier (17). This type of swimming pattern is observed, for instance, for hunting/predatory bluefin tunas in the Atlantic Ocean (18). We also note that the typical nearest-neighbor distance (NND) is smaller than in the schools swimming at low velocity. The observations of Fig. 1 are supported by a statistical analysis over a large number of measurements (Materials and Methods) with single fish and schools of up to nine individuals.
Fig. 1.
Characteristic swimming patterns for increasing fish group size at two different swimming speeds. (A–D) (see also Movies S1 and S2). The school pattern is spread downstream with characteristic angles and distances to nearest neighbors. (E–H) (see also Movies S3 and S4). As more effort is required to hold a high swimming regime, the fish reorganize in a compact in-line formation. In this configuration, fish within the group are synchronized with their nearest neighbors, corresponding to collaborative efficient swimming modes.
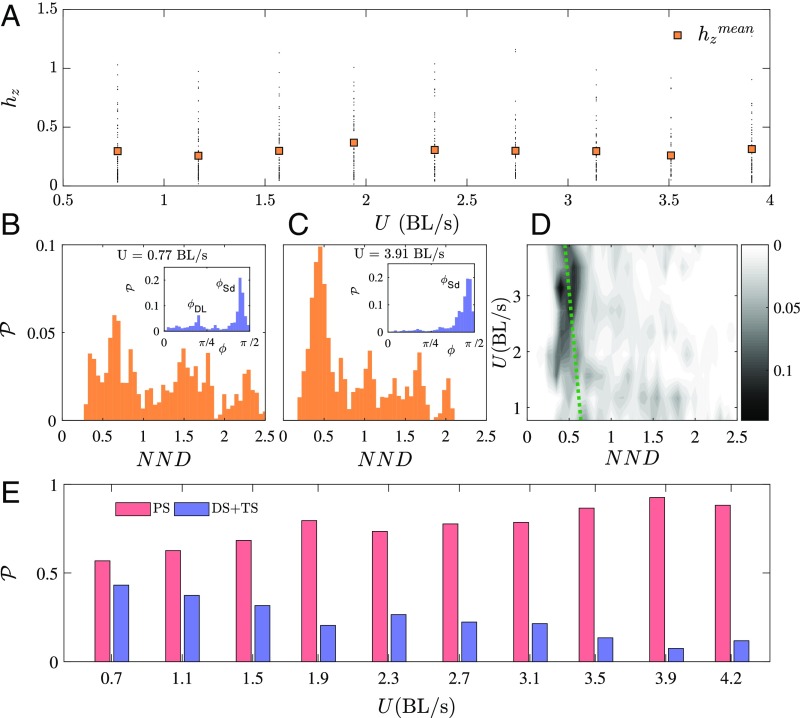
The averaged characteristics of the school are given in Fig. 2 as a function of the swimming velocity. Fig. 2A shows the vertical spreading of the fish school using the distance to a reference fish in the school normalized by the fish height , showing that fish are, on average, placed at most at a quarter of fish height from their neighbors. In all cases, fish swim around midheight of the channel. The schools, nonetheless, do have a 3D structure, which supports the observations reported in the literature where a slight spreading of the school pattern in the third dimension permits enlargement of the visual field of each member of the school (19–21). Considering the horizontal positions, in Fig. 2B we note that at low swimming velocities, the school patterns present two typical NNDs and angles as defined in Fig. 1, Left. This characteristic pattern has already been identified in a previous study on H. bleheri fish triplets (16). As can be observed, this reduced set of geometric parameters determines the most basic school, consisting of a fish triplet, and we use it here to describe the spatial pattern for larger groups of individuals. Results for high swimming velocities, where stronger effort is required to sustain a high swimming velocity, confirm that, statistically, there is only one typical angle characterizing the group pattern (Fig.2 C, Inset) and that the typical NND becomes shorter—see the shift in the histogram in Fig. 2C with respect to that in Fig. 2B. The histograms for all swimming velocities are compiled in the map shown in Fig. 2D, where the bright spot at high velocities shows the aforementioned trend (the green dashed line marks the shift in the most probable NND). All of the experiments can be summarized in terms of statistical occurrences of diamond-shaped (DS; fish behind the leading rows are placed between the two nearest neighbors in front of them), T-shaped (TS; where one fish follows directly behind one of the leaders), or in-line “phalanx-shaped” (PS; with fish swimming side by side and closer to each other) configurations (Fig. 2E). As can be noticed, PS configurations are dominant at high swimming velocity, independently of the school size.
Fig. 2.
Statistical properties of the fish schools as a function of swimming speeds over the whole range of cases studied (see Tables S1 and S2). (A) Variation of the -position of fish ( is the depth normalized by the fish average body height) as a function of swimming speed. Small black dots represent the instantaneous position of each fish, whereas orange squares represent average position, averaged over all groups. (B and C) Probability density of the NND for low (B) and high (C) swimming speeds. B and C, Insets show the probability density of nearest-neighbor angles . (D) Probability density map of NND as a function of the swimming speed. (E) Percentage of occurrences of diamond-shaped (DS) [or T-shaped (TS)] and phalanx-shaped (PS) patterns. High-speed swimmers are mainly characterized by phalanx patterns and short NND in comparison with low speed regimes.
Table S1.
Numbers of experiments for 3D tracking (Fig. 2 A–D)
| 0.77 | 1.17 | 1.57 | 1.94 | 2.34 | 2.74 | 3.14 | 3.51 | 4.0 | 4.2 | |
| Experiment type | BL/s | BL/s | BL/s | BL/s | BL/s | BL/s | BL/s | BL/s | BL/s | BL/s |
| Nontet | 2 | 1 | 3 | 2 | 2 | 2 | 2 | |||
| Quintet | 4 | 6 | 4 | 4 | 4 | 4 | 7 | 3 | 5 | 3 |
| Quartet | 11 | 11 | 8 | 5 | 7 | 7 | 8 | 6 | 7 | 3 |
| Triplet | 10 | 8 | 10 | 11 | 12 | 9 | 4 | 9 | 5 | 7 |
Table S2.
Numbers of experiments for Fig. 2E
| 0.77 | 1.17 | 1.57 | 1.94 | 2.34 | 2.74 | 3.14 | 3.51 | 4.0 | 4.2 | |
| Experiment type | BL/s | BL/s | BL/s | BL/s | BL/s | BL/s | BL/s | BL/s | BL/s | BL/s |
| Nontet | 5 | 5 | 4 | 6 | 5 | 6 | 6 | 6 | 6 | 6 |
| Quintet | 19 | 19 | 18 | 18 | 17 | 20 | 19 | 18 | 18 | 12 |
| Quartet | 33 | 29 | 23 | 21 | 26 | 22 | 23 | 21 | 23 | 13 |
| Triplet | 27 | 18 | 18 | 28 | 18 | 18 | 28 | 18 | 28 | 18 |
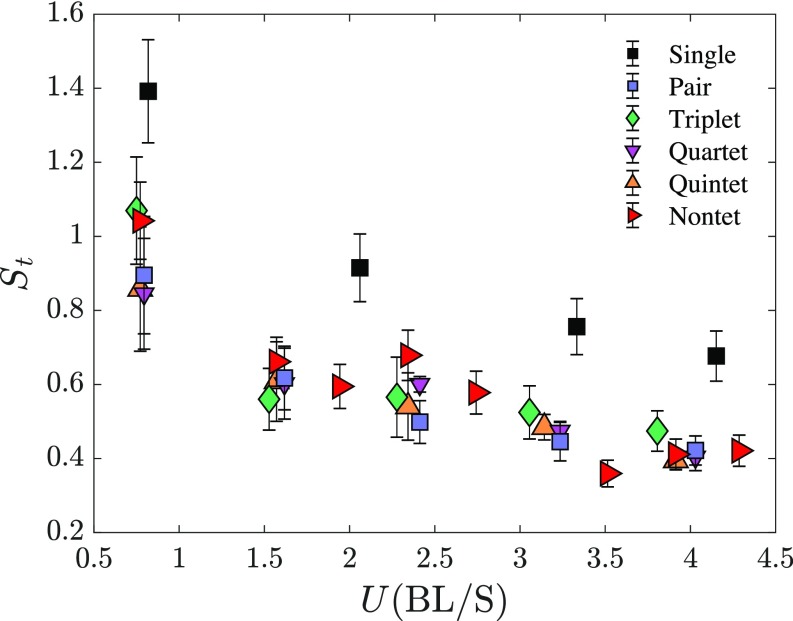
The central point now is to correlate the different spatial configurations of the schools with the observed tail-beating kinematics, which is how we probe the swimming efficiency of the school. Fig. 3 presents the kinematic measurements obtained from the midline tracking for all cases. The tail-beating frequency and amplitude are shown in Fig. 3 A and B, respectively, as a function of the swimming velocity. As can be seen, no consequence of swimming in a group is observed on the tail-beating amplitude, which only increases slightly when fish are swimming faster. However, there is a clear effect on the frequency: Fish swimming alone use a higher frequency than those that have at least one neighbor. Moreover, this difference in tail-beating frequency increases with the swimming velocity. The frequency and amplitude observations can be summarized by using the dimensionless representation of Fig. 3C that shows the transverse Reynolds number as a function of the usual cruising Reynolds number . The has also been named the “swimming number” in a recent study on the scaling of macroscopic aquatic locomotion (22) and has been used in the literature to describe flapping-based locomotion (e.g., ref. 23). Because the amplitude is almost constant, the dimensionless vs. curve reproduces the results already described in the frequency curve. Another quantity usually used to describe animal swimming is the Strouhal number (e.g., ref. 24), which is related to swimming efficiency because it compares the input effort of the fish characterized by the flapping velocity to the output represented by the swimming velocity . The values of resulting from the present observations range between 0.3 and 1.5 (Fig. S1). In accordance with the observations for the frequency and amplitude, the average Strouhal numbers for fish schools are lower than those for fish swimming alone at the same velocities. Combining the observations on the school patterns and the beating kinematics, we note that the most frequent patterns corresponding to efficient swimming (i.e., low values of Strouhal number) are characterized by a side-by-side phalanx configuration.
Fig. 3.
(A and B) Tail-flapping frequency (Hz) (A) and tail-flapping amplitude (nondimensionalized by fish body length) (B), as a function of the swimming velocity (in body lengths per second). (C) Transverse Reynolds number, , as a function of the cruising Reynolds number, . (D) Evolution of the synchronization parameter that represents the cumulative probability of a synchronized state between nearest neighbors, as a function of the swimming velocity (see Table S3).
Fig. S1.
Strouhal number as a function of the swimming velocity.
Table S3.
Numbers of experiments for Fig. 3
| 0.77 | 1.17 | 1.57 | 1.94 | 2.34 | 2.74 | 3.14 | 3.51 | 4.0 | 4.2 | |
| Experiment type | BL/s | BL/s | BL/s | BL/s | BL/s | BL/s | BL/s | BL/s | BL/s | BL/s |
| Nontet | 2 | 1 | 3 | 2 | 2 | 2 | 2 | 2 | ||
| Quintet | 8 | 4 | 4 | 4 | 4 | |||||
| Quartet | 5 | 4 | 5 | 5 | 6 | |||||
| Triplet | 5 | 5 | 5 | 5 | 5 | |||||
| Pair | 8 | 8 | 8 | 8 | 8 | |||||
| Single | 1 | 1 | 1 | 1 | 1 |
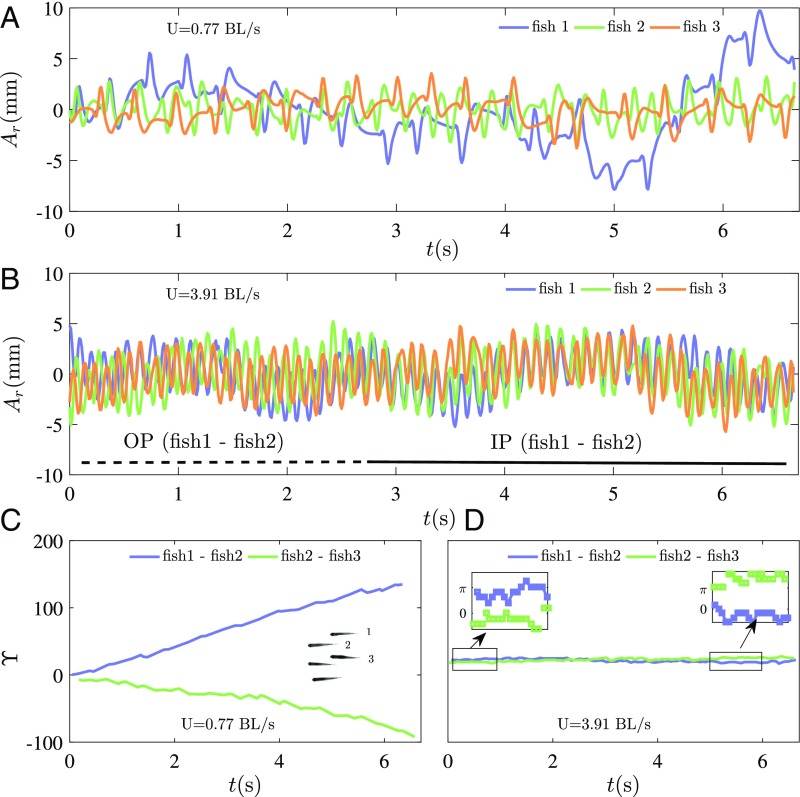
The other remarkable feature observed in the fish schools is the change of synchronization of tail-beating kinematics between neighboring individuals within a group. The time series of the caudal fin tip motion for three neighboring fish in a group of five are reported in Fig. 4, at low swimming velocity (close to the natural speed of free swimming; Fig. 4A) and high swimming velocity (representing a high-energy-demanding situation; Fig. 4B). Fish swimming together at their free-ranging speed do not show any sign of correlation in their respective kinematics; the phase differences in Fig. 4C, between one individual (fish 2) and its two nearest neighbors (fish 1 and 3), show a constant drift (almost linear) with time, typical of uncorrelated dynamics (25). Fast swimmers, on the contrary, show strong synchronized dynamics (Fig. 4B), characterized by in-phase (IP) and out-of-phase (OP) modes. In contrast to the low-speed regime, the synchronization is confirmed here by constant phase differences (25) all along the measurement time (Fig. 4D). The phase difference is calculated by a peak identification routine on each time series of the tail-beating amplitude. The synchronization effect for H. bleheri was already pointed out in a study with fish pairs (16), in which observations of a large set of experiments showed that >90% of the fish pairs studied were synchronized when swimming at high speed. Fig. 3D presents the synchronization rate as a function of the swimming velocity, where and are the total number of synchronized and nonsynchronized states, respectively. This demonstrates that high synchronization is a general behavior in schools sustaining high swimming gaits. It also supports the idea of considering local interactions within a subgroup of nearest neighbors as the minimal unit to describe the dynamics of larger schools.
Fig. 4.
Examples of time series of the tail tip amplitude for one given individual (fish 2) within the school and its two nearest neighbors (fish 1 and 3). (A and B) Low (A) and high (B) swimming speed. The in-phase (IP) and out-of-phase (OP) swimming regimes are also shown. (C and D) Evolution of the phase difference between fish 2 and its two nearest neighbors (fish 1 and 3) showing a nonsynchronized state () at low swimming speed (C) and strongly synchronized state () at high swimming speeds (D). D, Insets show zooms in the case of synchronized swimming that are either around (for IP synchronization) or (for OP synchronization).
Discussion
We have shown that schools of the cohesive fish species H. bleheri sustaining a high swimming speed gather in a phalanx configuration, rather than in the diamond pattern described as the most efficient by a 2D hydrodynamics idealized view. These phalanx configurations actually appear to be efficient, if one measures the advantage of schooling by the net decrease in the tail-beating frequency observed for fish swimming in a group, when compared with the case of a single fish swimming alone (Fig. 3). The tail-beat frequency is directly correlated with the oxygen consumption rate of the fish—oxygen consumption being an indirect measure of metabolic rate and energy consumption (26–34). Therefore, the decrease in tail-beat frequency can be considered as a decrease in energy consumption. Indeed, while at low velocities, the benefit is barely observable, it is significant at the more energy-demanding, higher-velocity regimes, where almost all schooling occurs in phalanx formation. Moreover, the occurrence of the phalanx formation is correlated with the observation of local kinematic synchronization of each swimmer with its nearest neighbors.
Several arguments can be put forward to understand the formation of an efficient pattern in the H. bleheri schools studied here. Swimming in a packed side-by-side phalanx configuration has been identified by 2D and 3D simulations as a good strategy to optimize thrust or efficiency by using channeling effects, especially at small clearance (0.5 BL) and IP synchronized kinematics of nearest neighbors (7, 8, 35). In particular, Hemelrijk et al. (8) confirmed the advantage of PS and DS configurations over solitary swimming in terms of Froude efficiency. Daghooghi and Borazjani (7) underlined, based in full 3D simulations, that the wakes shed by the swimmers show strong differences with the 2D idealized view at the core of Weihs’ description of the diamond pattern (5). They reported that the primary vortices shed by the fish tail break down rapidly into smaller vortices, leading to a rather disorganized wake structure with very low chance for constructive vortex interaction. In the phalanx configuration, on the other hand, the case of OP synchronization between neighbors—which has already been noted to be slightly preferred to IP synchronization in previous experiments with fish pairs (16)—can be expected to be beneficial in terms of propulsive performance owing to the jet-like profile produced by two neighboring fish. The latter mechanism has been demonstrated in the literature by using numerical simulations (36) and experiments with model swimmers (37). In summary, synchronization either IP or OP should give an advantage to fish swimming in groups, especially when nearest neighbors come closer to each other. The prevalence of phalanx configurations at high swimming velocities observed in the present experiments, together with their correlation to a high rate of kinematic synchronization between nearest neighbors, confirms that these physical mechanisms are indeed at play in a real fish school.
Additionally, as evoked above, the possibility of taking advantage of a diamond pattern might be uncertain for actual swimming animals: Fish must maintain a perfectly ordered configuration. These issues were already remarked on by Weihs (5) and have been the center of criticisms in previous studies (19, 38, 39), because achieving the required conditions to maintain such idealized diamond patterns may be too constraining for a school. Choosing a phalanx pattern appears to be the selected strategy to optimize swimming performance, combining social and mechanical priorities together. It remains to be confirmed if the conclusions reached here for H. bleheri is valid for other species and other experimental conditions.
Materials and Methods
Animals and Housing.
Red nose tetra fish, H. bleheri, of body length in the range 3.5–4 cm long and height 0.5–0.6 cm, were procured from a local aquarium supplier (anthias.fr). The fish were reared in a 60-L aquarium tank with water at a temperature between 26 and 27 °C, and they were fed five to six times a week with commercial flake food. The experiments performed in this study were conducted under the authorization of the Buffon Ethical Committee (registered to the French National Ethical Committee for Animal Experiments no. 40).
Flow Characterization in the Water Tunnel.
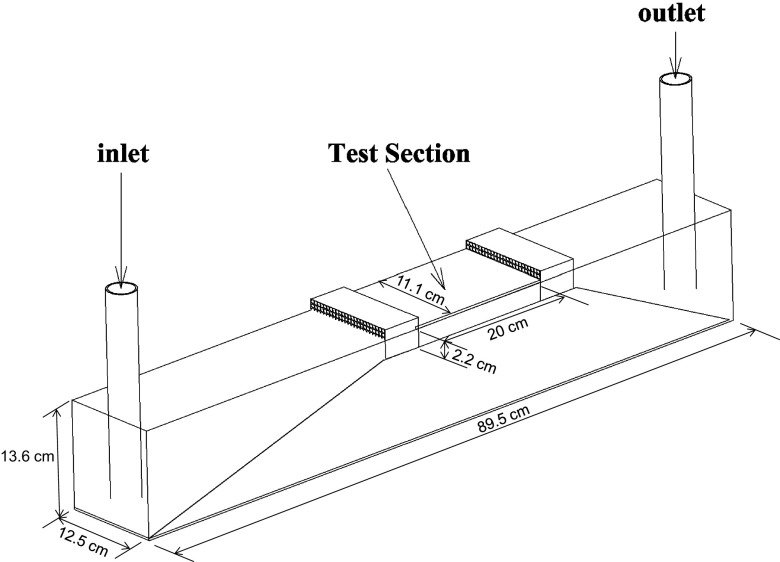
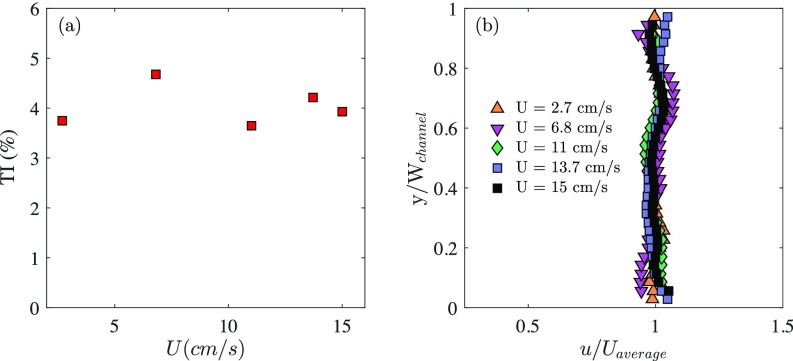
A shallow-water tunnel with a test section of 2.2 cm depth and a swimming area of 20 cm 15 cm (Fig. S2) was used for the experiments. The flow rate could be varied from 4 to 22 L per minute, resulting in an average velocity , where is the cross-section, in the range between 2.7 cm to 15 cm. To characterize the flow in the channel, particle image velocimetry measurements were carried out in the midplane of the channel. The mean turbulence intensity (TI) was found to be between 3 and 5% and it seemed to be independent of the flow rate (Fig. S3A). Fig. S3B shows the velocity profile in the midsection of the channel, which also remained unchanged for the different flow rates. We note also that the velocity profile was rather flat, with the wall effect region being limited to a distance <3 mm. The minimum distance between the fish and the wall was, in the most confined case (the nontet case), 7 times the size of the wall effect region. This distance was >14 times the size of the wall effect region for the other groups. The wall effect is therefore negligible.
Fig. S2.
Schematic diagram of the swimming channel. An external pump drives the flow, which is directed toward the test section after a convergent ramp and through a honeycomb section to minimize swirling motions. A second honeycomb delimits the test section downstream.
Fig. S3.
(A) Turbulence intensity (TI) as a function of the average flow velocity in the channel. It can be seen that the turbulence in the flow remains fairly constant over the flow rate range explored and remains at <5%. (B) The velocity profile in the x direction at midheight and midsection of the channel, u(y), is rather flat and also does not change with the flow rate.
Experimental Procedure.
Before starting each run, the fish were transferred with a hand net from the rearing tank to the test section of the channel without any flow. The fish were left idle for 1 h in the channel without any flow to get habituated to the shallow test section. Each of the swimming tests was carried out for 10 s. After each test with a fish group, the fish were allowed to relax for >20–30 min in the channel without flow. After a complete set of experiments (consisting typically of 10 tests at 10 different velocities), each group was transferred to another tank. No individual fish has participated in any other group.
Visualization.
The fish kinematics were recovered from top-view visualizations at 100 frames per second. An in-house code, written in Matlab, was used to track the fish and extract boundary points and midline kinematics from the movies. For each image, the background was subtracted from the image to get the silhouette. Then, the processed image was binarized by using Otsu’s method (40). The boundary points on each side of the fish and the head were identified for each fish. Finally, we obtained the midline, equidistant from the lateral boundaries of each fish. Thus, we obtained for each fish its full spatiotemporal evolution. For 3D tracking, we modified the 3D tracking software by Hedrick (41) and made it automated to meet our requirements. Images from two side cameras were taken. The centroid of each fish eye was then tracked from the binarized image. The 3D reconstruction was then carried out by using direct linear transformation, which converted 2D camera-space coordinates into 3D global coordinates.
Data Statistics.
The tail-beating kinematics was extracted for each fish in a group. The average and SD were computed for each group and each velocity. All points presented in Fig. 3 are thus averaged quantities with several experiments per point. For instance, the data points for the frequency are given by over the number of individuals and the different runs, where the brackets denote a time average and is the number of individuals within the school. Thus, we obtained a single value of the frequency for each group size and swimming speed.
Supplementary Material
Acknowledgments
We thank the personnel from the Laboratoire de Physique et Mécanique des Milieux Hétérogènes workshop, in particular Tahar Amorri and Xavier Benoit-Gonin, for their technical help in the construction of the swimming channel, as well as Laurette Tuckerman for her careful reading of the manuscript. I.A. was supported by a PhD fellowship from Université Sorbonne Paris Cité.
Footnotes
The authors declare no conflict of interest.
This article is a PNAS Direct Submission.
This article contains supporting information online at www.pnas.org/lookup/suppl/doi:10.1073/pnas.1706503114/-/DCSupplemental.
References
- 1.Sumpter DJT. The principles of collective animal behaviour. Philos Trans R Soc B Biol Sci. 2006;361:5–22. doi: 10.1098/rstb.2005.1733. [DOI] [PMC free article] [PubMed] [Google Scholar]
- 2.Czirók A, Vicsek M, Vicsek T. Collective motion of organisms in three dimensions. Physica A. 1999;264:299–304. [Google Scholar]
- 3.Vicsek T, Zafeiris A. Collective motion. Phys Rep. 2012;517:71–140. [Google Scholar]
- 4.Shaw E. Schooling fishes. Am Sci. 1978;66:166–175. [Google Scholar]
- 5.Weihs D. Hydromechanics of fish schooling. Nature. 1973;241:290–291. [Google Scholar]
- 6.Tsang ACH, Kanso E. Dipole interactions in doubly periodic domains. J Nonlinear Sci. 2013;23:971–991. [Google Scholar]
- 7.Daghooghi M, Borazjani I. The hydrodynamic advantages of synchronized swimming in a rectangular pattern. Bioinspir Biomim. 2015;10:056018. doi: 10.1088/1748-3190/10/5/056018. [DOI] [PubMed] [Google Scholar]
- 8.Hemelrijk CK, Reid DAP, Hildenbrandt H, Padding JT. The increased efficiency of fish swimming in a school. Fish Fish. 2015;16:511–521. [Google Scholar]
- 9.Maertens AP, Gao A, Triantafyllou MS. Optimal undulatory swimming for a single fish-like body and for a pair of interacting swimmers. J Fluid Mech. 2017;813:301–345. [Google Scholar]
- 10.Mittal R, Dong H, Bozkurttas M, Lauder GV, Madden P. Locomotion with flexible propulsors: II. Computational modeling of pectoral fin swimming in sunfish. Bioinspir Biomim. 2006;1:S35–S41. doi: 10.1088/1748-3182/1/4/S05. [DOI] [PubMed] [Google Scholar]
- 11.Zhang Z, Gil AJ, Hassan O, Morgan K. The simulation of 3d unsteady incompressible flows with moving boundaries on unstructured meshes. Comput Fluid. 2008;37:620–631. [Google Scholar]
- 12.Adkins D, Yan YY. CFD simulation of fish-like body moving in viscous liquid. J Bionic Eng. 2006;3:147–153. [Google Scholar]
- 13.Borazjani I, Sotiropoulos F, Tytell ED, Lauder GV. Hydrodynamics of the bluegill sunfish c-start escape response: Three-dimensional simulations and comparison with experimental data. J Exp Biol. 2012;215:671–684. doi: 10.1242/jeb.063016. [DOI] [PubMed] [Google Scholar]
- 14.Kern S, Koumoutsakos P. Simulations of optimized anguilliform swimming. J Exp Biol. 2006;209:4841–4857. doi: 10.1242/jeb.02526. [DOI] [PubMed] [Google Scholar]
- 15.Faucher K, Parmentier E, Becco C, Vandewalle N, Vandewalle P. Fish lateral system is required for accurate control of shoaling behaviour. Anim Behav. 2010;79:679–687. [Google Scholar]
- 16.Ashraf I, Godoy-Diana R, Halloy J, Collignon B, Thiria B. Synchronization and collective swimming patterns in fish (Hemigrammus bleheri) J R Soc Interf. 2016;13:20160734. doi: 10.1098/rsif.2016.0734. [DOI] [PMC free article] [PubMed] [Google Scholar]
- 17.Newlands NK, Porcelli TA. Measurement of the size, shape and structure of Atlantic bluefin tuna schools in the open ocean. Fish Res. 2008;91:42–55. [Google Scholar]
- 18.Partridge BL, Johansson J, Kalish J. The structure of schools of giant bluefin tuna in Cape Cod bay. Environ Biol Fishes. 1983;9:253–262. [Google Scholar]
- 19.Abrahams MV, Colgan PW. Risk of predation, hydrodynamic efficiency and their influence on school structure. Environ Biol Fishes. 1985;13:195–202. [Google Scholar]
- 20.Eggers DM. The nature of prey selection by planktivorous fish. Ecology. 1977;58:46–59. [Google Scholar]
- 21.Olson FCW. The survival value of fish schooling. J Conseil. 1964;29:115–116. [Google Scholar]
- 22.Gazzola M, Argentina M, Mahadevan L. Scaling macroscopic aquatic locomotion. Nat Phys. 2014;10:758–761. [Google Scholar]
- 23.Vandenberghe N, Zhang J, Childress S. Symmetry breaking leads to forward flapping flight. J Fluid Mech. 2004;506:147–155. [Google Scholar]
- 24.Taylor GK, Nudds RL, Thomas ALR. Flying and swimming animals cruise at a Strouhal number tuned for high power efficiency. Nature. 2003;425:707–711. doi: 10.1038/nature02000. [DOI] [PubMed] [Google Scholar]
- 25.Quiroga RQ, Kraskov A, Kreuz T, Grassberger P. Performance of different synchronization measures in real data: A case study on electroencephalographic signals. Phys Rev E. 2002;65:041903. doi: 10.1103/PhysRevE.65.041903. [DOI] [PubMed] [Google Scholar]
- 26.Clarke A, Johnston NM. Scaling of metabolic rate with body mass and temperature in teleost fish. J Anim Ecol. 1999;68:893–905. doi: 10.1111/j.1365-2656.2010.01672.x. [DOI] [PubMed] [Google Scholar]
- 27.Herskin J, Steffensen J. Energy savings in sea bass swimming in a school: Measurements of tail beat frequency and oxygen consumption at different swimming speeds. J Fish Biol. 1998;53:366–376. [Google Scholar]
- 28.Johansen J, Vaknin R, Steffensen JF, Domenici P. Kinematics and energetic benefits of schooling in the labriform fish, striped surfperch Embiotoca lateralis. Mar Ecol Prog Ser. 2010;420:221–229. [Google Scholar]
- 29.Killen SS, Marras S, Steffensen JF, McKenzie DJ. Aerobic capacity influences the spatial position of individuals within fish schools. Proc R Soc B. 2012;279:357–364. doi: 10.1098/rspb.2011.1006. [DOI] [PMC free article] [PubMed] [Google Scholar]
- 30.Lowe C. Metabolic rates of juvenile scalloped hammerhead sharks (Sphyrna lewini) Mar Biol. 2001;139:447–453. [Google Scholar]
- 31.Marras S, et al. Fish swimming in schools save energy regardless of their spatial position. Behav Ecol Sociobiol. 2015;69:219–226. doi: 10.1007/s00265-014-1834-4. [DOI] [PMC free article] [PubMed] [Google Scholar]
- 32.Steinhausen MF, Steffensen JF, Andersen NG. Tail beat frequency as a predictor of swimming speed and oxygen consumption of saithe (Pollachius virens) and whiting (Merlangius merlangus) during forced swimming. Mar Biol. 2005;148:197–204. [Google Scholar]
- 33.Webber D, Boutilier R, Kerr S, Smale M. Caudal differential pressure as a predictor of swimming speed of cod (Gadus morhua) J Exp Biol. 2001;204:3561–3570. doi: 10.1242/jeb.204.20.3561. [DOI] [PubMed] [Google Scholar]
- 34.Webber D, McKinnon G, Claireaux G. Electronic Tagging and Tracking in Marine Fisheries. Springer; New York: 2001. Evaluating differential pressure in the european sea bass (Dicentrarchus labrax) as a telemetered index of swimming speed; pp. 297–313. [Google Scholar]
- 35.Dong GJ, Lu XY. Characteristics of flow over traveling wavy foils in a side-by-side arrangement. Phys Fluids. 2007;19:057107. [Google Scholar]
- 36.Gazzola M, Chatelain P, van Rees WM, Koumoutsakos P. Simulations of single and multiple swimmers with non-divergence free deforming geometries. J Comput Phys. 2011;230:7093–7114. [Google Scholar]
- 37.Raspa V, Godoy-Diana R, Thiria B. Topology-induced effect in biomimetic propulsive wakes. J Fluid Mech. 2013;729:377–387. [Google Scholar]
- 38.Partridge BL, Pitcher TJ. Evidence against a hydrodynamic function for fish schools. Nature. 1979;279:418–419. doi: 10.1038/279418a0. [DOI] [PubMed] [Google Scholar]
- 39.Pitcher TJ, Parrish JK. Functions of shoaling behaviour in teleosts. In: Pitcher TJ, editor. Behaviour of Teleost Fishes. 2nd Ed. Chapman and Hall; London: 1993. pp. 363–439. [Google Scholar]
- 40.Otsu N. A threshold selection method from gray-level histograms. Automatica. 1975;11:23–27. [Google Scholar]
- 41.Hedrick TL. Software techniques for two-and three-dimensional kinematic measurements of biological and biomimetic systems. Bioinspir Biomim. 2008;3:034001. doi: 10.1088/1748-3182/3/3/034001. [DOI] [PubMed] [Google Scholar]
Associated Data
This section collects any data citations, data availability statements, or supplementary materials included in this article.


