Significance
We found that TGGAA DNA repeats, which are involved in the neurological disease spinocerebellar ataxia 31, are capable of assuming two different hairpin structures depending on repeat number parity. We determined the interconversion kinetics by single-molecule spectroscopy and probed the interconversion mechanism through elucidation of the TGGAA repeat stem structure. Our results suggest that the two hairpin structures interconvert through motion slippage, and the process can be explained by the overall stem stability and local destabilization of the kinked GGA motif. Divalent cations and stem length affected the equilibrium and kinetics of slippage. Our findings suggest a mechanism by which a binary dynamic property of DNA repeats may affect repeat expansion and may be applicable to other repetitive DNA systems.
Keywords: DNA tandem repeats, DNA slippage, single-molecule spectroscopy, X-ray crystallography
Abstract
Repetitive DNA sequences are ubiquitous in life, and changes in the number of repeats often have various physiological and pathological implications. DNA repeats are capable of interchanging between different noncanonical and canonical conformations in a dynamic fashion, causing configurational slippage that often leads to repeat expansion associated with neurological diseases. In this report, we used single-molecule spectroscopy together with biophysical analyses to demonstrate the parity-dependent hairpin structural polymorphism of TGGAA repeat DNA. We found that the DNA adopted two configurations depending on the repeat number parity (even or odd). Transitions between these two configurations were also observed for longer repeats. In addition, the ability to modulate this transition was found to be enhanced by divalent ions. Based on the atomic structure, we propose a local seeding model where the kinked GGA motifs in the stem region of TGGAA repeat DNA act as hot spots to facilitate the transition between the two configurations, which may give rise to disease-associated repeat expansion.
DNA replication is a crucial process in all living organisms. Mishaps in the replication process generally lead to deleterious consequences but also drive biological evolution (1). Changes in the number of tandem copies of a specific DNA sequence within the genome are associated with devastating neuropathies and various types of cancer (2, 3). On the other hand, these changes also help shape normal genomic features such as microsatellite polymorphism, which are often used as markers for population biology studies (4).
The unit sizes of repetitive DNA sequences involved in repeat number changes range from a single base (e.g., microsatellites) to dodecanucleotides (12 bases, e.g., in progressive myoclonic epilepsy type 1) (5, 6). DNA slippage is believed to be a primary mechanism driving the change in repeat number of various unit sizes. Repetitive DNA sequences often form alternative structures such as bulges and hairpin loops in addition to canonical DNA conformations (7, 8). A repeat unit may slip between being part of a hairpin loop, a bulge, or a duplex in a dynamic fashion, which may alter the course of normal cellular DNA chemistry and ultimately lead to repeat expansion associated with neurological diseases (9). (TGGAA)n repeats, for example, may form noncanonical structures such as a hairpin arm (10, 11) or an antiparallel duplex (12). Expansion of this pentanucleotide sequence has been associated with spinocerebellar ataxia 31 (SCA31), an adult-onset autosomal-dominant neurodegenerative disorder (13).
In this article, we probed the conformational heterogeneity and stability of hairpins composed of repetitive TGGAA sequences using single-molecule fluorescence resonance energy transfer [single-molecule FRET (smFRET)] spectroscopy and X-ray crystallography as primary tools. Remarkably, we were able to detect two distinct hairpin configurations, with each being dominant under different repeat number parity (even or odd). The ability to convert between the two configurations is dependent on the number of repeats and can be modulated by the presence of divalent ions. Only sequences with large even number of repeats are able to interconvert between the two forms. Based on our structural studies, we propose a local seeding model where the central kinked GGA motifs in the (TGGAA)n DNA repeat act as hot spots to facilitate the transition between the two parity-dependent configurations. Our findings suggest a mechanism by which a binary dynamic property of DNA repeats may affect repeat expansion and may be applicable to other repetitive DNA systems.
Results
d(TGGAA)3 and d(TGGAA)4 Adopt Distinct Structural Configurations.
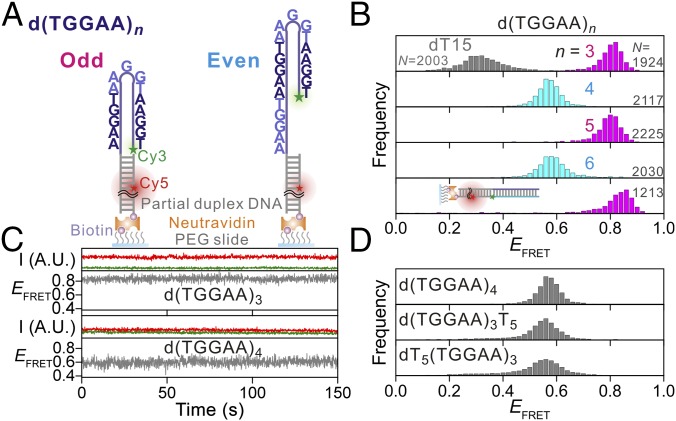
A scheme of the configurations probed by our smFRET assay is shown in Fig. 1A. We found that d(TGGAA)3 folds into a hairpin structure with the two ends of the single-stranded oligonucleotide being brought into close proximity, corroborated by the high EFRET value (∼0.8) compared with the value of 0.3 for the single-stranded dT15 control, which does not form secondary structures (Fig. 1B). The end-to-end alignment was further confirmed by the very similar EFRET observed when a complementary strand labeled with Cy3 at the 3′ end was annealed to our construct (Fig. 1B, Bottom). At room temperature, the time-dependent EFRET traces of d(TGGAA)3 remained static over a 2-min observation window, suggesting that the end-to-end hairpin conformation was very stable and without distinguishable conformational isomers (Fig. 1C).
Fig. 1.
Structural characterization of d(TGGAA)n using single-molecule FRET. (A) Illustrations of the single-molecule assay used in this experiment. The green and red stars represent the donor (Cy3) and acceptor (Cy5) labeling sites, respectively. (B) EFRET histograms of d(TGGAA)3–6 (colored) and the assay used as a caliper of the end-to-end alignment (cartoon in Bottom). The EFRET histogram of secondary structure-free dT15 is overlaid as a gray histogram for comparison. (C) Representative EFRET time traces for d(TGGAA)3 and d(TGGAA)4. The green and red curves are intensities of the Cy3 and Cy5 fluorescence signals, respectively. The gray curves represent the EFRET (unitless). The vast majority of the traces, including those not shown here, are virtually stable at a single EFRET state. I, intensity; A.U., arbitrary unit. (D) EFRET histograms of d(TGGAA)4 and mutation assays for simulating the hairpin with overhang structures. N denotes the number of molecules used for building the histogram.
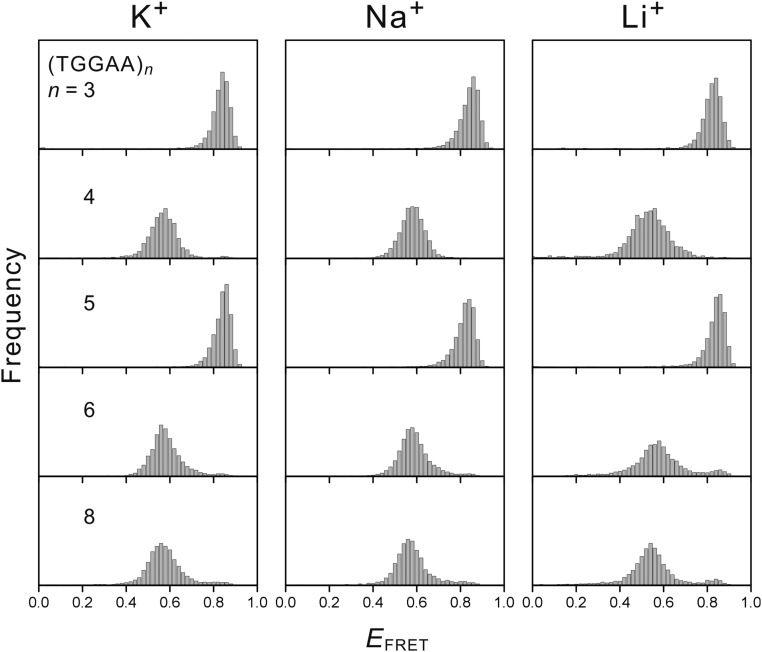
However, we observed a substantial drop in the EFRET value (∼0.8 to ∼0.6; Fig. 1B) for the even-numbered repeat d(TGGAA)4 compared with that of odd-numbered d(TGGAA)3, indicating the presence of an offset between the two termini of d(TGGAA)4. The EFRET value was still significantly higher than that of dT15 (Fig. 1B), suggesting that the stem region where base pairing occurs was still present in d(TGGAA)4. Similar to d(TGGAA)3, the time-dependent EFRET traces remained constant for d(TGGAA)4 (Fig. 1C), suggesting that this offset configuration was also stable at room temperature. To control for the possibility of G-quadruplex formation, we conducted the same experiments in buffer solutions containing 150 mM potassium (which favors G-quadruplex formation), sodium, or lithium (which inhibits G-quadruplex formation) cations and observed similar behavior (Fig. S1), suggesting that G-quadruplex formation is not likely to happen under our experimental conditions. We also generated two mutants, dT5(TGGAA)3 and d(TGGAA)3T5, where the 5′- and 3′-terminal dTGGAA were changed to dTTTTT, respectively, and used these mutants as calipers to measure the offset in d(TGGAA)4. The good agreement between the EFRET values of d(TGGAA)4 and those of the two mutants suggests that the terminal dTGGAA adopts the random coil state of dTTTTT, indicating that the offset is caused by the presence of a single dTGGAA overhang (Fig. 1D).
Fig. S1.
FRET histogram of (TGGAA)n (n = 3, 4, 5, 6, and 8) in buffer solutions containing 150 mM of potassium, sodium, or lithium. No obvious cation dependence was found.
TGGAA Repeat Number Parity Determines the Preferred Configuration.
The observation of two distinct EFRET values in the d(TGGAA)3 and d(TGGAA)4 repeats led us to undertake a systematic study of oligonucleotides containing different numbers of TGGAA repeats. Remarkably, we found that the EFRET oscillated between ∼0.8 and ∼0.6 depending on the repeat number parity (Fig. 1B). Lower EFRET values corresponding to the overhang configuration were exclusively observed for oligonucleotides with even repeat numbers.
We have compared the binding affinity of dTGGAA to another dTGGAA versus to the fully complementary sequence dTTCCA by surface plasmon resonance (SPR) (Fig. 2 A and B). The higher association and lower dissociation rates of the fully complementary duplex formation compared with those of dTGGAA repeat duplex formation, suggesting that the dTGGAA repeat duplex is less stable than the fully complementary duplex. This allowed the determination of the relative stabilities of the hairpin structures in relation to the number of repeats with a kinetic competition assay using complementary oligonucleotides as competitors (Fig. 2C). We recorded the time-dependent EFRET histograms (Fig. 2D) of oligonucleotides containing different number of repeats and converted these to population fractions (Fig. 2E), which were then used to extract the kinetic rates (Fig. 2F). Hairpins that consisted of even number of repeats were more prone to melt and form a duplex in our assay (Fig. 2F, Inset), which suggests that the energy barrier between the canonical duplex and the overhang configuration is lower than that between the duplex and the end-to-end configuration.
Fig. 2.
Kinetic competition experiment using complementary strands. (A) SPR sensorgram of DNA–DNA interaction between immobilized dG(TGGAA)2G and the ligand dC(TGGAA)2C at various ligand concentrations. (B) Same as A but with dC(TTCCA)2C as the ligand instead. (C) Illustration of the competition assay. Excess amount of d(TTCCA)n oligonucleotides was added to the d(TGGAA)n single molecule assay. Opening of the looped structure and formation of duplex DNA in the product state increases the distance between the two labeling sites (marked as red and green stars), resulting in low EFRET. (D) Time-dependent EFRET histograms of d(TGGAA)4 + d(TTCCA)4. (E) Representative time evolutions of the fraction of folded d(TGGAA)4 at various concentrations. The fraction was obtained using the population fraction with EFRET greater than 0.27. Single-exponential fits are overlaid as solid lines. (F) Concentration dependence of the apparent kinetic rate constants obtained for different number of repeats. Linear fits are overlaid as solid lines. The forward rate constants, obtained from the slopes of the linear fits, are shown in the inset. Error bars represent SDs of three individual experiments.
dTGGAA Repeats Form a Kinked Antiparallel Duplex.
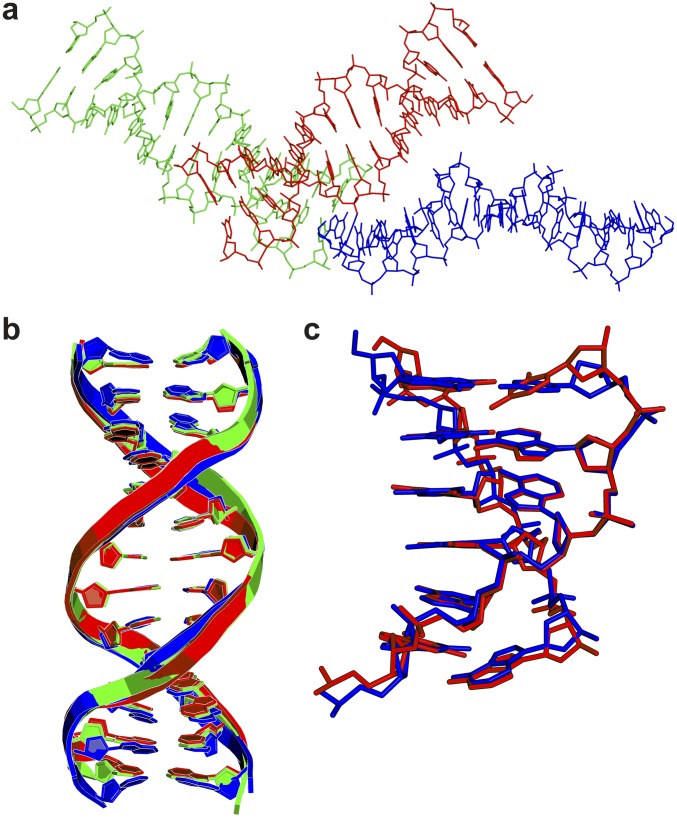
To provide insight into the hairpin formation of TGGAA repeat at the stem region, we solved the crystal structure of dG(TGGAA)2C at a resolution of 2.58 Å by multiple-wavelength anomalous diffraction (MAD) using a brominated oligonucleotide (Table S1). The rmsd between the crystal and NMR sructures is 1.98 Å, indicating that they are overall similar. The oligonucleotide self-assembles into an antiparallel duplex corresponding to the stem region of the hairpin conformations of dTGGAA repeats. Each duplex contains two zipper cores formed by the two d(TGGAA)2 motifs from each strand. The central region of each zipper core comprises a double-stranded intercalated motif in which the two strands of the duplex intersect and are held together by hydrogen bonds from G:A homopurine base pairs and two intercalated G bases (Fig. 3A). An unpaired guanosine base in each dTGGAA repeat from one strand intercalates with another unpaired guanosine base from the opposite strand to form a guanine zipper, which in turn stacks with the guanosine bases of the flanking sheared G:A base pairs on both sides to form a stable continuous G4 stack (Fig. 3 A–C). The exocyclic NH2 at C2 of the unpaired guanine and the cross-strand backbone phosphate oxygen atoms form unique hydrogen bonds that may stabilize the cross-strand stacking between the two unpaired guanines in the (GGA)2 motif. Some water molecules not observed in the NMR structure were also found to form hydrogen bonds with the guanine O6 and N1 atoms, which may further stabilize the overall structure (Fig. 3 D and E) (14). These interactions at the stem may all assist in stabilizing the hairpin structure. For duplexes with short repeats, this stabilization would be more modest than that of a fully cDNA duplex, although longer repeats would provide stronger stabilization (Fig. S2 A and B). The δ torsion angles of most residues are in the trans (t) conformation, with the exception of the unpaired guanosine residues, which are closer to the g− domain. The two strands in the intercalated stem of the DNA duplex (Fig. 3A) twist in a clockwise direction, with the major and minor grooves retaining a right-handed B-helical structure with a narrow minor groove in the GGA region (Fig. 3 B and C). The majority of sugar puckers preserve the C2′-endo or closely related C3′-exo structures, except for the two contiguous unpaired guanines, which adopt various conformations including O1′-endo, C1′-exo, and C4′-exo. In addition, the β torsion angles of the adenine residues in the sheared G:A pairs adopt the g− conformation, which differs from the trans conformation usually observed for A-DNA and B-DNA.
Table S1.
Data collection and refinement statistics of the dG(TGGAA)2C duplex
| Crystal | Native | Inflection point | Peak | High remote |
| λ for data collection, Å | 0.9062 | 0.9195 | 0.9189 | 0.8563 |
| Crystallography data | ||||
| a = b, Å | 61.989 | 62.047 | 63.061 | 62.226 |
| c, Å | 208.840 | 209.071 | 214.405 | 211.781 |
| Space group | P6522 | P6522 | P6522 | P6522 |
| Resolution range, Å | 50–2.58 | 50–3.0 | 50–3.0 | 50–3.0 |
| Average I/σ | 33.11 | 38.00 | 41.95 | 34.64 |
| Rmerge, % | 3.8 | 4.2 | 7.2 | 4.0 |
| Completeness, % | 98.0 | 98.5 | 93.7 | 97.1 |
| Refinement data | ||||
| R-factor/R-free (5% data) | 0.24/0.28 | |||
| rmsd, Å | 0.004 | |||
| rmsd, ° | 0.519 | |||
| # of DNA atoms | 1500 | |||
| # of waters | 14 | |||
| PDB ID | 5GUN |
Fig. 3.
Structure of the dG(TGGAA)2C duplex. (A) Ribbon representation of the duplex structure (Left) and a schematic of important interactions between the two strands (Right). The two strands are colored in gray (G1 to C12, from top to bottom) and yellow (G13 to C24, from bottom to top). Guanines are in green, thymines are in purple, cytosines are in cyan, and adenines are in red. Close-up view of the molecular structure of the dG(TGGAA)2C at the (B) G1 to A6 and (C) G13 to A18 terminal base pair steps. Water molecules and Co(II) ions are shown as light blue and pink balls, respectively. The dashed line represents direct hydrogen bonds and coordinated bonds. (D) Structural detail of the Co(II) (or water)–DNA interactions. (E) Structural detail of the interactions involving hydrogen bonds of mismatched G:A pairs with and without water stabilization.
Fig. S2.
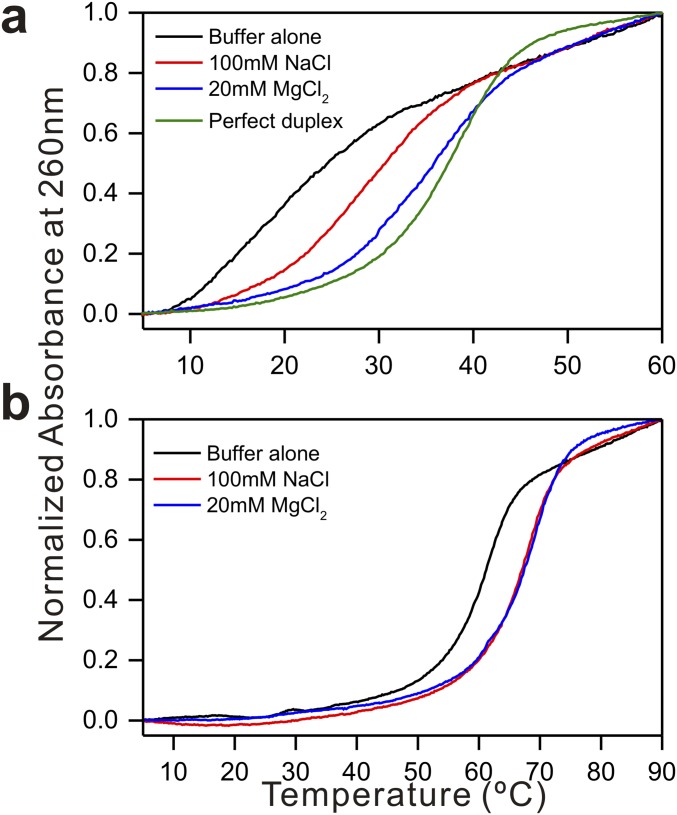
Melting point profiles. (A) dG(TGGAA)2C and (B) d(TGGAA)10 in 50 mM sodium cacodylate buffer at pH 7.3 in the presence and absence of 100 mM NaCl or 20 mM MgCl2. Perfect duplex: d(G(TGGAA)2G/C(TGGAA)2C).
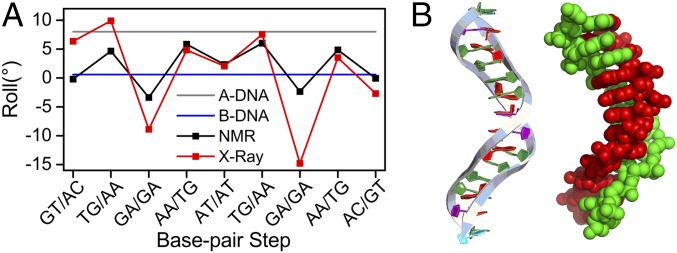
The roll angles between the sheared G3:A22 and G15:A10 base pairs are negative in the crystal structure (Fig. 4A). This results in a sharp kinking of the DNA helix toward the major groove which was not reported in the NMR structure. The sharp kink may act as a hot spot to destabilize the duplex and enable formation of alternative DNA structures (Fig. 4B). In addition, the helical twist angles between the A:T and G:A base pair steps have an average of 50.5° and result in a locally overwound DNA conformation (Fig. S3A). The average twist angle between the A:G base pair steps is back to 35°, which is similar to that of the B-form DNA. The two sheared G:A pairs flanking each zipper core are nonplanar with asymmetric propeller twist angles and form N2–H…N3, and N2–H…N3 hydrogen bonds (Fig. S3B). These two sheared G:A pairs exhibit high buckle angles (∼30°) and stretch (∼4 Å) and shear (∼6 Å) distances (Fig. S3 C–E). The average stacking gap between the A:G pairs separated by two intercalated and unpaired G bases is 11 Å (Fig. S3F). The stacking gap between the A:T pair and the G:A pair is 3 Å.
Fig. 4.
Kinked structure of the dG(TGGAA)2C duplex. (A) Roll angles between base pair steps of the duplex. Red and black lines represent values for the crystal and NMR structures[Protein Data Bank (PDB) ID: 103D], respectively. Typical values for A-DNA (gray line) and B-DNA (blue line) are also shown. (B) Side view of the dG(TGGAA)2C crystal structure in ribbon (Left) and space-filled (Right) representations.
Fig. S3.
Comparison of DNA (A) twist, (B) propeller, (C) buckle, (D) stretch, (E) shear, and (F) rise parameters between the crystal and solution NMR structures. Typical values for A-DNA (gray line) and B-DNA (blue line) are also shown.
Conformational Slippage Occurs in Longer TGGAA DNA Repeats.
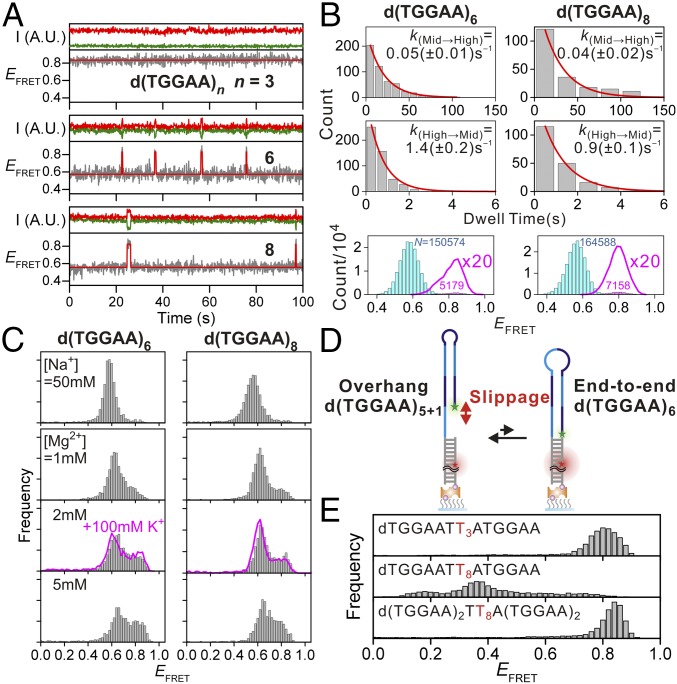
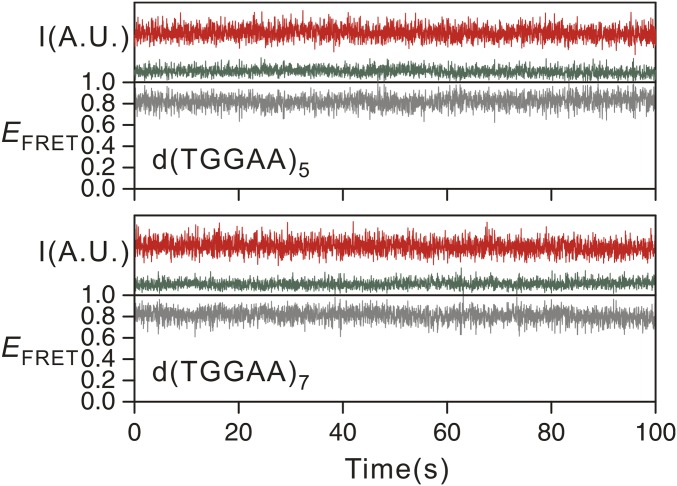
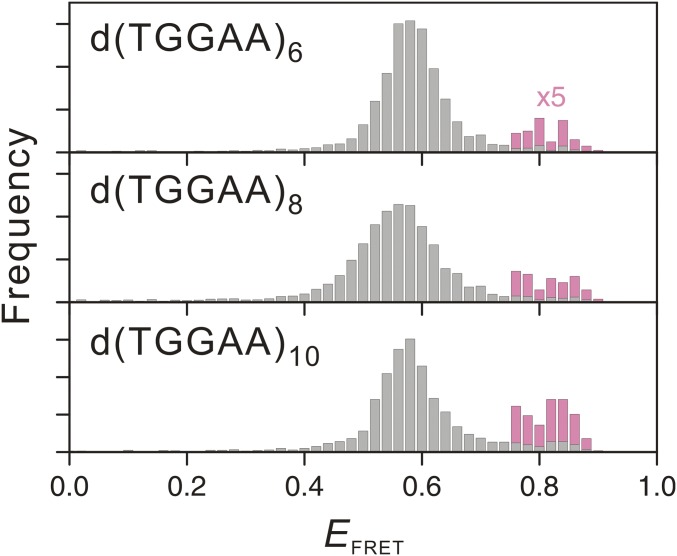
The kinked structure of the stem regions of dTGGAA repeat hairpins suggest a means by which the hairpin may be able to slip between different conformations. Indeed, transient spikes that change the EFRET from ∼0.6 to ∼0.8 were observed for the smFRET traces of d(TGGAA)6 and d(TGGAA)8 (Fig. 5A). In contrast, d(TGGAA)5 and d(TGGAA)7 did not exhibit such transitions at all (Fig. S4). A closer look at the FRET histogram of d(TGGAA)6 and d(TGGAA)8 revealed a small shoulder at EFRET ∼0.8, which matches the end-to-end hairpin configuration (Fig. 5B). The forward (overhang to end-to-end) and backward (vice versa) rate constants of the slippage transitions of d(TGGAA)8 were ∼20% (0.04 ± 0.02 s−1 versus 0.05 ± 0.01 s−1) and ∼35% (0.9 ± 0.1 s−1 versus 1.4 ± 0.2 s−1) slower than those of d(TGGAA)6, respectively, resulting in a slight increase in the fraction of the end-to-end configuration in the longer repeat. This trend continued for d(TGGAA)10 (Fig. S5). Because increasing the number of repeats also allowed the formation of longer and hence more stable stem regions, we suggest that stabilization of the stem region may play a key role in allowing the formation of the end-to-end configuration.
Fig. 5.
Structural dynamics of d(TGGAA)6. (A) Representative EFRET time traces (lower panel in each set of panels) in 50 mM Na+ and the corresponding donor (green) and acceptor (red) signal intensities (upper panel in each set of panels) for d(TGGAA)3,6,8. Except for the virtually static trace of d(TGGAA)3, multiple sudden increases in EFRET can be clearly observed. The time traces were fit to a hidden Markov algorithm assuming a two-state model and are overlaid in red. I, intensity; A.U., arbitrary unit. More than 85% (n = 6) and 55% (n = 8) of valid traces longer than 30 s showed similar transitions, whereas the rest remained steady. (B) Dwell time histograms of the low (EFRET = 0.6; Left) and the high (EFRET = 0.8; Right) EFRET states. Forward and backward kinetic rate constants of the slippage process were obtained by fitting the histograms to a single-exponential decay model (red lines). EFRET population histograms of d(TGGAA)6,8 are shown in Bottom. Magnified views (20×) of the high EFRET population are shown as red lines. The numbers (N) indicate frame counts of each state, which are color coded. Data were obtained by analyzing 208 and 257 molecules for n = 6 and n = 8, respectively. (C) EFRET histogram of d(TGGAA)6,8 under various salt conditions. The fractions of high EFRET (>0.8) increase as Mg2+ concentrations increase. The overlaid red line was obtained in the presence of [K+] = 100 mM and [Mg2+] = 2 mM to mimic physiological conditions. No obvious differences were observed compared with the data obtained in the presence of 2mM Mg2+ alone. (D) Schematic of d(TGGAA)6,8 hairpin slippage. The transient slippage from the overhang to the end-to-end configuration may originate from the formation of an octanucleotide loop which shortens the distance between the dye pair (marked as green and red stars) and leads to a transient increase in EFRET. (E) Effect of loop formation on hairpin stability. (Top) Trinucleotide mutation (GGA→T3) in the loop region of d(TGGAA)3 does not alter hairpin formation. (Middle) Octa-nucleotide mutation (GGAATGGA→T8) in the loop region of d(TGGAA)4 prevents hairpin formation as evidenced by the broad and downshifted EFRET distribution. (Bottom) Octanucleotide mutation (GGAATGGA→T8) in the loop region of d(TGGAA)6 retains stable hairpin formation.
Fig. S4.
Representative EFRET time traces for d(TGGAA)5 and d(TGGAA)7. The green red curves represent the intensities of the Cy3 and Cy5 fluorescence signal, respectively. The gray curves represent the EFRET (unitless). The vast majority of traces, including those not shown here, are virtually stable at one EFRET state. A.U., arbitrary unit; I, intensity.
Fig. S5.
EFRET histograms of d(TGGAA)n, where n = 6, 8, and 10. The overlaid pink bars represent the high EFRET (≥0.75) fraction at 5× magnification.
We also performed the experiments in buffer containing different Mg2+ concentrations to examine the effect of ions on the two configurations in d(TGGAA)6 and d(TGGAA)8. A significant increase in the fraction of the end-to-end configuration was observed with increasing Mg2+ concentration (Fig. 5C), although the overhang configuration was still favored (Fig. 5D). A slight shift toward high EFRET was also observed and is likely due to an apparent charge screening effect (15). In the crystal structure of the dG(TGGAA)2C duplex, a number of Co2+ and water molecules were coordinated to the DNA duplex (Fig. 3 B–E and Table S2) and help stabilize the structure of the stem region. One Co2+ ion was coordinated to the O6 atom of G13 (Fig. 3C), whereas two additional Co2+ ions were bis-coordinated to the O6 oxygen atoms of two consecutive unpaired guanines with an incomplete hydration shell (Fig. 3 B–D). These interactions were not observed in the previous NMR structure. Our results indicate divalent ions are an integral part of the stem and may increase the population of the end-to-end configuration by enhancing stem region stability.
Table S2.
Bridging waters mediating DNA–DNA interstrand interactions
| A chain | Distance, Å | Water | Distance, Å | B chain |
| G69-O6 | 3.1 | W11 | 2.1 | G52-O6 |
| G69-O6 | 3.1 | W11 | 2.1 | G52-O6 |
| G16-O6 | 2.6 | W3 | 3.0/3.5 | G56-O1P/G56-O2P |
Long TGGAA DNA with Even Number of Repeats Form Transient Octaloop Structures During Slippage.
Unlike in the longer d(TGGAA)n with even number of repeats, the end-to-end configuration was not observed in the shorter d(TGGAA)4, indicating that the end-to-end configuration that is potentially formed by an antiparallel dTGGAA/dTGGAA stem, a T:A base pair, and a dGGAATGGA octanucleotide loop is inherently unstable. To examine this hypothesis, we conducted a series of experiments using d(TGGAA)n oligonucleotides containing poly-dT mutations in the loop region (Fig. 5 D and E). We first tested the effect of the size of the loop on the stability of the end-to-end configuration using dTGGAATT3ATGGAA and dTGGAATT8ATGGAA, which have the same length as d(TGGAA)3 and d(TGGAA)4, respectively. Both have the potential to form end-to-end hairpin configurations held together by an identical antiparallel dTGGAA/dTGGAA stem and a T:A base pair but with different loop sizes: 3 nt for dTGGAATT3ATGGAA and 8 nt for dTGGAATT8ATGGAA. Our results show that dTGGAATT3ATGGAA did form a stable hairpin configuration, evident by the sharp EFRET distribution at ∼0.8, whereas dTGGAATT8ATGGAA gave a broad and downshifted EFRET distribution indicative of conformational heterogeneity containing folded and unfolded species. This finding suggests that the octanucleotide loop is less stable than the trinucleotide loop and cannot form a stable state when the stem region contains a single dTGGAA/dTGGAA pair. However, an extended version of the octanucleotide loop oligonucleotide, d(TGGAA)2TT8A(TGGAA)2, which has the same length as d(TGGAA)6 and contains a total of four repeat units in the duplex stem region, was able to reform a stable end-to-end hairpin configuration, suggesting that the extended stem composed of antiparallel d(TGGAA)2/d(TGGAA)2 stabilizes the octaloop hairpin and allows a stationary state to be formed. Long stem regions may be required for stabilization of the octaloop in the end-to-end configurations of the even-numbered repeat sequences, which may explain why slippage motions are only observed for d(TGGAA)6 and longer even-numbered repeat sequences.
Discussion
Many repetitive DNA sequences including trinucleotide, tetranucleotide, and pentanucleotide repeat adopt a variety of noncanonical structures such as hairpin loops and quadruplexes in either the single-stranded or double-stranded state in the cell, which may predispose these repeats to expand (5). For example, single-stranded (CNG)n repeats are able to form hairpin DNA structures that consist of both Watson–Crick base pairs and mismatched base pairs (16, 17). Individual strands of (CCTG)n/(CAGG)n repeats have also been shown to fold into hairpin-like structures with zipper-like composition (18). Transient intrastrand hairpins containing noncanonical structures have also been proposed to promote DNA slippage and are causative factors for DNA expansion (19). We have chosen the pentanucleotide TGGAA repeat, which carries guanine mismatches and zipper-like interactions, as an ideal model system to study the structural and conformational dynamics of repetitive DNA sequences. Owing to its variety of structural interactions, the information garnered from TGGAA DNA repeats may be potentially applied to other DNA repeats containing different sequences. Because dTGGAA repeat expansion is associated with the neurodegenerative disease SCA31 (13), understanding its structural and chemical bases of configuration slippage may also be important in a physiological context.
It has been shown by NMR that dTGGAA tends to form a hairpin with a single G residue in the loop closed by a sheared G:A mismatch (11, 20). Nucleic acids that contain 5′‐GGA/AGG‐5′ or 5′‐GAAA/AAAG‐5′ motifs can form antiparallel duplexes stabilized by unpaired purine bases that extend their stacking interactions until reaching the sheared G:A base pair. The continuous stacking interactions in the purine sequences are the major forces responsible for the stabilization of these DNA conformations. By combining this information with our high-resolution structure of the dTGGAA repeat duplex, the structural basis of the molecular behavior observed in the smFRET experiments becomes clear. For sequences containing an odd number of dTGGAA repeats, the end-to-end configuration is optimal because it forms the highest number of duplex interactions while maintaining the 1-nt loop structure proposed by Zhu et al. (11). In contrast, sequences containing an even number of dTGGAA repeats can either maintain the 1-nt loop structure and leave a dangling overhang or maintain the end-to-end configuration and form octaloop structures (Fig. 5D). For longer even-numbered repeats, the destabilizing effect of the octaloop would be compensated by the stabilizing effect of the long flanking duplexes. The loss of entropic energy from the overhang region may be compensated by the increase in enthalpic energy of the end-to-end configuration duplex interactions. One would thus expect that longer repeats would facilitate the transition to the end-to-end configuration because of the higher number of duplex interactions available. Indeed, we did observe an increase in the fraction of the high EFRET population with increasing even-numbered repeat lengths (Fig. S5). The effect of divalent cations on the population fraction of the end-to-end configuration in d(TGGAA)6 and d(TGGAA)8 further highlights the importance of stem stability in the slippage process. Presence of divalent cations enhances the overall stability of the hairpin by forming a network of interactions with the dTGGAA stem duplex, including an unusual bis coordination to the O6 of two consecutive unpaired guanosines (Fig. 3D). Similar binding modes between metal ions and bases have been observed for Pt and cytosine cross-linked interaction in cisplatin–DNA complex structure (21). This implies that it could be possible to control the slippage process of dTGGAA repeats by metal ions in a manner similar to that proposed for controlling ribozyme activity (22).
Given that both the end-to-end and overhang configurations are accessible by the DNA, the question of how they interconvert remains. One potential model for the conversion is through the complete opening and closing of the hairpin loop. This is unlikely because the stability of the hairpin formed by dTGGAA repeats is very high (Fig. S2B), and the fully open conformation would be inaccessible in a closed system at room temperature. A more viable conversion model is one where the antiparallel dTGGAA repeat duplex sites in the stem region of the hairpin serve as hot spots for duplex melting due to the lower stability of the (GGA)2 motifs and sharp bent conformation of the TGGAA repeats. It has been reported that DNA bending may promote DNA melting and further enable formation of alternative DNA structures (23). This would allow the dissociation of the different strands in the stem region to be initiated at multiple sites by thermal fluctuation and thus lower the energy requirement for duplex melting. We envision that multiple rounds of local unwinding at the hot spot regions followed by rearrangement of the repeat registers, e.g., rearrangement of the duplex between repeats 1 and 5 to a duplex between repeats 2 and 5 with repeat 1 bulging out, to eventually lead to conversion to the alternative conformation. The bulges may propagate during the next few rounds of local unwinding toward the final location of the loop. This local unwinding would defy observation by bulk experiments such as spectrophotometry because most repeats in the sample would remain in the duplex conformation, thus resulting in almost no change to the observable spectrum at a given temperature. Of course, the larger the number of repeats forming the stem duplex, the higher the energy cost to slip the two strands of the stem against each other, and the longer one would have to wait for a slippage event to occur. The retarded forward and backward kinetics of configuration slippage in d(TGGAA)8 compared with d(TGGAA)6 (Fig. 5A) may reflect this fact.
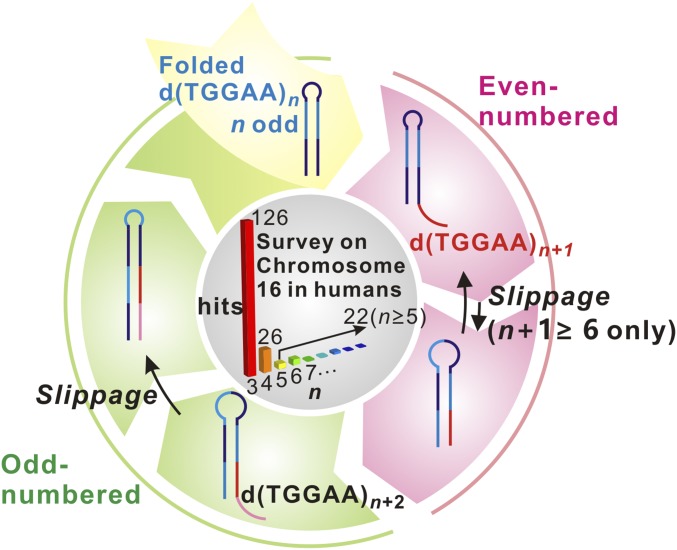
Finally, we propose a consecutive expansion model for dTGGAA tandem repeats involving DNA slippage, illustrated in Fig. 6. Odd-numbered (n) repeats of dTGGAA form end-to-end aligned hairpin structures that have the potential to induce repeat expansion during DNA replication, recombination, or repair (24). The expanded even-numbered n + 1 repeat product forms an overhang-containing hairpin, which can be converted back to a normal DNA duplex in the presence of its complementary strand (Fig. 2). This would temporarily stall the expansion process. However, for n + 1 > 4, configurational slippage would allow the n + 1 product to transiently form end-to-end hairpins capable of initiating a second round of repeat expansion. The odd-numbered n + 2 repeat product would revert back to the energy-favorable hairpin configuration and perpetuate the cycle. The only exception is d(TGGAA)4, or n + 1 = 4, which cannot adopt an end-to-end configuration and may completely halt the expansion. Our bioinformatics analysis of the human chromosome 16, as shown in the center circle of Fig. 6, not only shows the expected high abundance of n = 3 repeats but also shows a sharp inflection in abundance between repeat numbers n = 4 and n = 5. We surmise that sequences with n = 3 and n = 4 are considered safe since they do not undergo slippage and have a large enough margin for error even if other mechanisms result in abnormal expansion. In contrast, while n = 5 also prevents slippage, it provides a narrow error margin because other expansion mechanisms may result in n = 6 repeats which would increase the probability of slippage-induced expansion. This finding implies that nature has devised a way to use the conformational dynamics properties of d(TGGAA)4 to act as a checkpoint against DNA slippage-induced repeat expansion.
Fig. 6.
Proposed model for consecutive expansion of DNA repeats. From top and clockwise, initially odd-numbered d(TGGAA)n DNA folds into a hairpin structure, which has a high repeat expansion propensity. Expansion of one pentanucleotide unit dTGGAA results in a hairpin with an overhang product d(TGGAA)n+1. This product can undergo slippage motion and convert to an end-to-end aligned hairpin with an octanucleotide loop only if the repeat number n + 1 is greater than or equal to 6. Further expansion of the end-to-end aligned d(TGGAA)n+1 results in an odd-numbered d(TGGAA)n+2 product which has forms a hairpin structure again. The cycle can be perpetuated to yield long repeat expansions. A bioinformatics survey of the prevalence of each repeat number (n) in human chromosome 16 is shown in the center. The number of occurrences is shown at the top of the bars.
In conclusion, we have demonstrated that the repetitive DNA sequence dTGGAA is capable of assuming two interconvertible parity-dependent hairpin configurations. We propose a consecutive expansion model as a possible molecular mechanism for TGGAA repeat expansion in diseases such as SCA31. In addition to the biological implications, the divalent cation dependency of the transition suggests a way to control the phenomenon, which may have potential applications in the field of DNA-based sensor development and nanotechnology (25).
Materials and Methods
General materials and methods used in this work are described in Supporting Information. Oligonucleotide sequences are listed in Table S3.
Table S3.
Oligonucleotides used in the single-molecule experiments
| Name | Sequence (5′ to 3′) |
| Handle | Biotin/TGG CGA CGG CA/iCy5/G CGA GGC |
| d(TGGAA)2 | Cy3/ (TGGAA)2 GCCTCGCTGCCGTCGCCA |
| d(TGGAA)3 | Cy3/ (TGGAA)3 GCCTCGCTGCCGTCGCCA |
| d(TGGAA)4 | Cy3/ (TGGAA)4 GCCTCGCTGCCGTCGCCA |
| d(TGGAA)5 | Cy3/ (TGGAA)5 GCCTCGCTGCCGTCGCCA |
| d(TGGAA)6 | Cy3/ (TGGAA)6 GCCTCGCTGCCGTCGCCA |
| d(TGGAA)7 | Cy3/ (TGGAA)7 GCCTCGCTGCCGTCGCCA |
| d(TGGAA)8 | Cy3/ (TGGAA)8 GCCTCGCTGCCGTCGCCA |
| dT5(TGGAA)3 | Cy3/ T5(TGGAA)3 GCCTCGCTGCCGTCGCCA |
| d(TGGAA)3T5 | Cy3/ (TGGAA)3T5 GCCTCGCTGCCGTCGCCA |
| dT10 | Cy3/ T10 GCCTCGCTGCCGTCGCCA |
| dT15 | Cy3/ T15 GCCTCGCTGCCGTCGCCA |
| d(TTCCA)3–6 | (TTCCA)3–6 |
| dTGGAATT3ATGGAA | Cy3/TGGAATTTTATGGAAGCCTCGCTGCCGTCGCCA |
| dTGGAATT8ATGGAA | Cy3/TGGAATTTTTTTTTATGGAAGCCTCGCTGCCGTCGCCA |
| d(TGGAA)2TT8A(TGGAA)2 | Cy3/(TGGAA)2TTTTTTTTTA(TGGAA)2GCCTCGCTGCCGTCGCCA |
| 3GGA_ATA | Cy3/(TGGAA)2TATAA(TGGAA)3GCCTCGCTGCCGTCGCCA |
| 5GGA_ATA | Cy3/(TGGAA)4TATAATGGAAGCCTCGCTGCCGTCGCCA |
| 3&5GGA_ATA | Cy3/(TGGAA)2TATAATGGAATATAATGGAAGCCTCGCTGCCGTCGCCA |
Single-Molecule FRET Experiments.
Detailed descriptions of the experimental setup are available in Supporting Information. The single-molecule FRET apparatus was built following the guidelines in Roy et al. (26). An oligonucleotide labeled with Cy5 dye was tethered on the fluidic chamber surface. The oligonucleotide contained a handle region which was used to anneal a second oligonucleotide containing the complementary handle sequence, followed by the sequence of interest and a Cy3 dye label at the 5′ end. The end-to-end distance of the structure of a DNA sequence of interest can be measured as a function of FRET efficiency, EFRET, given in the following equation (27) and shown in Fig. 1A:
where ID and IA represent the fluorescence intensities of Cy3 and Cy5, respectively. R represents the distance between the two fluorophores, and R0 is the Förster distance of the donor–acceptor pair.
Competition assays using complementary strand hybridization (Fig. 2C) were carried out with static smFRET experiments. Assuming a pseudo–first-order reaction,
the decrease in the hairpin fraction as a function of time (Fig. 2 D and E) can be fit to a single-exponential decay with an apparent decay rate kapp described by the following formula:
The association rate constant kon can then be extracted from the slope of the linear fit to the plot of kapp against complementary oligonucleotide concentrations (Fig. 2F).
Single-molecule time traces extracted from dynamic smFRET experiments were analyzed using HaMMy software package, which employs a hidden Markov algorithm for state identification and dwell time analysis (26). The traces were manually screened to remove the interference of unwanted effects such as early photobleaching or dye molecule instability before the analysis.
Crystallography.
Crystals of dG(TGGAA)2C were obtained from a solution of 1.5 mM single-stranded DNA, 4 mM CoCl2, 50 mM sodium cacodylate buffer (pH 7.0), 1 mM spermine, and 3% 2-methyl-2,4-pentanediol (MPD) at 4 °C using the sitting-drop vapor diffusion method. The 5′ guanine and 3′ cytosine were included to push the equilibrium toward the self-assembly of the antiparallel duplex through the complementary base pairs on the two termini, which favors crystallization. Cylinder-shaped crystals of d[G(TGGAA)2C] appeared after 2 wk. Diffraction data were collected at 100 K using an Advanced Detector Systems Corp. (ADSC) Q315r detector at beamline 13B1 of the National Synchrotron Radiation Research Center (Taiwan). The software package HKL2000 was used to index, integrate, and scale the X-ray diffraction data (28). Multiple-wavelength anomalous diffraction (MAD) data were collected from three wavelengths using a brominated oligonucleotide. The phase was solved with SHELX C/D/E program in the Collaborative Crystallography Project Number 4 Graphical User Interface (CCP4i). The resulting well-defined MAD electron density maps at 2.58-Å resolution were used to build the initial models using MIFit (github.com/mifit/) and structure refinement carried out in Refmac5 (29) using the DNA force field parameters reported by Parkinson et al. (30). Each asymmetric unit contained three similar duplexes with twofold symmetry (Fig. S6). Two different types of contacts are present between the three DNA duplexes in each asymmetric unit: end-to-end and side-to-side interactions, mediated by π–π stacking and hydrogen contacts, respectively (Fig. S6A). Torsion angles were calculated using Curves v5.3 software (31, 32) and w3DNA (33) web server. Crystallographic data are summarized in Table S1.
Fig. S6.
(A) Three independent dG(TGGAA)2C duplexes were found in each asymmetric unit. (B) Superimposition of three independent dG(TGGAA)2C structures from the same asymmetric unit. (C) Superimposition of the top half part of the duplex with the bottom half part of the duplex.
SI Materials and Methods
Chemicals and DNA Oligonucleotides.
All chemicals used were of reagent grade and were obtained from Sigma Chemical Co. Deionized water from a Milli-Q system was used for all experimental procedures. The oligonucleotide concentrations were determined from absorbance measurements at 260 nm using a Hitachi U-2000 spectrophotometer equipped with a quartz cuvette. Synthetic DNA oligonucleotides were purified by gel electrophoresis. Oligomer extinction coefficients were calculated on the basis of the tabulated values for monomer and dimer extinction coefficients.
Detailed Setup for smFRET Experiments.
The partial duplex DNA used for single-molecule experiments were prepared by annealing ∼5 μM each of two single-stranded DNA molecules at 90 °C. One strand contained an 18-nt handle sequence labeled with biotin for surface anchoring at the 5′ end and a Cyanine5 (Cy5) dye molecule at the indicated location (Integrated DNA Technologies, Inc.). The other strand consisted of an amino group labeling site conjugated to the 5′ end through a C6 linker, followed by the sequence of interest and ending in an 18-nt adapter complementary to the handle sequence (Protech). The later strand was then reacted overnight with sulfo-Cyanine3(Cy3)-NHS ester (Lumiprobe) at room temperature, followed by two runs of ethanol precipitation to remove the excess dye before annealing. The annealed partial duplex DNA was diluted to ∼10 pM concentration with wash buffer (20 mM Tris, pH 7.8, 50 mM NaCl) before use.
The fluidic chamber was built by putting a quartz microscope slide and a glass coverslip together with double-side tape. The inner surface of the chamber was pretreated and functionalized with a mixture of polyethylene glycol (PEG, MW = 5000; LaysanBio) and biotinylated PEG (MW = 5000; LaysanBio) and kept in vacuum at −20 °C for later use. Just before the experiment, 0.2 nM of neutravidin (Thermo) was introduced to the chamber to anchor the neutravidin to the biotin-functionalized surface for 2 min and then flushed with wash buffer. The partial duplex DNA of interest was then introduced to the chamber for 2 min to allow tethering of the DNA onto the surface-anchored neutravidin and then flushed with wash buffer. An oxygen scavenger system was included in the setup to avoid blinking of the dye molecule and prolong the lifetime of the dye before photobleaching occurred.
Fluorescence images were acquired on a home-built prism-type total internal reflection microscope. A 532-nm laser (LASOS, DPSSL-532) was directed to the surface of the quartz slide on the fluidic chamber through a prism and created total internal reflection at the interface of the slide and solution. The fluorescence image from the excited molecules of interest was then collected by a water-immersion microscope objective (Nikon CFI Plan Apo VC 60XWI) and guided to a home-built dual view optical setup through a commercial microscope (Nikon Eclipse Ti-S). The donor and acceptor channel of the images were separated by a dichroic beam splitter (Semrock, FF640-FDi01) and projected side by side to an electromultiplied charge couple device (EMCCD) camera (Andor iXon Ultra 897) in the dual-view setup.
For the static smFRET experiments, typically, 20 short video clips of different regions within the fluidic chamber were acquired. Each clip consisted of 30 frames and was recorded into a computer at a rate of ∼30 frames per second. For the last 10 frames of each clip, the excitation laser was switched to another laser at 633 nm (OmicronLaser, LuxX633) to check for the functionality of the Cy5 dye, which served as the basis for the removal of missing or bleached acceptor dye molecules. An averaged image between frame numbers 3 and 12 was used for the static FRET analysis. The single-molecule spots were identified and the FRET values were extracted using a script modified from Roy et al. (26). Histogram visualizations of the FRET values were built using in-house MATLAB scripts.
Complementary strand hybridization kinetics were determined through static smFRET experiments. After the initial images were taken (t = 0), buffer solutions containing the complementary strand (Protech) at various concentrations were introduced to the fluidic chamber, and sets of 20 static smFRET histograms were acquired at set time intervals.
The dynamic smFRET experiments were carried out by acquiring a long video (typically 1,500 frames) at a rate of 10 frames per second. Single-molecule time traces were extracted using a custom script. The traces were then manually checked to reject those containing interference from unwanted photophysics such as early photobleaching or blinking. The valid traces were then analyzed using HaMMy software package for the state identification and dwell time analysis.
Melting Temperature Measurements.
The temperatures that correspond to the half-dissociation of DNA structures (Tm) values for the TGGAA sequence were determined using a JASCO Corp. UV-VIS spectrophotometer. Experiments were performed by ramping the temperature from 5 to 95 °C at a rate of 0.5 °C/min and recording the absorbance at 260 and 295 nm every 30 s. The absorbance curve was fit to a polynomial, and its first derivative with respect to temperature (dA/dT) was used to determine the Tm value.
Surface Plasmon Resonance Binding Analysis.
The affinity, association, and dissociation rate constants of DNA duplexes were determined on a BIAcore 3000A SPR instrument (Pharmacia) equipped with a SensorChip SA5 (Pharmacia). To control the amount of DNA bound to the streptavidin chip surface, the biotinylated oligonucleotide was manually immobilized on the chip surface. Various concentrations of the analyte oligonucleotides (0.02–0.5 µM) in buffer were injected over the chip surface for 180 s at a flow rate of 50 µL⋅min−1 to reach equilibrium, with one of the flow cells kept blank as a control. The buffer solution was then injected over the chip surface for 300 s to determine the dissociation parameters. The surface was recovered by washing with 10 µL of 10 mM HCl.
CD Spectroscopy.
CD spectra were analyzed between 350 and 200 nm using a JASCO J-815 spectropolarimeter. The temperature was controlled using a circulating water bath. All spectra were calculated as the average of three runs. The molar ellipticity [θ] was calculated from the equation [θ] = θ/Cl, where θ is the relative intensity, C is the molar concentration of oligonucleotides, and l is the path length of the cell in centimeters.
Supplementary Data.
To confirm whether oligonucleotides containing longer dTGGAA repeats are able to form stable hairpin structures, the melting temperatures (Tm) of the self-priming sequence d(TGGAA)10 in the presence of various salts were determined by measuring the A260 at different temperatures (Fig. S1B). In the absence of extra salt ions, d(TGGAA)10 has a high Tm value in sodium cacodylate buffer solution (60 °C). The Tm values increase to 72 and 75 °C upon the addition of 100 mM NaCl or 20 mM MgCl2, respectively.
Acknowledgments
We thank Mr. Roshan Satange for the structural refinements. We also thank the National Synchrotron Radiation Research Center (Taiwan) staff for the data collection. This work was supported by Grants 106-2628-M-005-001-MY3 (to M.-H.H.) and 105-2113-M-003-009-MY2 (to I-R.L.) from the Ministry of Science and Technology, Taiwan.
Footnotes
The authors declare no conflict of interest.
This article is a PNAS Direct Submission.
Data deposition: Crystallography, atomic coordinates, and structure factors have been deposited in Protein Data Bank (accession no. 5GUN).
This article contains supporting information online at www.pnas.org/lookup/suppl/doi:10.1073/pnas.1708691114/-/DCSupplemental.
References
- 1.Carvalho CMB, Lupski JR. Mechanisms underlying structural variant formation in genomic disorders. Nat Rev Genet. 2016;17:224–238. doi: 10.1038/nrg.2015.25. [DOI] [PMC free article] [PubMed] [Google Scholar]
- 2.Gacy AM, Goellner G, Juranić N, Macura S, McMurray CT. Trinucleotide repeats that expand in human disease form hairpin structures in vitro. Cell. 1995;81:533–540. doi: 10.1016/0092-8674(95)90074-8. [DOI] [PubMed] [Google Scholar]
- 3.Kim T-M, Park PJ. A genome-wide view of microsatellite instability: Old stories of cancer mutations revisited with new sequencing technologies. Cancer Res. 2014;74:6377–6382. doi: 10.1158/0008-5472.CAN-14-1225. [DOI] [PMC free article] [PubMed] [Google Scholar]
- 4.Leclercq S, Rivals E, Jarne P. DNA slippage occurs at microsatellite loci without minimal threshold length in humans: A comparative genomic approach. Genome Biol Evol. 2010;2:325–335. doi: 10.1093/gbe/evq023. [DOI] [PMC free article] [PubMed] [Google Scholar]
- 5.Ou C-Y, et al. Analysis of microsatellite instability in cervical cancer. Int J Gynecol Cancer. 1999;9:67–71. doi: 10.1046/j.1525-1438.1999.09800.x. [DOI] [PubMed] [Google Scholar]
- 6.Mirkin SM. Expandable DNA repeats and human disease. Nature. 2007;447:932–940. doi: 10.1038/nature05977. [DOI] [PubMed] [Google Scholar]
- 7.Völker J, Gindikin V, Klump HH, Plum GE, Breslauer KJ. Energy landscapes of dynamic ensembles of rolling triplet repeat bulge loops: Implications for DNA expansion associated with disease states. J Am Chem Soc. 2012;134:6033–6044. doi: 10.1021/ja3010896. [DOI] [PMC free article] [PubMed] [Google Scholar]
- 8.Chen Y-W, Jhan C-R, Neidle S, Hou M-H. Structural basis for the identification of an i-motif tetraplex core with a parallel-duplex junction as a structural motif in CCG triplet repeats. Angew Chem Int Ed Engl. 2014;53:10682–10686. doi: 10.1002/anie.201405637. [DOI] [PubMed] [Google Scholar]
- 9.López Castel A, Cleary JD, Pearson CE. Repeat instability as the basis for human diseases and as a potential target for therapy. Nat Rev Mol Cell Biol. 2010;11:165–170. doi: 10.1038/nrm2854. [DOI] [PubMed] [Google Scholar]
- 10.Grady DL, et al. Highly conserved repetitive DNA sequences are present at human centromeres. Proc Natl Acad Sci USA. 1992;89:1695–1699. doi: 10.1073/pnas.89.5.1695. [DOI] [PMC free article] [PubMed] [Google Scholar]
- 11.Zhu L, Chou SH, Reid BR. A single G-to-C change causes human centromere TGGAA repeats to fold back into hairpins. Proc Natl Acad Sci USA. 1996;93:12159–12164. doi: 10.1073/pnas.93.22.12159. [DOI] [PMC free article] [PubMed] [Google Scholar]
- 12.Chou SH, Zhu L, Reid BR. The unusual structure of the human centromere (GGA)2 motif. Unpaired guanosine residues stacked between sheared G.A pairs. J Mol Biol. 1994;244:259–268. doi: 10.1006/jmbi.1994.1727. [DOI] [PubMed] [Google Scholar]
- 13.Sato N, et al. Spinocerebellar ataxia type 31 is associated with “inserted” penta-nucleotide repeats containing (TGGAA)n. Am J Hum Genet. 2009;85:544–557. doi: 10.1016/j.ajhg.2009.09.019. [DOI] [PMC free article] [PubMed] [Google Scholar]
- 14.Tseng W-H, et al. Induced-fit recognition of CCG trinucleotide repeats by a nickel-chromomycin complex resulting in large-scale DNA deformation. Angew Chem Int Ed Engl. 2017;56:8761–8765. doi: 10.1002/anie.201703989. [DOI] [PubMed] [Google Scholar]
- 15.Chen H, et al. Ionic strength-dependent persistence lengths of single-stranded RNA and DNA. Proc Natl Acad Sci USA. 2012;109:799–804. doi: 10.1073/pnas.1119057109. [DOI] [PMC free article] [PubMed] [Google Scholar]
- 16.Lo Y-S, Tseng W-H, Chuang C-Y, Hou M-H. The structural basis of actinomycin D-binding induces nucleotide flipping out, a sharp bend and a left-handed twist in CGG triplet repeats. Nucleic Acids Res. 2013;41:4284–4294. doi: 10.1093/nar/gkt084. [DOI] [PMC free article] [PubMed] [Google Scholar]
- 17.Hou M-H, Robinson H, Gao Y-G, Wang AHJ. Crystal structure of actinomycin D bound to the CTG triplet repeat sequences linked to neurological diseases. Nucleic Acids Res. 2002;30:4910–4917. doi: 10.1093/nar/gkf619. [DOI] [PMC free article] [PubMed] [Google Scholar]
- 18.Edwards SF, Sirito M, Krahe R, Sinden RR. A Z-DNA sequence reduces slipped-strand structure formation in the myotonic dystrophy type 2 (CCTG) x (CAGG) repeat. Proc Natl Acad Sci USA. 2009;106:3270–3275. doi: 10.1073/pnas.0807699106. [DOI] [PMC free article] [PubMed] [Google Scholar]
- 19.Qiu Y, Niu H, Vukovic L, Sung P, Myong S. Molecular mechanism of resolving trinucleotide repeat hairpin by helicases. Structure. 2015;23:1018–1027. doi: 10.1016/j.str.2015.04.006. [DOI] [PMC free article] [PubMed] [Google Scholar]
- 20.Chou SH, Zhu L, Reid BR. On the relative ability of centromeric GNA triplets to form hairpins versus self-paired duplexes. J Mol Biol. 1996;259:445–457. doi: 10.1006/jmbi.1996.0331. [DOI] [PubMed] [Google Scholar]
- 21.Pizarro AM, Sadler PJ. Unusual DNA binding modes for metal anticancer complexes. Biochimie. 2009;91:1198–1211. doi: 10.1016/j.biochi.2009.03.017. [DOI] [PMC free article] [PubMed] [Google Scholar]
- 22.Schnabl J, Sigel RKO. Controlling ribozyme activity by metal ions. Curr Opin Chem Biol. 2010;14:269–275. doi: 10.1016/j.cbpa.2009.11.024. [DOI] [PubMed] [Google Scholar]
- 23.Bikard D, Loot C, Baharoglu Z, Mazel D. Folded DNA in action: Hairpin formation and biological functions in prokaryotes. Microbiol Mol Biol Rev. 2010;74:570–588. doi: 10.1128/MMBR.00026-10. [DOI] [PMC free article] [PubMed] [Google Scholar]
- 24.Figueroa AA, Cattie D, Delaney S. Structure of even/odd trinucleotide repeat sequences modulates persistence of non-B conformations and conversion to duplex. Biochemistry. 2011;50:4441–4450. doi: 10.1021/bi200397b. [DOI] [PMC free article] [PubMed] [Google Scholar]
- 25.Mao C, Sun W, Shen Z, Seeman NC. A nanomechanical device based on the B-Z transition of DNA. Nature. 1999;397:144–146. doi: 10.1038/16437. [DOI] [PubMed] [Google Scholar]
- 26.Roy R, Hohng S, Ha T. A practical guide to single-molecule FRET. Nat Methods. 2008;5:507–516. doi: 10.1038/nmeth.1208. [DOI] [PMC free article] [PubMed] [Google Scholar]
- 27.Sabanayagam CR, Eid JS, Meller A. Using fluorescence resonance energy transfer to measure distances along individual DNA molecules: Corrections due to nonideal transfer. J Chem Phys. 2005;122:061103. doi: 10.1063/1.1854120. [DOI] [PubMed] [Google Scholar]
- 28.Minor W, Otwinowski Z. HKL2000 (Denzo-SMN) software package. Processing of X-ray diffraction data collected in oscillation mode. Methods Enzymol. 1997;276:307–326. doi: 10.1016/S0076-6879(97)76066-X. [DOI] [PubMed] [Google Scholar]
- 29.Murshudov GN, Vagin AA, Dodson EJ. Refinement of macromolecular structures by the maximum-likelihood method. Acta Crystallogr D Biol Crystallogr. 1997;53:240–255. doi: 10.1107/S0907444996012255. [DOI] [PubMed] [Google Scholar]
- 30.Parkinson G, Vojtechovsky J, Clowney L, Brünger AT, Berman HM. New parameters for the refinement of nucleic acid-containing structures. Acta Crystallogr D Biol Crystallogr. 1996;52:57–64. doi: 10.1107/S0907444995011115. [DOI] [PubMed] [Google Scholar]
- 31.Lavery R, Moakher M, Maddocks JH, Petkeviciute D, Zakrzewska K. Conformational analysis of nucleic acids revisited: Curves+ Nucleic Acids Res. 2009;37:5917–5929. doi: 10.1093/nar/gkp608. [DOI] [PMC free article] [PubMed] [Google Scholar]
- 32.Lavery R, Sklenar H. The definition of generalized helicoidal parameters and of axis curvature for irregular nucleic acids. J Biomol Struct Dyn. 1988;6:63–91. doi: 10.1080/07391102.1988.10506483. [DOI] [PubMed] [Google Scholar]
- 33.Zheng G, Lu X-J, Olson WK. Web 3DNA—A web server for the analysis, reconstruction, and visualization of three-dimensional nucleic-acid structures. Nucleic Acids Res. 2009;37:W240–W246. doi: 10.1093/nar/gkp358. [DOI] [PMC free article] [PubMed] [Google Scholar]


