Significance
A mass extinction occurred at the Cretaceous−Paleogene boundary coincident with the impact of a 10-km asteroid in the Yucatán peninsula. A worldwide layer of soot found at the boundary is consistent with global fires. Using a modern climate model, we explore the effects of this soot and find that it causes near-total darkness that shuts down photosynthesis, produces severe cooling at the surface and in the oceans, and leads to moistening and warming of the stratosphere that drives extreme ozone destruction. These conditions last for several years, would have caused a collapse of the global food chain, and would have contributed to the extinction of species that survived the immediate effects of the asteroid impact.
Keywords: asteroid impact, soot, extinction, Chicxulub, Cretaceous
Abstract
Climate simulations that consider injection into the atmosphere of 15,000 Tg of soot, the amount estimated to be present at the Cretaceous−Paleogene boundary, produce what might have been one of the largest episodes of transient climate change in Earth history. The observed soot is believed to originate from global wildfires ignited after the impact of a 10-km-diameter asteroid on the Yucatán Peninsula 66 million y ago. Following injection into the atmosphere, the soot is heated by sunlight and lofted to great heights, resulting in a worldwide soot aerosol layer that lasts several years. As a result, little or no sunlight reaches the surface for over a year, such that photosynthesis is impossible and continents and oceans cool by as much as 28 °C and 11 °C, respectively. The absorption of light by the soot heats the upper atmosphere by hundreds of degrees. These high temperatures, together with a massive injection of water, which is a source of odd-hydrogen radicals, destroy the stratospheric ozone layer, such that Earth’s surface receives high doses of UV radiation for about a year once the soot clears, five years after the impact. Temperatures remain above freezing in the oceans, coastal areas, and parts of the Tropics, but photosynthesis is severely inhibited for the first 1 y to 2 y, and freezing temperatures persist at middle latitudes for 3 y to 4 y. Refugia from these effects would have been very limited. The transient climate perturbation ends abruptly as the stratosphere cools and becomes supersaturated, causing rapid dehydration that removes all remaining soot via wet deposition.
The Cretaceous−Paleogene (K−Pg) boundary coincides with an asteroid impact and marks one of the five great extinction events since the Cambrian explosion of life forms 541 Ma. The millimeter-thick portion of the boundary layer far from the asteroid impact site at Chicxulub, in the Yucatán Peninsula, contains iridium, which was used to identify the asteroid impact at the time of the mass extinction event 66 Ma (1–3). According to Wolbach et al. (4), it also contains as much as 56,000 Tg of elemental carbon, of which 15,000 Tg is in the form of fine soot nanoclusters, and the remaining 41,000 Tg is made up of coarser soot particles. Earlier estimates by the same authors (5), based on a smaller number of samples, yield even larger numbers: 70,000 Tg of soot, of which 35,000 Tg is fine soot. Although many details of the extinction event and the origins of various materials in the K−Pg layer are poorly understood, the presence of soot is incontrovertible. The soot is collocated with the iridium, and therefore must have been injected during the time required for the iridium to be removed from the atmosphere and reach the ground; it could not have come from forest fires decades or centuries after the impact (4). Although some argue that the soot originated from burning hydrocarbons at the impact site (6), recent studies indicate that the hydrocarbon source is quantitatively insufficient to explain the soot layer (7). The mass of soot is so great for the 70,000 Tg estimate that most of the aboveground biomass, and likely much of the biomass in the near-surface soil, must have burned immediately following the impact and produced fine soot with high efficiency (4, 8).
In this study, we present simulations of the short-term climate effects of massive injections of soot into the atmosphere following the impact of a 10-km-diameter asteroid. We assume that the soot originated from global or near-global fires (8). The short-term climate effects of the soot would augment and probably dominate those of other materials injected by the impact, which are not considered here except for water vapor. Given the range of estimates for the fine soot produced by the impact (4, 5), we consider soot injections of 15,000 Tg and 35,000 Tg. Substantially smaller estimates have been proposed (9), so we also simulate a much smaller soot injection, 750 Tg, to contrast the climate effects of large and small soot injections.
Materials and Methods
We use the Community Earth System Model (CESM) (10), a fully coupled climate model that includes atmosphere, ocean, land, and sea−ice components. We use the Whole Atmosphere Community Climate Model, version 4, (WACCM) as the atmospheric component (11). WACCM is a “high-top” chemistry−climate model, with an upper boundary located near 140-km geometric altitude; it has horizontal resolution of 1.9° × 2.5° (latitude × longitude), and variable vertical resolution of 1.25 km from the boundary layer to near 1 hPa, 2.5 km in the mesosphere, and 3.5 km in the lower thermosphere, above about 0.01 hPa. WACCM is used as the atmospheric model to be able to simulate the physical and chemical consequences of injection and lofting of impact materials to great heights in the atmosphere.
The upper range of the estimated soot burden produced by the asteroid impact is 70,000 Tg (5). To represent the evolution of such a massive injection accurately, we have coupled WACCM with the Community Aerosol and Radiation Model for Atmospheres (CARMA) (12). CARMA is a sectional aerosol parameterization that resolves the aerosol size distribution. CARMA aerosols are advected by WACCM, are subject to wet and dry deposition, affect the surface albedo, and are included in the WACCM radiative transfer calculation. The soot is treated as a fractal aggregate for both microphysics and radiative transfer (13), and coagulation of soot particles is considered. The fractal particles have a monomer size of 30 nm, a fractal dimension varying between 1.5 and 3.0, and a packing coefficient of 1 (13). The largest burdens of soot aerosol considered here cause enormous temperature changes in the stratosphere and mesosphere, which required changes to WACCM to improve the numerical stability of the model. These changes and additional details about the model configuration are described in Supporting Information.
We carried out seven simulations for this study, a 20-y control simulation and six 15-y perturbation experiments, described below and summarized in Table S1. We also carried out a few additional short simulations with output at high temporal resolution to assess the impact of soot injections between 750 Tg and 35,000 Tg on solar flux at the surface. Data from the simulations will be made available on request. All simulations use modern continental positions and atmospheric composition. Initial conditions for the calculations are discussed by Toon et al. (8). Soot is assumed to be produced by global fires ignited as debris from the impact falls through the atmosphere at high velocities and heats up to very high temperatures. We assume that fine soot is lofted to the upper troposphere in pyrocumuli (14), and we thus place it in a Gaussian distribution centered on the local tropopause. The remaining, coarse soot particles are placed in a half-Gaussian at the surface. Both fine and coarse soot are injected over 24 h. The coarse soot is removed rapidly (Fig. S1) and plays a negligible role in forcing climate change; therefore, in the remainder of the paper, we refer to the various simulations by the amount of fine soot injected. See Soot Emission and Removal and Toon et al. (8) for a detailed discussion of the soot emissions.
Table S1.
Simulations carried out for this study
| Case | Time, y | Total soot, Tg | Fine soot, Tg | Coarse soot, Tg | H2O | CO2 | Heat | Ref(s). |
| Control | 20 | – | – | – | – | – | – | 11 |
| 1 | 15 | 70,000 | 35,000 | 35,000 | X | – | – | 5, 8 |
| 2 | 15 | 70,000 | 35,000 | 35,000 | – | – | – | 5, 8 |
| 3 | 15 | 56,000 | 15,000 | 0 | X | – | – | 4, 8 |
| 4 | 15 | 56,000 | 15,000 | 41,000 | X | X | – | 4, 8 |
| 5 | 3 | 56,000 | 15,000 | 41,000 | X | X | X | 4, 8 |
| 6 | 15 | 1,500 | 750 | 750 | X | – | – | 8, 9 |
| 7 | 15 | 1,500 | 750 | 750 | – | – | – | 8, 9 |
| 8 | 2 | 19,000 | 5,000 | 0 | X | – | – | 8 |
| 9 | 2 | 5,600 | 1,500 | 0 | X | – | – | 8 |
In all cases, fine soot is injected at tropopause level and coarse soot is injected at the surface. For a few cases, the coarse soot was assumed to be removed immediately via deposition and was omitted from the injections. For water vapor, carbon dioxide, and heat injections, an “X” indicates they were included in that simulation. See Materials and Methods and Soot Emission and Removal and references cited in the table for additional details.
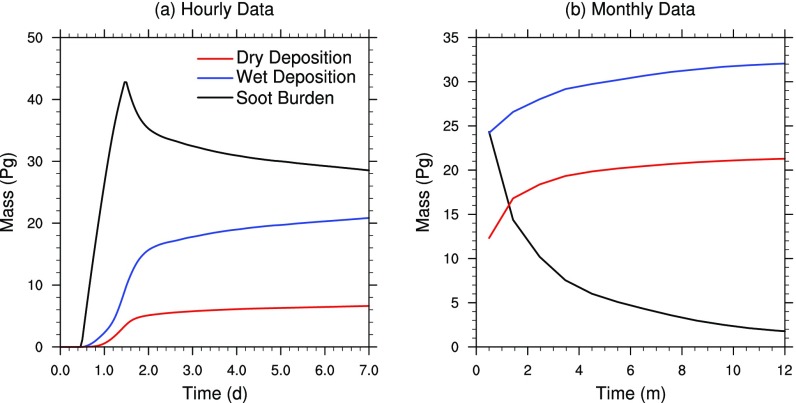
Fig. S1.
Evolution of soot burden (black) and cumulative wet (blue) and dry (red) deposition for the simulation with 15,000 Tg of fine soot and 41,000 Tg of coarse soot, including injections of H2O, CO2, and heat from fires for (A) 1 wk using hourly data and (B) 1 y using monthly average data. The soot is emitted over the first 12 h to 36 h and is followed by rapid wet and dry removal. After 1 y, the remaining soot burden is 4% of the total 56,000-Tg emission, with 57% removed by wet deposition and 38% removed by dry deposition.
There are many other materials that plausibly might have been injected along with the soot (8). The K−Pg layer is dominated by spherules about 200 µm in diameter (15). These particles likely ignited the global wildfires, but they could have remained in the atmosphere only a few days and would not have impacted climate directly. In addition, clastics were clearly produced in the impact and extend over much of North America. However, the submicron fraction that could have been part of the global aerosol layer is subject to debate, difficult to determine from theory, and not detectable in the K−Pg global layer because of chemical weathering of the clastics. Vaporized impactor and target material would not only have condensed to form the large spherules but may also have left behind a large mass of rock vapor (16). The fate of the vapor is unknown; it may have condensed on the spherules, or it may have entered the atmosphere and recondensed there as nanometer-sized particles.
Another impact material that might have been present but cannot be documented in the K−Pg boundary layer is sulfur originating from the asteroid or the target rock at the impact site. A number of authors (8, 17–20) have suggested that sulfur injections may have modified the climate after the impact. It is known that large volcanic eruptions that inject sulfur into the stratosphere can affect climate by reducing the solar flux that reaches the troposphere. It is not clear how much of this sulfur may have reacted on the spherules or rock vapor and then been quickly removed. The total amount of sulfur injected by the impact is estimated to be about 100 Gt (100,000 Tg) (17), which is larger than the mass of soot observed in the K−Pg layer. Even so, previous investigators (18, 19) found that the sulfate alone could not reduce light levels below 1%, because sulfate is nearly transparent at visible wavelengths. However, a recent study (20) using a climate model with the sulfate aerosol radiative forcing estimated by Pierazzo et al. (19) shows that reduction of the solar flux to a few percent of normal values is sufficient to cause severe global cooling. Thus, both soot and sulfate aerosols are sufficient to produce large, transient decreases in global temperature, but large injections of soot will also cause near-total darkness at the surface for a protracted period.
Because of the uncertainties associated with the presence and possible impacts of materials other than soot, they are not considered in our simulations. However, we do consider the effects of injecting into the atmosphere, together with the soot, a large amount of water vapor produced by vaporized and splashed seawater at the impact site, and as a combustion product from the global fires. Toon et al. (8) estimated that 7.5 × 10⁶ Tg of water was produced, with 1.5 × 10⁶ Tg coming from combustion, and we use these estimates. Consideration of the effects of water vapor is important because such a massive injection would have produced supersaturated conditions above the tropopause. Subsequent rainout could then remove a possibly important fraction of the soot from the upper atmosphere.
To put our results into context, we also carried out a simulation using a considerably smaller amount of fine soot, as done by Kaiho et al. (9), who assumed soot was produced from carbon present at the impact site, but estimated a much smaller soot input than Wolbach et al. (4, 5). In addition to a much smaller soot injection, Kaiho et al. did not include coagulation in their simulations, so their particles did not grow in time, and the size did not change with the mass injected. In their standard 1,500-Tg case they used an initial soot particle size mode of 11.8 nm, which is much smaller than smoke in the present-day atmosphere. Toon et al. (8) recommended an initial soot particle size mode of 110 nm, which is based on Wolbach et al.’s (21) analysis of the particle size in the K−Pg layer, and is also very similar to observations of modern forest fire smoke. The optical properties of 11.8-nm particles are much different from those of more realistic smoke particles. In all of our simulations, we inject the fine soot near the tropopause, with an initial size of 110 nm.
We note, finally, that we have not included the effects of CO2 release from the impact site, nor the CO2 and heat of combustion from the burning of biomass in most of our calculations. The omission of CO2 was dictated by technical considerations, as the parameterization of nonlinear thermodynamic equilibrium infrared transfer in our model was unstable for the very large mixing ratios of CO2 produced following the impact. We return to this point in Discussion, where we show that neither a massive injection of CO2 nor the heat from global fires affects significantly the short-term response to the asteroid impact.
Results
Lifetime of Soot, Optical Depth, and Sunlight at the Surface.
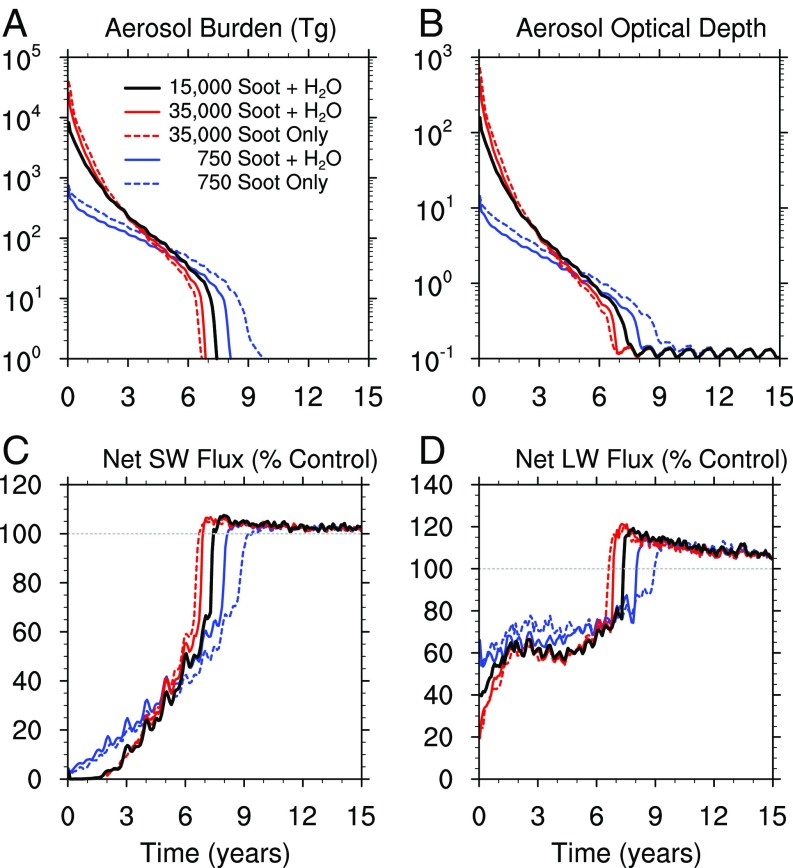
Fig. 1 summarizes the evolution of several climate parameters for injections near the tropopause of 750 Tg, 15,000 Tg, and 35,000 Tg of fine soot. Two cases each are shown for the 750- and 35,000-Tg injections, corresponding to whether or not water is injected into the upper atmosphere together with the soot. The 750-Tg case is similar to the midrange injection suggested by Kaiho et al. (9) and is included to show the effect of a drastically smaller injection. We will examine first the 35,000-Tg and 750-Tg cases, as they span the range of proposed soot injections, and then consider in detail the 15,000-Tg case, which is consistent with the most recent fine soot estimates by Wolbach et al. (4). In all cases, the fine soot is injected near the tropopause, where it is heated by sunlight and generates updrafts that quickly loft the soot-bearing air to altitudes as high as 90 km. Rapid lofting of soot has been found in simulations of nuclear conflicts, and there is some evidence that lofting also occurs after large wildfires whose plumes reach the tropopause (14, 22–24).
Fig. 1.
Simulated changes in several important climate parameters following injections of 750 Tg and 35,000 Tg of soot near the tropopause, as well as cases that include water vapor injections for 750 Tg, 15,000 Tg, and 35,000 Tg. (A) Aerosol burden, (B) Aerosol optical depth, (C) net shortwave (SW) flux, and (D) net longwave (LW) flux. All parameters are monthly and globally averaged. Optical depth is calculated at 500 nm, near the center of the visible range of wavelength. Net SW and LW fluxes are shown as fractions of the value in the control simulation at Earth’s surface.
From Fig. 1A, we conclude that 90% of the K−Pg distal layer was deposited on the surface within about a year following the larger soot injections (15,000 Tg and 35,000 Tg). Observations that the soot and iridium are colocated in the global K−Pg layer (4) are consistent with this result. However, the time required for the soot burden in the 750-Tg cases to decrease by 90% is about 3 y. The reason for the difference in removal time is that massive injections produce larger particles via coagulation, which fall out of the atmosphere more quickly than smaller soot particles from smaller injections. The removal of 90% of the soot in 1 y for the 35,000-Tg cases is about twice as fast as that observed after the 1991 eruption of Mt. Pinatubo (25) because the lofted soot particles in the present simulation coagulate to form fractal particles that are much larger (2-µm spherical equivalent radius) than the Pinatubo volcanic particles (0.6-µm radius).
Fig. 1B shows that the soot optical depth at 500 nm is initially near 700 for the 35,000-Tg soot-only simulation and about 500 for the 35,000-Tg soot simulation with water injection. While the optical depth declines at about the same rate as the aerosol burden (Fig. 1A), the initial soot burden is so large that the optical depth remains above 10 for 2 y and above 1 for about 5 y. By comparison, the largest optical depth reached in the 750-Tg cases immediately after impact is about 10. The amount of sunlight at the surface declines exponentially with optical depth. Fig. 1C shows the net shortwave solar flux at the surface (that is, the solar flux that is absorbed by the surface) for various soot injections. For the 35,000-Tg cases, nearly 100% of the flux is blocked for almost 2 y, while, for the 750-Tg cases, the sunlight is 5 to 10% of its normal value for 2 y. In all cases, there is a 5% overshoot in the net shortwave flux and a 15 to 20% overshoot in net longwave flux compared with the control case after the soot is removed from the atmosphere. The overshoot is due mainly to a reduction in the water vapor column amount in the Tropics, which leads to less atmospheric absorption of both shortwave and longwave radiation.
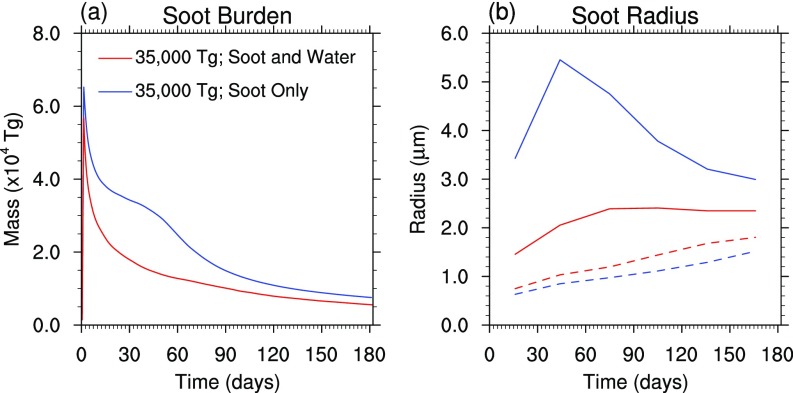
When water accompanies the soot injection, a large amount of soot is removed within a few days, due to scavenging by precipitation, as the stratosphere becomes supersaturated and water condenses or freezes (Fig. S2A). Nevertheless, within 180 d, the soot burden in the simulation without the added water vapor approaches the value obtained when water vapor is included. This occurs because, without initial removal by precipitation, soot particles are so abundant that they grow very large by coagulation and sediment more quickly (Fig. S2B). Thus, while the simulation that includes water vapor provides a more realistic account of the evolution of the soot aerosol, the addition of water vapor has only a minor impact on the burden of soot and its climate effects after the first few months. The minor role of water vapor under large soot loads is reflected in the very similar longer-term evolution of all of the variables in the two 35,000-Tg simulations shown in Fig. 1.
Fig. S2.
(A) Soot burden and (B) effective soot particle radius for the first 6 mo of the two 35,000-Tg simulations (with and without the addition of water vapor). Soot burden is from instantaneous, hourly model output; soot radius is from monthly average output. The soot radius shown is the equivalent spherical radius at 100 hPa (solid) and 10 hPa (dashed). When water accompanies the soot injection, a very large amount of soot is removed by precipitation within a few days (A, red curve). In the simulation without water vapor, rapid removal of soot starts around day 60, due to coagulation and sedimentation of large particles (A, blue curve). This effect is seen at 100 hPa but does not occur at 10 hPa, where the mixing ratio of soot is much smaller and very large particles do not form (B).
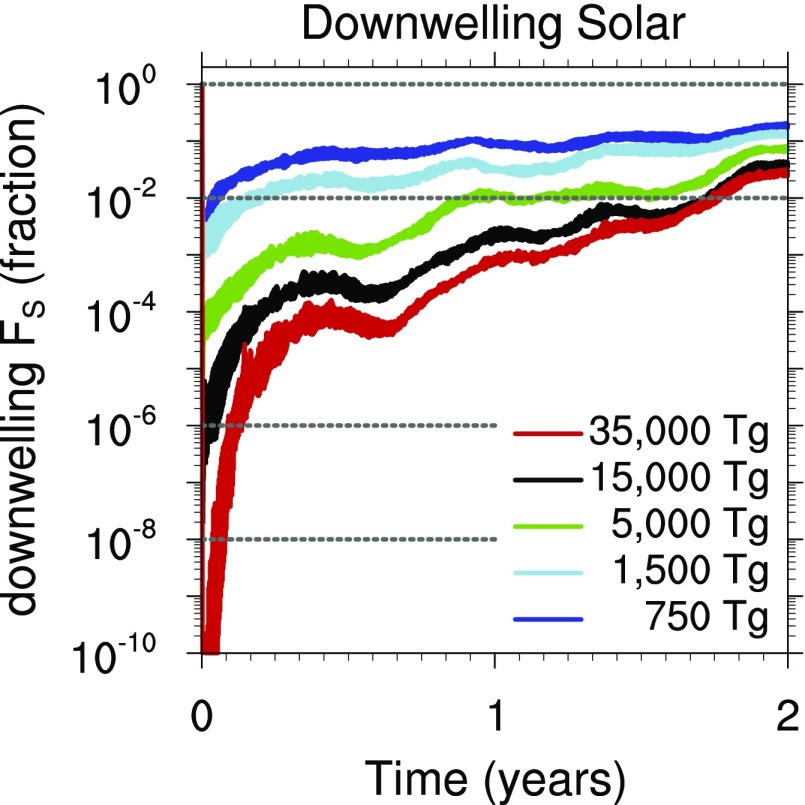
The large reduction in the solar flux at the surface following the impact (Fig. 1C) can have a significant effect on primary productivity, the rate at which energy is converted into organic compounds, primarily via photosynthesis. Oceanographers define the euphotic zone as the layer of the ocean where photosynthesis is possible, and find that it extends from the surface to depths where the downwelling solar flux is about 1% of its magnitude at the surface (26). In what follows, we use this 1% threshold as a rough proxy for the reduction of sunlight that would prevent photosynthesis anywhere on Earth, although the limiting solar flux for positive net primary productivity can vary considerably among types of organisms (27). Fig. 2 shows the global average shortwave flux at the surface as a fraction of the control case on a logarithmic scale for a range of soot injections for the first 2 y after the asteroid impact. In the 15,000- and 35,000-Tg simulations, the global average downwelling solar flux at the surface remains below 1% of normal for most of the first 2 y following the impact. In the 5,000-Tg case, the solar flux barely reaches 1% of normal at the start of the second year.
Fig. 2.
Ratio of downwelling solar flux at the surface from soot injections of 750 Tg, 1,500 Tg, 5,000 Tg, 15,000 Tg, and 35,000 Tg to its value in the control run. All time series use instantaneous hourly data. All cases include injection of water vapor.
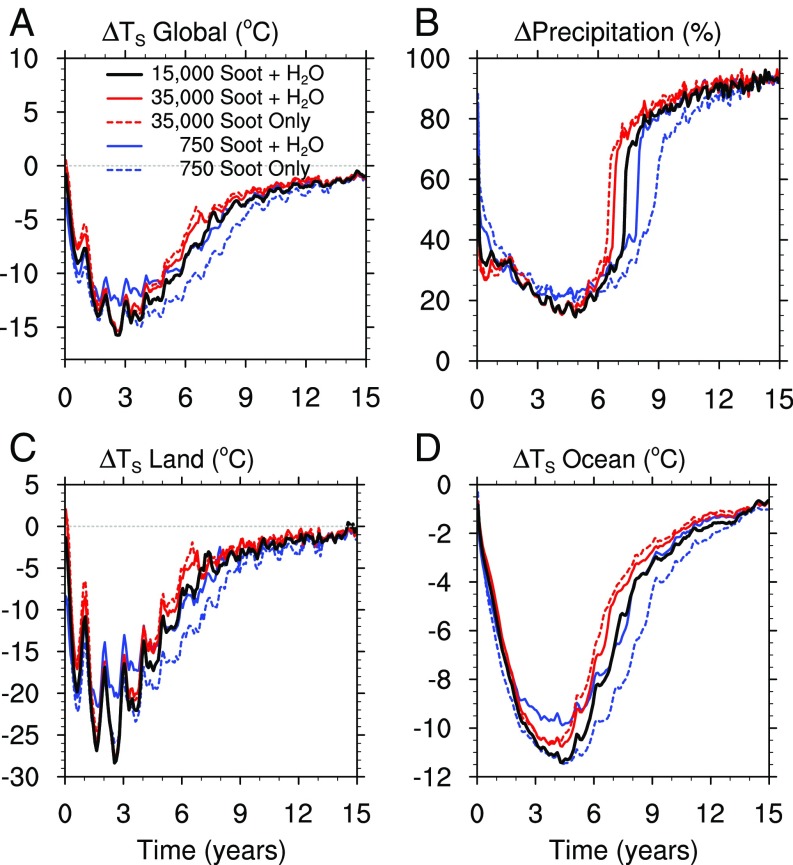
The reduction of sunlight is not globally uniform; sunlight is reduced much less severely in the polar regions. We illustrate below the detailed distribution of solar flux and other climate fields using the 15,000-Tg case because this is the most recent estimate of soot production by Wolbach et al. (4). We note, however, that the climate impact of either 15,000- or 35,000-Tg soot injections is similar because the soot burden and atmospheric residence time are sufficiently large in both instances to produce severe, multiyear reductions in surface solar flux. This similarity can be appreciated by comparing the evolution of the global fields shown in Fig. 1 and related figures in the following sections for these two cases (Figs. 4 and 10).
Fig. 4.
As in Fig. 1, but for differences in global average (A) surface temperature, (C) land temperature, and (D) ocean temperature; and (B) global average precipitation as a fraction of the control simulation.
Fig. 10.
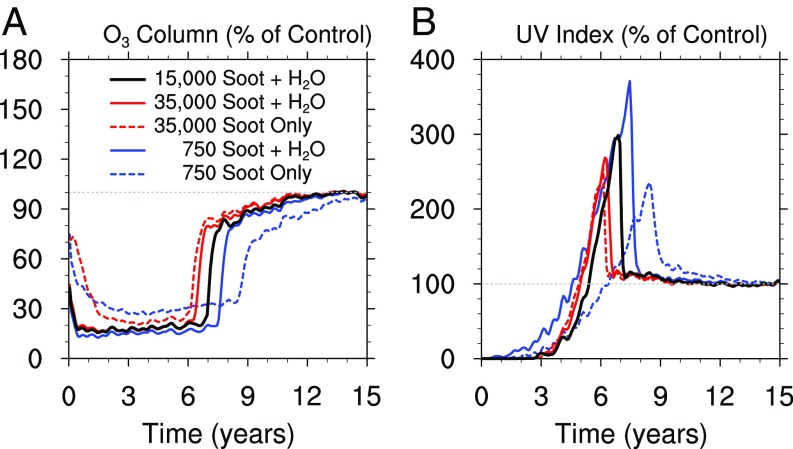
Simulated changes in (A) ozone and (B) UVI, a measure of surface UV irradiance, for the cases with 750 Tg, 15,000 Tg, and 35,000 Tg of soot as shown in Fig. 1. All quantities are globally averaged.
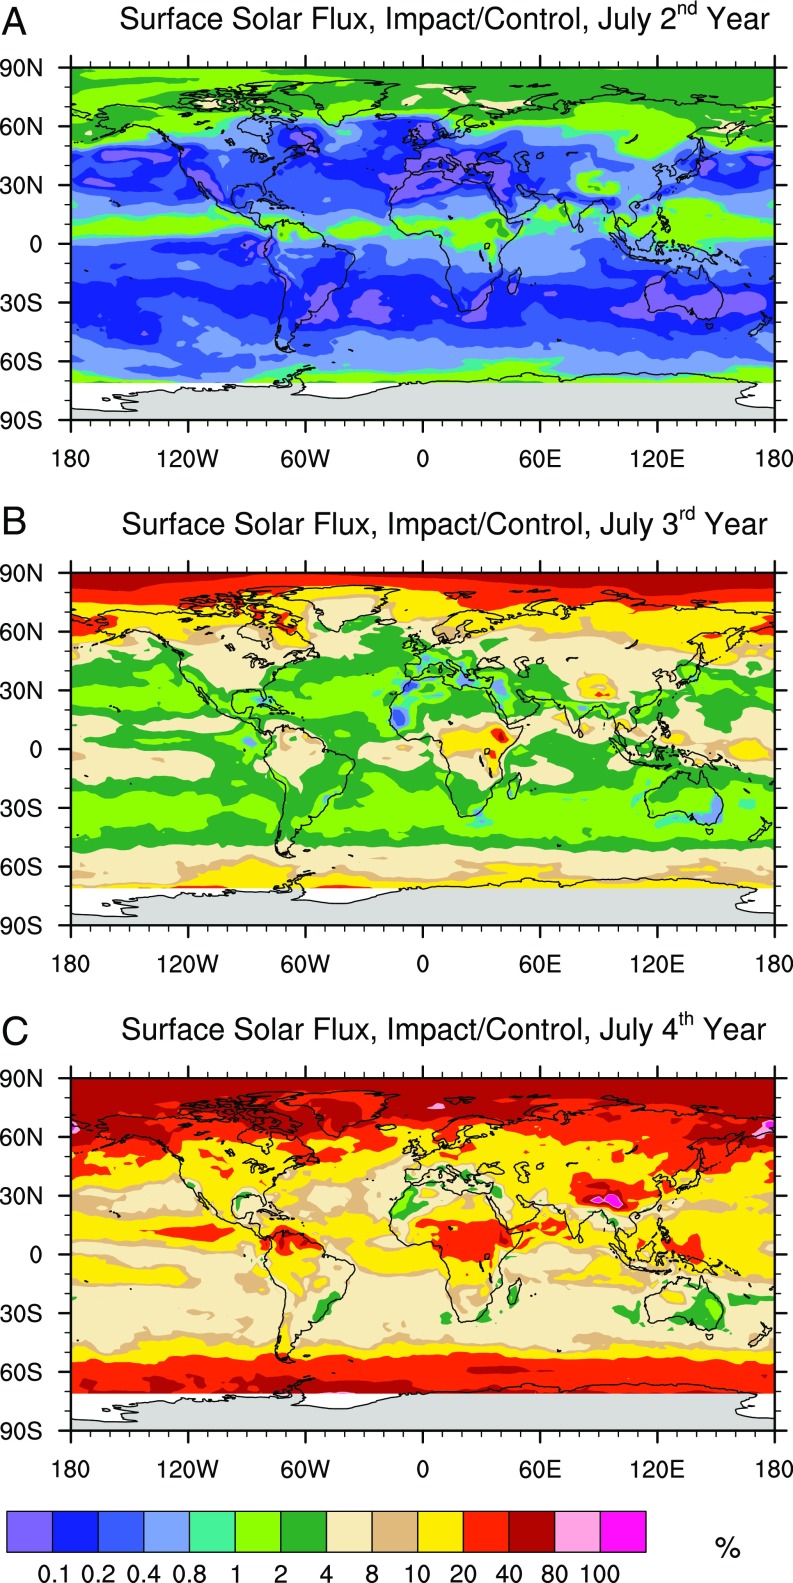
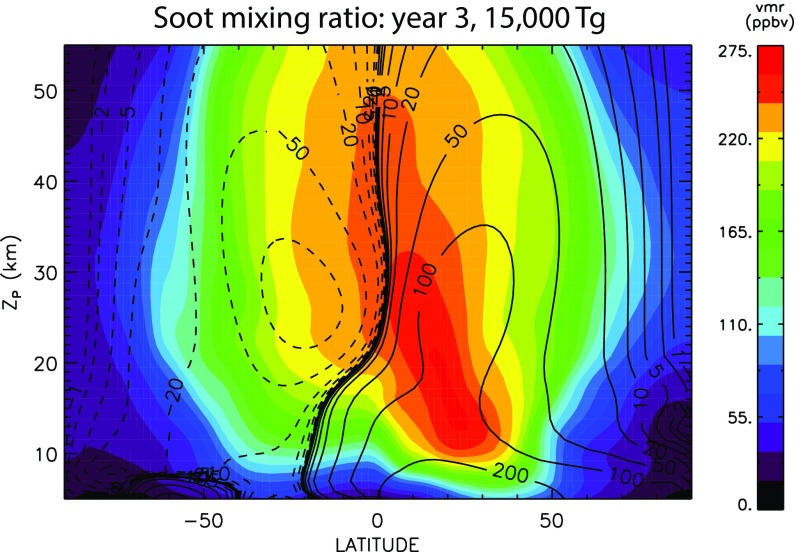
Fig. 3 shows the distribution of downwelling solar flux at the surface in the 15,000-Tg soot simulation relative to the control run in July of the second, third, and fourth year after the impact (18 mo, 30 mo, and 42 mo following impact). In the northern (summer) polar cap, the solar flux approaches 4% of normal as early as July of the second year (Fig. 3A), although light levels remain below 1% of preimpact values elsewhere. By the middle of the third year, much of the Tropics have light levels above 4% of normal, and, in the sunlit northern polar cap, light levels have recovered to 20% of normal, as seen in Fig. 3B. In July of the fourth year after the impact (Fig. 3C), sunlight has recovered to at least 10% of normal over much of Earth, and exceeds 40% over much of the sunlit northern polar cap. The behavior of sunlight at high latitudes follows from the pattern of transport of soot by the mean meridional circulation of the stratosphere (28) (Fig. S3). Annual mean descent over the poles brings relatively clean air from high altitudes to the polar regions. The pattern of mean advective transport is reflected in the considerably smaller mixing ratio of soot poleward of about 70° of latitude in both hemispheres.
Fig. 3.
Solar flux at the surface for the 15,000-Tg soot plus water simulation in July of the (A) second, (B) third, and (C) fourth years following the impact. The flux is shown as a percentage of the control case.
Fig. S3.
Aerosol loading (volume mixing ratio, parts per million by volume) and transformed Eulerian mean (TEM) meridional stream function (in kilograms per meter per second) in the stratosphere averaged over the third year after the impact. Positive stream function contours denote clockwise motion, and negative contours denote counterclockwise motion. Note the smaller aerosol loading at high latitudes.
The fraction of the world’s oceans where photosynthesis might have been possible after the asteroid impact (because the solar flux is at least 1% of its preimpact value) is near zero starting shortly after the impact until 18 mo after impact, when it increases rapidly and reaches 100% of preimpact values after 30 mo. At least 70% of the planktonic foraminifera species became extinct at the K−Pg boundary (29). As phytoplankton and zooplankton are consumed, the food chain in the photic zone, which contains 90% of the ocean biomass, will collapse, leading to mass extinction of organisms that depend directly or indirectly on the productivity of the euphotic zone. This would happen rapidly as the ocean biomass has a turnover time of 2 d to 6 d (30). On the other hand, benthic organisms that do not depend directly on the euphotic zone might not be impacted (2, 31–33). Some organisms have dormant stages (for example, in response to prolonged darkness in the polar night) and might be able to survive a long period of darkness with no food. It has been suggested, based on body mass, that large marine ectotherms could have survived starvation for 1,000 d (34). The recovery time of the marine biomass after light levels return to more than 1% of normal is not known, but that length of time might present an additional challenge even for marine creatures that can go without eating for long periods. Primary productivity could have been restored quickly by the surviving phytoplankton species, but it likely took longer to rebuild the food chain and restore export productivity, the rate at which organic compounds sink into the deep ocean (35). Phytoplankton has been shown to survive as long as 9 mo of darkness in a resting state (36), and phytoplankton spores and cysts have remained viable for up to 50 y (37). Note that reduction of sunlight is less severe and recovery is faster in the polar regions, due to the effect of the stratospheric circulation on the global distribution of soot (Fig. 3 and Fig. S3).
On land, photosynthesis currently is not as critical for food on short timescales as it is in the ocean. The terrestrial plant biomass turnover time on land is 13 y to 16 y (30), which is comparable to the 15 y needed for most climate variables to approach their preimpact values; see Fig. 1. Nevertheless, starvation may also have played an important role in land extinctions at the K−Pg boundary. As noted earlier, the larger estimates of the mass of soot in the K−Pg boundary layer (4, 5) require burning of all of the aboveground biomass. Any large creatures that managed to survive the global fires may have had trouble locating food in a burned-over landscape. Small creatures adapted to living below the surface or in wet environments, where they could escape fires, and that consumed small amounts of food, are the observed survivors of the K−Pg impact (34). In addition, some animals can survive for long periods without food and often do not feed during hibernation (38).
Turning now to the 750-Tg simulations, we find that, while light levels never drop below 1% of normal, they still take about 1 y to reach 10% of normal (Fig. 2, blue curve). In addition, by the end of year 4 after the impact, the aerosol burden and the optical depth in the 750-Tg cases exceed the corresponding values for the 15,000- and 35,000-Tg cases (Fig. 1 A and B). As already noted, the atmospheric lifetime of soot is much longer for the 750-Tg soot injection because the soot particles remain small given the initial low mixing ratio of the soot, and thus they sediment much more slowly. Note that Kaiho et al. (9) never find global average light levels lower than about 20% in their 1,500-Tg soot case, likely because their assumed particle size is so small. Note also that, whereas the climate impact of a 35,000-Tg soot injection was not sensitive to the simultaneous injection of water vapor, water vapor modifies substantially the response to the smaller, 750-Tg case. The difference is evident in the behavior of the soot burden (Fig. 1A), the aerosol optical depth (Fig. 1B), the net solar flux at the surface (Fig. 1C), and the net longwave flux at the surface (Fig. 1D), and is discussed in detail below.
To put into perspective the reduction in sunlight at the surface (Figs. 2 and 3), we note that full moonlight is about 10−6 of the normal solar flux, while a moonless night has light levels near 10−8 of the normal solar flux, and photosynthesis is severely inhibited at light levels less than 1% of normal. Each of these thresholds is indicated by horizontal dotted lines in Fig. 2. A soot injection of 750 Tg, the smallest considered here, reduces sunlight at the surface to 1% of normal for less than 1 mo, and to 10% for about 1 y. At the other extreme, soot injections of 15,000 Tg or larger reduce light levels below 10−6 of normal for 0.5 mo to 1 mo after impact, depending on the initial soot burden. Many creatures hunt at such low light levels (39), so their survival is consistent with our predicted light levels. However, animals that were not dark-adapted may have had trouble finding food, even if it were available, for up to a month. As regards net primary productivity, Fig. 2 shows that relatively small soot injections (1,500 Tg or less) would suppress photosynthesis (1% solar flux threshold) for only 1 mo to 2 mo. On the other hand, soot injections of 5,000 Tg or larger reduce sunlight below 1% of normal for at least 1 y, in the 5,000-Tg case, and nearly 2 y in the 15,000- and 35,000-Tg cases. These results imply that even fires that are not global in extent produce enough soot to suppress primary productivity for a prolonged period following the asteroid impact. For example, while both 5,000- and 35,000-Tg soot injections reduce surface solar flux to 1% of normal for at least 1 y, the larger injection implies burning the entire global biomass compared with less than 15% for the smaller one, assuming the same soot emission efficiency.
Surface Temperature.
Fig. 4 shows the evolution of globally averaged temperature and precipitation for several impact scenarios. For a soot injection of 15,000 Tg, the global average temperature falls by as much as 16 °C (Fig. 4A). The average temperature declines by about 28 °C on land (Fig. 4C), and by over 11 °C (Fig. 4D) in the ocean, which does not cool as much as the land due to its higher thermal inertia. Note that the 750-Tg cases (blue curves in Fig. 4) produce land, ocean, and global average cooling comparable to the 15,000- and 35,000-Tg cases. The similarity of global cooling across different scenarios is consistent with the results of Brugger et al. (20), who studied sulfates rather than soot, and with the behavior of the relevant surface energy fluxes in our simulations (Figs. S4 and S5). Even for an injection of 750 Tg of soot, the downwelling shortwave flux is reduced to 1% of the control value after impact and remains below 20% of the control for 2 y (Fig. 2). Further, by the fourth year after impact, the net shortwave flux at the surface is comparable in the large and small injection cases (Fig. 1C and Fig. S5) because of the much faster removal rate of the large soot particles that form after massive injections. In addition, the net longwave heat flux decreases more in the first year after impact for the large soot injections, due to the greater infrared opacity of the atmosphere produced by the soot (Fig. 1D and Fig. S5). The net result is that the surface flux imbalance for large and small soot injections is comparable; at no time does the shortwave flux differ by more than 15 W⋅m−2 to 20 W⋅m−2 between small and large soot injections (Fig. 1C).
Fig. S4.
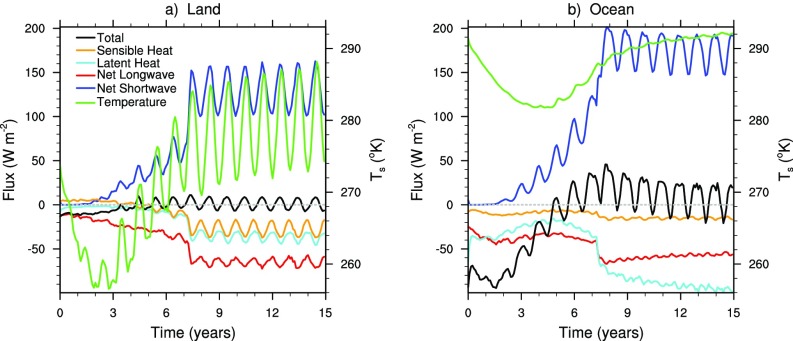
Evolution of average net surface energy fluxes and surface temperature (green; right ordinate scale) for the 15,000-Tg case over (A) the land and (B) the ocean. The total (black) is the sum of all of the flux terms, and is indicative of the net flux imbalance of the atmosphere−surface system; its sign is a measure of the energy loss or gain of the land and ocean. Surface temperature decreases rapidly following the reduction of shortwave flux, and reaches a minimum in year 3 over the land and years 4 to 5 over the ocean. Because of its much higher heat capacity, the ocean responds to the net energy loss by a smaller change in the global mean ocean temperature, which is reflected in the smaller change in ocean surface temperature compared with the land. Sensible and latent heat fluxes and net longwave radiation (orange, cyan, and red curves, respectively) from the colder surface decrease and mitigate the impact of the reduced solar flux. Over the land, the net surface flux remains close to equilibrium, as the very cold surface temperatures shut down heat loss via longwave, sensible, and latent heat fluxes. The sensible heat flux actually becomes slightly positive over the land, indicating that advection of relatively warmer air from the ocean warms the free atmosphere sufficiently to warm the land surface via sensible heat flux. Over the land, surface energy is being lost after the impact mostly as longwave radiation (red curves), while, over the ocean, longwave radiation and latent heat (cyan curves) contribute comparably to energy loss. Nonetheless, the reduction in latent heat flux is particularly large over the ocean because surface saturation has increased due to the combination of surface cooling and water vapor injected into the troposphere. During the third year after the 15,000-Tg soot injection, there is a gradual increase in net shortwave flux as the soot settles out of the atmosphere, returning to normal levels in year 7, when the remaining soot is rapidly removed. After 12 y to 15 y, the net surface flux in the 15,000-Tg case, as well as its seasonal cycle, approaches the values seen in the control case, although the surface temperature of the ocean is still a little colder than normal.
Fig. S5.
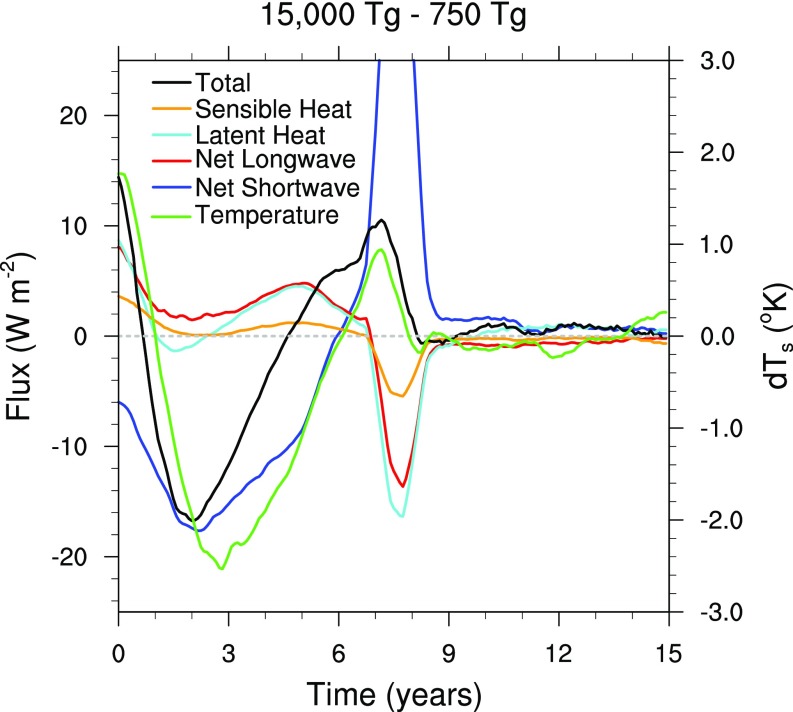
Differences in globally averaged net surface fluxes (left ordinate) and temperature (green curve, right ordinate) between the simulations with 15,000 Tg and 750 Tg of soot. The data have been smoothed with a 1-y running average. The shortwave flux (blue curve) is as much as 18 W⋅m−2 smaller for 15,000 Tg than for 750 Tg at the end of year 2 after impact. However, the effect on the global mean temperature is mitigated by the behavior of the longwave, sensible, and latent heat fluxes, whose magnitude is reduced more in the 15,000-Tg simulation than in the 750-Tg simulation, such that their difference across the two simulations is positive. The net result is that, after 2 y, the global mean temperature is only about 2 °C colder in the 15,000-Tg simulation than in the 750-Tg simulation. Note also that, during the first year, and again after 5 y, the temperature in the 15,000-Tg simulation is actually warmer than in the 750-Tg simulation. Warming in the first year is due to the effect of changes in longwave, sensible, and latent heat fluxes; after 5 y, the shortwave flux is larger in the 15,000-Tg simulation because the soot is removed more quickly in that case.
Remarkably, the omission of a water vapor injection in the 750-Tg case leads to global average cooling that is, at times, larger than obtained in any of the other cases. While the initial reduction in the surface shortwave flux is similar in both 750-Tg cases (Fig. 1C), in the case without added water vapor, there is less soot removal by precipitation and, consequently, a larger soot burden and a slower recovery of the shortwave flux at the surface. In addition, the 750-Tg case with water injection exhibits larger reductions in the magnitude of the latent heat and longwave fluxes, which are consistent with a wetter troposphere (Fig. S6).
Fig. S6.
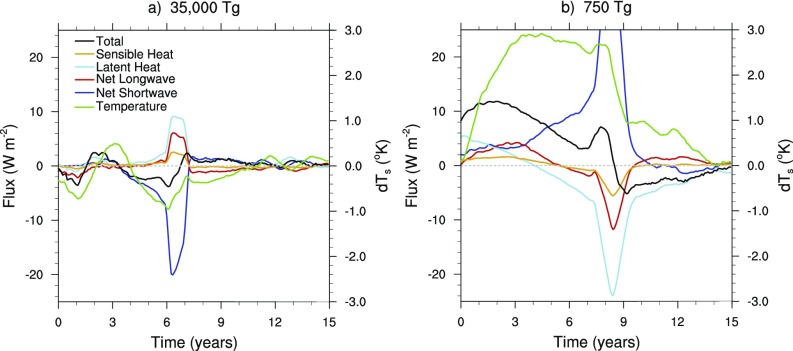
Differences between global average fluxes (left ordinate) from the soot with water injection and soot-only cases for (A) 35,000 Tg and (B) 750 Tg. The data have been smoothed with a 1-y running average. In the 35,000-Tg cases, there is very little difference in any of the surface fluxes until the complete removal of the soot, which has slightly different timing in the two cases. The 750-Tg cases show substantial temperature sensitivity (right ordinate, green curve) to the water vapor injection, resulting from an increased shortwave flux to the surface, together with increased longwave heating when water vapor is included.
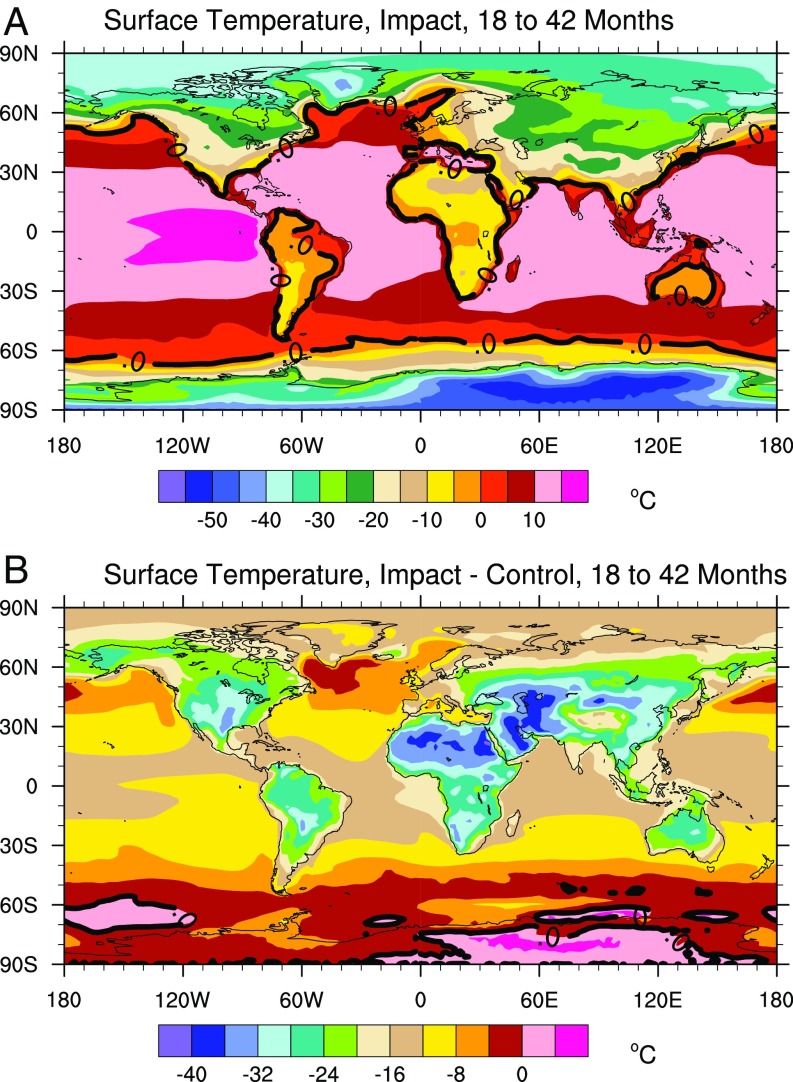
Fig. 5A shows a global map of the simulated annual average surface temperature from 18 mo to 42 mo following the impact, the 2-y period that encompasses the maximum surface cooling, for the 15,000-Tg case, which includes water vapor. Recall that our model uses present-day continental locations and carbon dioxide abundance. It is likely that the Late Cretaceous had higher carbon dioxide than used here, even before impact. While carbon dioxide levels in the Late Cretaceous are not well constrained, recent climate simulations assuming best estimates of carbon dioxide but altered cloud physics suggest that the global average temperature was about 7 °C warmer than today (40). Nevertheless, our calculated temperature changes provide an indication of the magnitude of the cooling that might be expected.
Fig. 5.
(A) The average surface temperature from 18 mo to 42 mo after the impact from the simulation with 15,000 Tg of soot and impact generated water vapor, and (B) the temperature change with respect to the control simulation. The thick black line is the 0 °C contour.
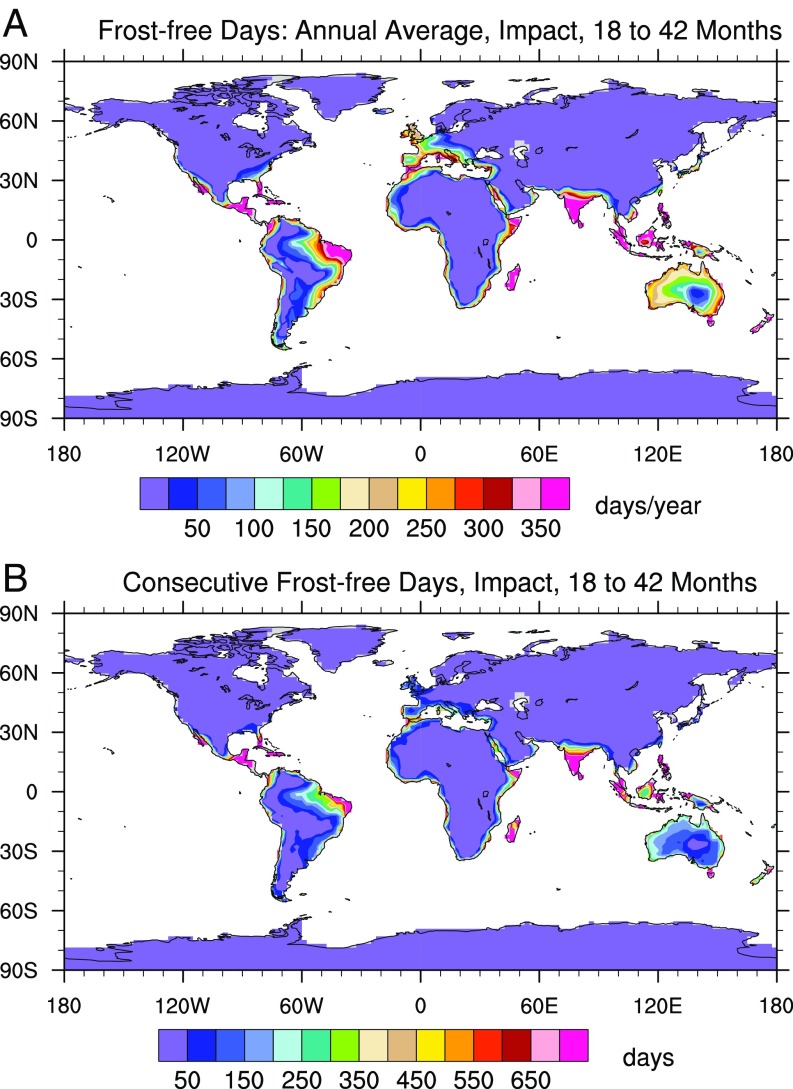
In Fig. 5A, the estimated annual average temperature over land is below freezing over most of the middle and high latitudes (solid black contour in Fig. 5A); this would be modified only slightly even had we accounted for a 7 °C overall warmer climate at the end of the Cretaceous. Below-freezing temperatures at midlatitudes on land, coupled with low light levels, would have made it hard for new vegetation to grow over most of the land. However, there are refugia from annual average freezing temperatures in the Tropics. Fig. 6A shows the annual average frost-free days for the same period as Fig. 5. Relatively large areas of the Tropics and low midlatitudes have between 150 and 350 frost-free days a year during this 2-y period. However, the number of consecutive frost-free days, which may be viewed as representative of the growing season, is much smaller, as shown in Fig. 6B. Long-lasting frost-free conditions are found only in the Tropics. Tropical islands, even moderately sized ones like Madagascar and Indonesia in present-day geography, and coastlines are the most likely places to avoid frost or sporadic freezing. India, Central America, and the eastern tip of South America also have regions of frost-free conditions. The tropical ocean surface remains relatively warm in absolute terms (10 °C to 15 °C) as seen in Fig. 5A, but light levels in the Tropics remain below 10% of normal for about 3 y (Fig. 3), and there are large changes from ambient temperatures in the tropical oceans (Fig. 5B).
Fig. 6.
Frost-free days during the period from 18 mo to 42 mo after the impact from the simulation with 15,000 Tg of soot and impact generated water vapor. Frost-free days are days where the minimum temperature is larger than 0 °C. (A) The average number of frost-free days per year. (B) The longest period of consecutive frost-free days in the two years.
Precipitation.
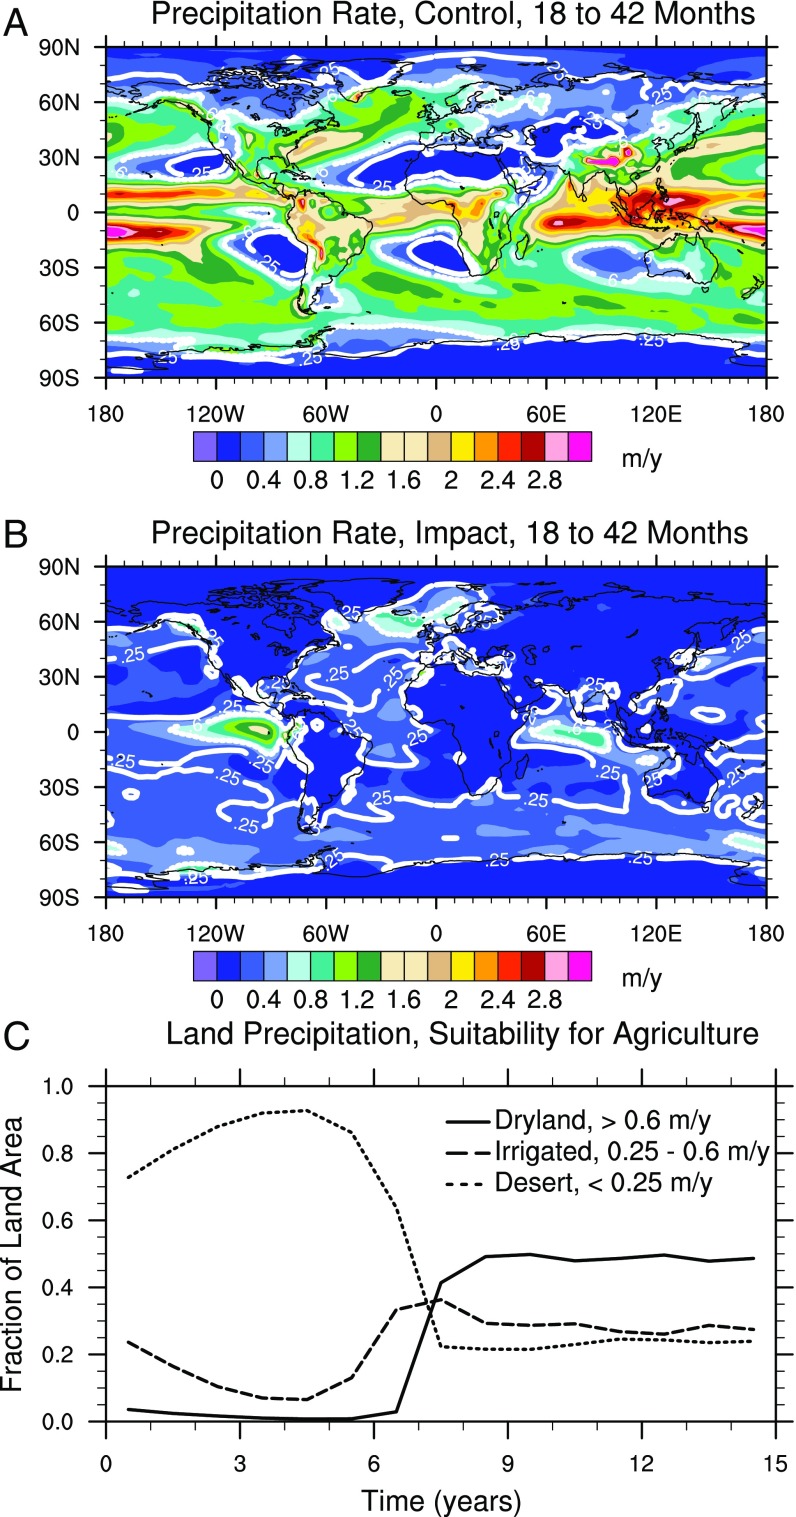
As ocean surface temperatures cool, the hydrologic cycle slows down and precipitation declines. Fig. 4B indicates a 70 to 80% decline in global average precipitation for about 6 y after the impact. Fig. 7 shows precipitation rates for the control simulation and for the impact simulation with 15,000 Tg of soot plus water vapor, averaged over months 18 to 42. During this period, most of the land in the impact case has precipitation rates typical of today’s deserts (<0.25 m⋅y−1), the monsoons shut down, and tropical precipitation is greatly diminished almost everywhere. Land areas downwind of oceans are likely to continue receiving modest precipitation. There are a few locations with more rainfall than normal. Under normal conditions, these regions are generally deserts that lie under the descending branch of the Hadley circulation. With low ocean temperatures, the strength of the Hadley circulation is reduced, subtropical downwelling weakens, and precipitation is enhanced in the deserts.
Fig. 7.
Average precipitation for the period 18 mo to 42 mo from (A) the control simulation and (B) the simulation with 15,000 Tg of soot and impact-generated water vapor. Deserts are defined to be regions with precipitation rates below 25 cm⋅y−1 (solid white line); nonirrigated modern crop plants require about 60 cm⋅y−1 (dashed white line). (C) Evolution of the fraction of land classified as desert (short-dashed), the fraction able to support nonirrigated modern crops (solid), and the fraction that can support modern crops only with irrigation (long-dashed).
Modern crop plants, for which precise water requirements are known, require precipitation rates of about 0.60 m⋅y−1 to survive without irrigation and of 0.25 m⋅y−1 if irrigation is provided. We use the latter value as a proxy for desertification. Fig. 7C shows the evolution of the fraction of land that would be classified as desert, and the fraction that could support irrigated and nonirrigated modern crops. Following the impact, most land experiences desert conditions, and almost no land is capable of supporting plants. Some coastal areas, southern India, and Central America would exceed desert levels of precipitation. These trends reverse in the seventh year after impact, when there is a rapid increase in precipitation, which restores precipitation to normal levels in about 2 y. The modification of the global circulation that accompanies these changes is remarkable (Fig. S7).
Fig. S7.
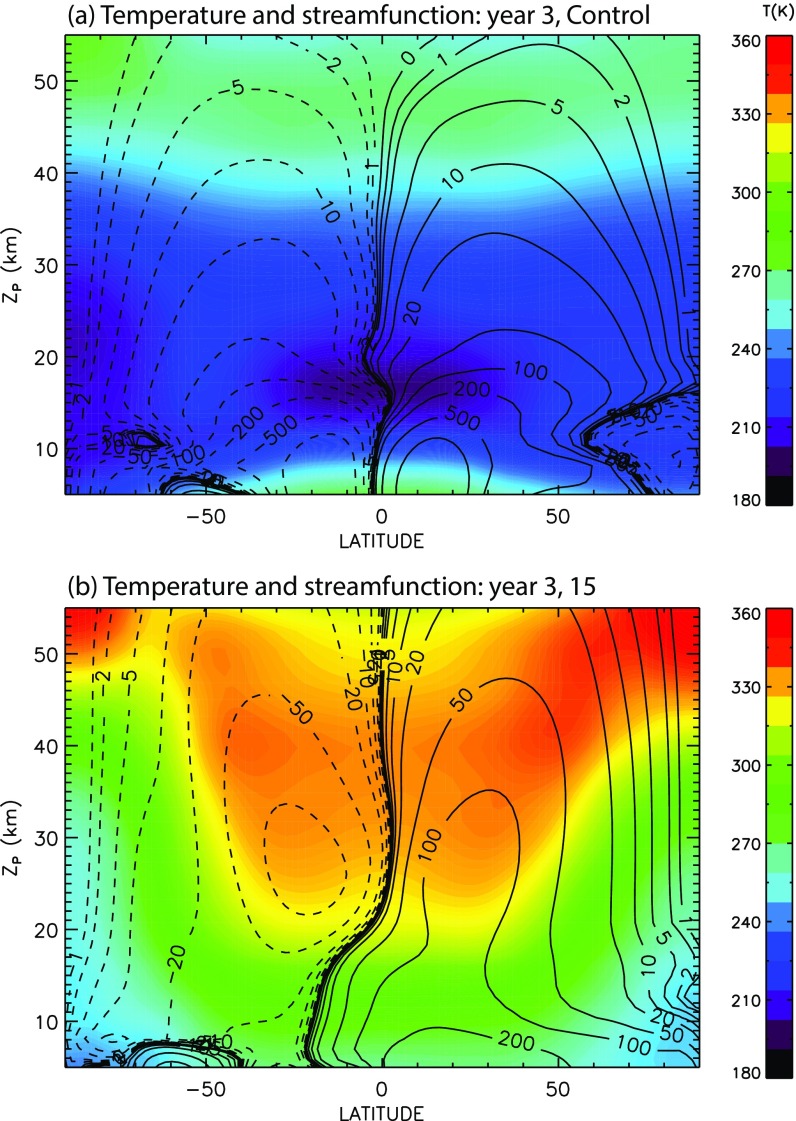
Annual-average TEM meridional stream function (line contours, in kilograms per meter per second) and zonal mean temperature distribution (color shading, in kelvins) for year 3 of the simulation for (A) the control case and (B) the asteroid impact case with 15,000 Tg of soot plus water vapor. Positive stream function contours denote clockwise motion, and negative contours denote counterclockwise motion. In the control simulation (A), a strong Hadley circulation can be seen in the Tropics below the tropopause (∼15 km); typical values in this region range from 200 kg⋅m−1⋅s−1 to over 1,000 kg⋅m−1⋅s−1. Above the tropopause, the mass stream function weakens rapidly due mainly to decreasing air density. The tropical cold trap, the minimum in zonal mean temperature that dehydrates air entering the stratosphere to just a few parts per million by volume under normal conditions, can be seen in the Tropics, centered near 15 km. In the asteroid impact case (B), the mass flux in what remains of the Hadley cell is much weaker (200 kg⋅m−1⋅s−1 or less) and confined to lower altitudes than normal, reflecting the overall weakening of the tropospheric circulation when little solar energy reaches the surface. Above the tropopause, on the other hand, the asteroid impact stream function is much stronger than in the control case, due to heating of the stratosphere by the soot. The temperature distribution is dramatically different from the control case; the troposphere is considerably colder by 10 K to 15 K, but the stratosphere is much warmer, by as much as 50 K to 70 K. The tropical cold trap is eliminated by these temperature increases; the 100-hPa tropical temperature minimum (190 K to 195 K in the control run) disappears and is replaced by very warm temperatures (nearly 300 K). The elimination of the cold trap has profound impacts on the abundance of water vapor in the stratosphere.
Interior Ocean Temperature.
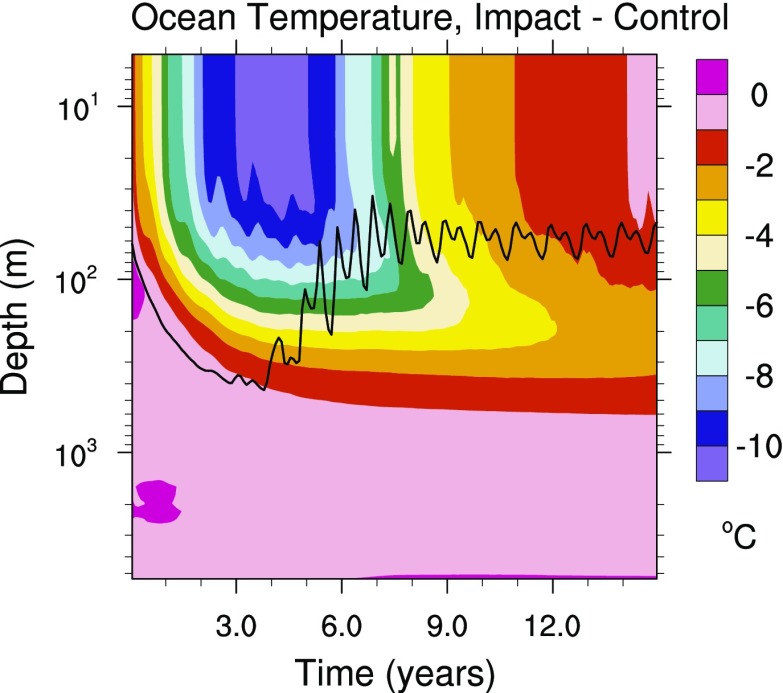
Fig. 8 shows the evolution of the globally averaged, subsurface ocean temperatures relative to the control simulation. Cooling of 10 °C occurs in the top 50 m of the ocean in months 24 to 30 after the impact, with the greatest rate of cooling in months 12 to 24. Therefore, the euphotic zone is not only below the light level needed for photosynthesis for well over 1 y, but this is followed by a prolonged period when it is much cooler than normal. The global average mixed layer deepens from 50 m to 400 m over 3 y as cold water sinks. The water cools by 5 °C to a depth of ∼150 m and remains 3 °C cooler than normal even after 15 y. Ocean temperatures do not change significantly below a depth of about 500 m.
Fig. 8.
Difference in global average ocean temperature between the simulation with 15,000 Tg of soot and impact-generated water vapor and the control simulation. The solid line is mixed layer depth.
Many plankton species are sensitive to ocean temperature. While some can tolerate a wide range of temperatures, others have a narrow range in which they grow. Numerous species have very depressed or no growth if the temperature declines by 10 °C from the temperature of their optimum growth rate (41). Likewise, many fish have limited temperature ranges and have difficulty coping with sudden temperature changes (42). Consequently, reducing the ocean temperature by 10 °C in the euphotic zone may have led to the extinction of some plankton and fish if they had not already starved to death.
Upper Atmosphere.
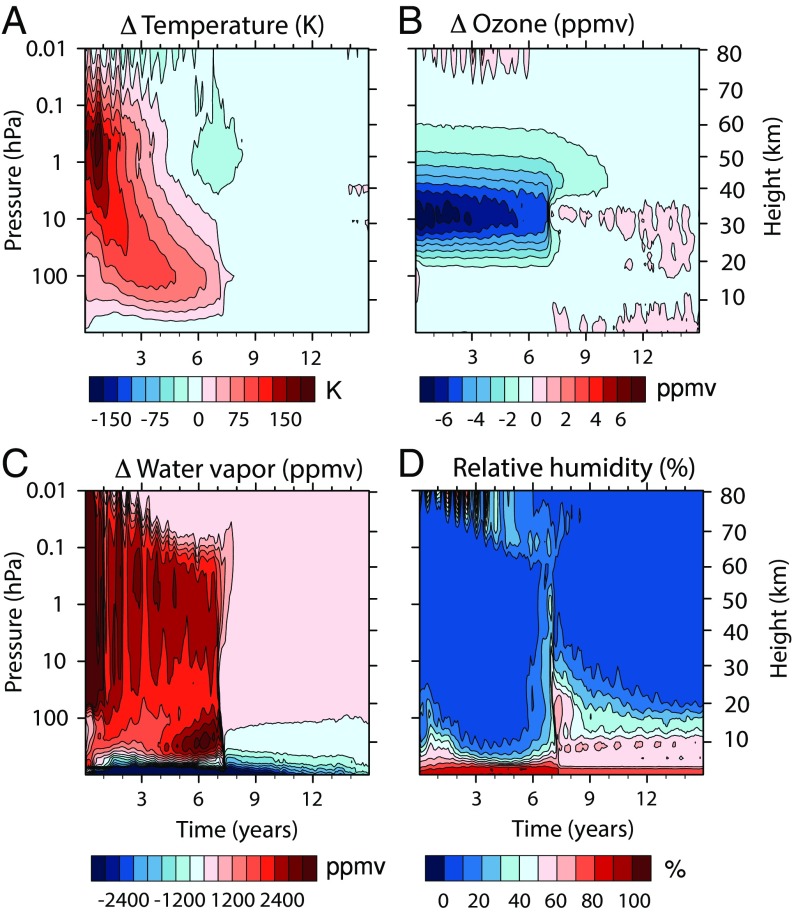
While the troposphere cools after the soot injection, the upper atmosphere warms because the soot absorbs sunlight. Fig. 9A shows that temperatures at altitudes near the tropopause, about 15 km, increase by 50 °C to 100 °C for several years following impact, while, from 45 km to 60 km, temperatures increase by more than 200 °C for the 15,000-Tg soot injection. The altitude of the maximum temperature change migrates downward with time as the soot settles out of the atmosphere. Three years after the impact, the largest temperature perturbations are in the stratosphere, below 1 hPa.
Fig. 9.
Evolution of the change in vertical structure of (A) global average atmospheric temperature, (B) ozone, (C) water vapor, and (D) relative humidity after the impact in the 15,000-Tg simulation. All plots show the difference between the impact and the control simulations, except for relative humidity, which shows the absolute value.
The tropical tropopause normally acts as a cold trap that restricts the water vapor content of parcels entering the stratosphere to no more than a few parts per million by volume (ppmv) (43). The very large increase in tropopause temperature allows extremely large increases in stratospheric water vapor. This process can be appreciated from Fig. 9C, where a “plume” of high water vapor enters the stratosphere at the end of the first year after impact, when the global tropopause temperature has increased by more than 50 °C. Note that this injection is distinct from the large values present above 50 hPa starting immediately after impact, which are caused by splashed and vaporized water from the impact and from water vapor produced from global fires. Note also that, after the first year following impact, the input of water vapor from the troposphere diminishes; this is a result of greatly diminished convective activity that results from cooling of the troposphere as the soot screens sunlight (Figs. 1C, 2, and 7). Stratospheric water vapor is very strongly perturbed for 7 y following the asteroid impact, with global average mixing ratios exceeding 1,000 ppmv. However, immediately thereafter, there is a very rapid decrease to nearly normal amounts; the cause of this abrupt dehydration event is addressed in Abrupt Termination.
The increases in stratospheric temperature and water vapor have profound impacts on the stratospheric ozone layer (Fig. 9B). At 10 hPa, where the largest ozone mixing ratios normally occur, the mixing ratio is reduced by up to 8 ppmv; this constitutes a decrease of about 80% with respect to its normal abundance in today’s stratosphere (∼10 ppmv). For smaller soot injections, warmer temperatures increase temperature-dependent ozone loss rates, resulting in large ozone loss (23, 44). For the 15,000-Tg soot injection, the loss of light due to absorption by soot also shuts down ozone production in the lower stratosphere, down to about 70 hPa. Even after the stratosphere begins to cool, after about 3 y (Fig. 9A), ozone depletion remains severe as a result of catalytic destruction by odd-hydrogen species (HOX = H + OH + HO2) derived from excess water vapor. The abundance of HOX in the stratosphere increases by a factor of 20 to 40 following the impact and remains highly elevated until about 80 mo after the impact, when it quickly returns to near-normal values following the stratospheric dehydration event at that time. Once temperature and HOX mixing ratios return to normal, ozone recovers within a few months (Fig. 9B).
Fig. 10A shows that the column abundance of ozone collapses to as little as 20% of normal values between years 1 and 6 to 7 as a result of widespread stratospheric loss in the simulations with water injection. The simulations without water injection also show severe depletion, but with the largest reductions delayed until year 2, when water vapor reaches the stratosphere in large amounts following the disappearance of the tropical cold trap. The stratospheric ozone layer absorbs UV radiation in the wavelength range 250 nm to 400 nm. Large reductions in the total ozone column lead to large increases in UV irradiance at the surface, which can be quantified in terms of the commonly used UV index (UVI) (45). The UVI is a nondimensional measure of UV irradiance weighted by its erythemal potential (the ability to produce sunburn in unprotected skin). Values above 11 represent a high risk of harm from unprotected sun exposure, and are likely to produce sunburn in fair-skinned people in a few minutes. Current equatorial, clear-sky maxima at noon are around 12 to 14.
Fig. 10B shows that the UVI is very low compared with its unperturbed value for several years following the asteroid impact, because the large burden of soot in the stratosphere absorbs UV radiation before it reaches the surface. However, starting in the sixth year after impact, the UVI rises dramatically, reaching levels about 3 times larger than found in the control case, as the soot load decreases sufficiently for light to reach the surface while the ozone layer has not yet recovered. The increased UV flux translates to UVI values of ∼40 in the Tropics, which is similar to the highest values found by Pierazzo et al. (46) for a 1-km asteroid impact in the ocean. In that study, ozone loss was due mainly to catalytic destruction by halogen species (Cl and Br) injected as ocean water splashed to high altitudes (which are not considered here). Note that the timing and magnitude of the UVI “spike” in our calculations is dictated by the evolution of the soot burden and the occurrence of the stratospheric dehydration event and thus varies among the simulations (Figs. 1B and 10B).
Ozone column reductions comparable to the decrease obtained in our 15,000-Tg soot simulation have only been observed in Antarctica following the development of the ozone hole. However, the latter are not as severe, occur for no more than a couple of months during Antarctic spring, and are limited to high latitudes where the solar zenith angle is large (47). Lack of observations of the behavior of the biota following large, sustained, worldwide ozone losses precludes estimating how the K−Pg organisms might have responded to large ozone losses. Studies of individual organisms show that, while many have protective mechanisms to prevent or repair DNA damage, many others are highly sensitive to UV light (46). UV damage can also affect pollen, which can limit plant recovery (48, 49). Nevertheless, the period of exposure to very high values of UVI in our simulations is no more than 2 y, considerably shorter than obtained by Pierazzo et al. (46). In Pierazzo et al.’s study, the stratosphere remains transparent to solar radiation, whereas the large burden of soot in our simulations prevents sunlight from reaching the surface until shortly before the abrupt dehydration event that occurs 7 y to 9 y after impact, depending on the scenario in question (Fig. 10B). Furthermore, catalytic ozone loss in our simulations is due to high temperatures and enhanced HOX in the stratosphere, and it ends abruptly as temperatures return to normal and the water vapor source of HOX species is removed by the dehydration event.
Abrupt Termination.
For the 15,000-Tg case, Fig. 9C shows that, ∼90 mo after the impact, stratospheric water vapor decreases very rapidly from over 1,000 ppmv to near-normal values; and Fig. 1A shows a coincident very rapid decline in simulated soot burden. The sudden decline in water vapor is caused by feedback with stratospheric temperatures. As soot levels decline due to sedimentation, absorption of solar radiation by the soot decreases and the stratosphere cools, while infrared cooling to space remains high because of the large water vapor mixing ratio. By 54 mo after the impact, temperatures in the atmosphere above 1 hPa have returned to values close to the control case (Fig. 9A), and, by 90 mo, even the lower stratosphere, below 10 hPa, has temperatures within 25 °C of the unperturbed value. At this point, the stratosphere becomes supersaturated and can no longer support water vapor mixing ratios of 1,000 ppmv. This phenomenon can be appreciated from the abrupt increase in relative humidity shown in Fig. 9D. Water vapor then begins to nucleate on the soot, and the ice particles grow large enough to be removed by precipitation. Water vapor mixing ratios decline by a factor of 100 or more in a few months. The falling ice particles scavenge soot, reducing its abundance rapidly, which further decreases solar heating. By the beginning of the eighth year after the impact, stratospheric temperatures return to near-normal values, the stratosphere becomes much drier (although still wetter than normal), HOX mixing ratios decline precipitously, most of the soot burden is removed, and ozone returns to near-normal levels.
The rapid removal of the remaining stratospheric soot by the dehydration event signals the end of the short-term climate forcing caused by the asteroid impact. Similar behavior is obtained in all cases examined (Figs. 1, 4, and 10). While the recovery of the stratosphere is fast (Fig. 9), the troposphere remains colder and drier than normal through the end of our simulation (15 y after impact) because the ocean itself is colder and recovers slowly due to its large thermal inertia (Fig. 4 C and D).
Discussion
According to Wolbach et al. (4), about 15,000 Tg of fine soot and 41,000 Tg of coarse soot is present in the millimeter-thick, global K−Pg boundary layer, which also contains iridium that identifies the layer as the result of an asteroid impact (1). The soot is believed to have originated from global fires (4, 5, 8). These fires would have been an efficient extinction mechanism for large land animals (7, 34). Placing 15,000 Tg of fine soot into our global climate model shows that 95% of the soot would be removed from the atmosphere in a year, defining the timescale that is represented by the layer in land deposits. On the other hand, it might take decades for the small soot particles to fall to the bottom of the oceans, assuming no zooplankton were present to consume it and excrete it in large fecal pellets.
Sunlight absorption by soot reduces surface shortwave irradiance to levels lower than found today at the base of the ocean euphotic zone for a year or more, which would trigger a collapse of the ocean food chain and extinctions of marine organisms that depended on the photosynthetic productivity of the euphotic zone (31–33). There are no mechanisms other than impacts that have been suggested to produce such low light levels in post-Cambrian Earth history. There are no refugia from the low light levels. However, even for a 15,000-Tg soot injection, light levels would rise above 1% of normal (the level below which photosynthesis is severely inhibited) in the Tropics after 2 y following the impact, and a year earlier in polar latitudes.
The lack of sunlight leads to dramatic cooling of the planet, by over 15 °C on a global average, 11 °C over the ocean, and 28 °C over land. Global average temperature cooling of about 5 °C occurred during the last ice age relative to the warmest part of the Holocene (50). Therefore, the cooling following the K−Pg impact was larger than that in an ice age and much more sudden, but of much shorter duration (years vs. tens of thousands of years). Sudden ocean cooling is consistent with the TEX86 paleo-sea surface temperature proxy record from Vellekoop et al. (51), which shows cooling of 7 °C over a period of months to decades postimpact. There were likely refugia from freezing temperatures on land in the Tropics, and along coastlines following the K−Pg impact. Temperatures in the ocean euphotic zone decline 10 °C on a global average in our simulations, but temperatures below 500 m depth are not affected, such that the deep ocean would have been a refuge from temperature changes.
It should be noted that global cooling such as obtained for our 15,000-Tg soot case can also occur under different scenarios. For example, Brugger et al. (20) have calculated cooling of similar magnitude by assuming that the asteroid impact injected a very large amount of sulfur (100 Gton) into the stratosphere, which then formed sulfate aerosols and scattered sunlight. This amount of sulfur produces reductions in sunlight at the surface comparable to those obtained from a relatively small injection of soot, 750 Tg, because soot is a much more efficient absorber of sunlight. Interestingly, our calculations for a 750-Tg soot injection produce cooling comparable to our 15,000- and 35,000-Tg cases. In general, any mechanism that can reduce sunlight at the surface to a few percent of normal values for a protracted period is sufficient to induce severe cooling (tens of degrees Celsius) lasting as long as the sunlight-blocking material remains in the stratosphere. However, a large injection of sulfur cannot produce the near-total darkness, lasting for almost 2 y, that follows large injections of soot. Thus, a massive injection of soot into the stratosphere adds the effects of darkness on the food chain to the stresses of global cooling and decreased precipitation. Interestingly, a soot injection of only 5,000 Tg, 3 times smaller than the 15,000-Tg estimate of Wolbach et al. (4), still reduces light levels below 1% for 1 y. This result implies that extensive but less-than-global fires, such as suggested in some models for the distribution of impact debris (52, 53), would also suppress primary productivity for a prolonged period.
While the surface and lower atmosphere cool due to screening of sunlight by the airborne soot, the tropopause warms by over 50 °C and the upper atmosphere by as much as 200 °C for a 15,000-Tg soot injection. The warm tropopause temperatures eliminate the tropical cold trap and allow water vapor mixing ratios to increase to well over 1,000 ppmv in the stratosphere. High stratospheric temperatures accelerate the destruction of ozone via the O + O3 reaction, and large water vapor mixing ratios are a source of HOX radicals, which are efficient catalysts of ozone destruction. As a consequence of the enormous increases in temperature and water vapor following the impact, the ozone layer is partially removed for 7 y, with ozone column amounts dropping as low as 20% of normal on a global average. However, absorption of sunlight by the soot protects the surface from UV light, except for a period of about 2 y during the sixth to eighth years after the impact. During this period, UV light is able to reach the surface at highly elevated and harmful levels. High UV exposure at the surface ends when water, and therefore HOX species, is removed as the stratosphere cools and becomes supersaturated, resulting in an abrupt dehydration event during year 7 after the impact. Longer-term loss of ozone could have occurred via injection into the stratosphere of halogen species (Cl, Br) from splashed seawater, as shown by Pierazzo et al. (46), but these were not included in the present calculations.
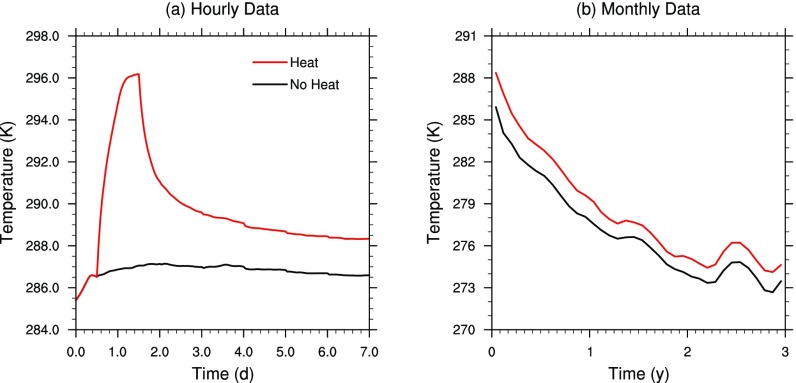
Toward the end of this investigation, we devised a solution to the numerical instability problem that occurred when simulating massive CO2 increases and repeated the 15,000-Tg case adding an injection of 2.46 × 10⁶ Tg of CO2 (8), about 0.78 of the present-day atmospheric mass of this gas. Global average temperatures in the simulations with and without additional CO2 diverge after the impact-generated soot is removed. After 15 y, the additional CO2 produces a 1 °C increase in global surface temperature and a 5% increase in the global ozone column. Thus, CO2 affects the longer-term evolution of the climate, but not its short-term response, consistent with the results of Brugger et al. (20) and the K−Pg temperature reconstruction from Vellekoop et al. (51). We also repeated the 15,000-Tg simulation including 4.6 × 10²² J of heat from combustion in global fires (Fig. S8 for details). During the fires, the global average surface temperature increases by 10 °C (Fig. S8A); however, after 3 y, the difference relative to the simulation that omits heat input from the fires is only about 1 °C (Fig. S8B).
Fig. S8.
Evolution of global average surface temperature from a simulation with 15,000 Tg of soot and heat from combustion by global fires (red), and a similar simulation without the added heat (black) using (A) hourly data for 1 wk and (B) monthly average data for 3 y. The heat from fires is estimated to be 4.6 × 10²² J based upon a land biomass of 2 g⋅cm−2 and the energy from combustion for air-dried wood, 1.5 × 10⁴ J⋅g−1. Heat from the fires is emitted into the lowest three model layers (surface to ∼900 hPa), and the fires are active for the first 12 h to 36 h of the simulation. During this time, there is a sharp rise of 10 °C in surface temperature; however, the temperature difference quickly drops to ∼2 °C after a week. There is an increase in surface temperature of up to 3 °C during the first few months as the added heat is transferred from the atmosphere to the surface, but this is gradually reduced down to about 1 °C by the end of 3 y, as the loss of downwelling solar radiation dominates the surface energy budget, and some of the added heat radiates to space. The maximum cooling of 15 °C in this simulation occurs during the third year (Fig. 4), so the heating from combustion causes only a 7% reduction of this peak cooling. The sharp initial warming would be reduced if the fires were assumed to occur over a longer period.
The transient consequences of a large asteroid impact followed by global fires, which include suppression of primary productivity during a protracted period of darkness, severe and widespread cooling at the surface, and high doses of UV radiation, appear to be enough to account for nearly instantaneous and widespread species extinction at the K−Pg boundary. Further work should consider Late Cretaceous geography and climate (54), halogen injections from seawater, and more-complex aerosol microphysics, including organic carbon, oxidation, and sulfate coatings.
SI Text
Here, we provide additional background on how the soot emissions used in this study were determined, describe some of the characteristics of the aerosol microphysics, give details about how WACCM was modified to remain stable under the very large perturbations experienced in these simulations, and indicate how the calculations of the surface UVI were carried out.
Soot Emission and Removal
We use the estimates of aerosol and tracer injections from the K−Pg impact described by Toon et al. (8). As regards the soot, we are guided by Wolbach et al. (4, 5), who measured the elemental carbon found in samples of the K−Pg boundary clay. Samples were first etched to remove kerogen (organic carbon), and the remaining insoluble carbon was then separated into samples, including small, “aciniform” soot clusters plus other larger charcoal or carbon particles. We use the terms “fine soot” and “coarse soot” to refer to these two categories. Using samples from five sites, Wolbach et al. (5) estimated that 70,000 Tg of elemental carbon is present in the K−Pg layer, of which 50% (35,000 Tg) is fine soot. With the addition of six more sites, Wolbach et al. (4) estimated total elemental carbon to be 56,000 Tg, of which 26.6% (15,000 Tg) is fine soot. They measured the size distribution of the fine soot particles but did not determine that of the coarse soot.
Wolbach et al. (4, 5) and others (7, 8) have assumed that the soot at the K−Pg boundary was caused by global fires ignited by heat from falling spherules. These fires would not have been normal forest fires, but would have acted like large firestorms. Our model is unable to simulate explicitly transport in mesoscale convection, as the horizontal resolution is 2° (∼200 km). Nevertheless, calculations made with mesoscale, nonhydrostatic models indicate rapid lofting of small soot particles to the upper troposphere and even into the stratosphere in intense firestorms (8, 22–25). On the other hand, the coarse particles are more likely to have remained lower in the atmosphere. Thus, we follow the recommendation of Toon et al. (8) and inject the fine soot in a Gaussian near the tropopause and the coarse soot in a half-Gaussian near the surface.
Organic carbon would also have been emitted by the fires, but we have no estimates of these emissions. Organics deposited at the K−Pg boundary were likely very different from what is found at present; for example, grasses had barely evolved at the time. Even today, we do not understand which fuels produce brown carbon. Mass fires are much hotter than normal forest fires and may consume the organics in the fire, as suggested by the higher emission rates for soot in intense fires. Organics are also lost by reaction with OH and ozone. The loss rates are poorly known for modern organics, but lifetimes can be on the order of days (55). Thus, while brown carbon would likely have contributed to the short-term aerosol properties, it is not clear that brown carbon would be a significant long-term component of the aerosol lofted into the stratosphere. Because of the uncertainty in the emissions and the added complexity, we do not include organic carbon in our simulations. Pausata et al. (56) did include emissions of 45 Tg of organic carbon and 5 Tg of black carbon in simulations of regional nuclear war, and found that the added organics increases the surface cooling, but that the larger particle size reduces the lifetime of the aerosols, and thus the duration of the climate effects, from 20 y to 10 y. The climate effects in our simulations are of shorter duration and are terminated by an abrupt dehydration event, so they are likely less sensitive to the particle size.
The soot in our simulations is subject to both wet and dry deposition. Fig. S2 shows the evolution of the soot burden and cumulative wet and dry deposition for a simulation with a total of 56,000 Tg of soot, of which 41,000 Tg is coarse soot and 15,000 Tg is fine soot. Soot emissions occur from hours 12 to 36, with a sharp increase in both wet and dry deposition occurring near hour 28, 16 h into the fires (Fig. S1A). By the end of the first week, 5.5 d after the end of the fires, the total soot burden is reduced to 50% of the original emission, with 36% being lost to wet deposition and 14% lost to dry deposition. By the end of the first year (Fig. S1B), the soot burden has been reduced to 4% of the total emission, with 57% removed by wet deposition and 38% removed by dry deposition. Assuming the soot that is removed first is the coarse soot near the surface, the lifetime of the coarse soot is 3.4 d, with 75.8% removed by wet deposition, and the lifetime of the fine soot is 5.5 mo, with 60% removed by wet deposition. The lifetime for the coarse soot is similar to an estimate of 3.2 d for the lifetime of black carbon from Jacobson (57). The fine soot has the same lifetime as that for soot injected into the upper troposphere from regional nuclear war calculated by Mills et al. (44) but is shorter than the approximately 1-y lifetime of volcanic aerosols injected into the stratosphere (58). Because the lifetime of the coarse soot is so short, the particle size and composition of these aerosols is unlikely to have a major effect on the overall climate response, so, in a few cases, we omitted the coarse soot entirely.
Aerosol Microphysics
Environmental effects from aerosols from a large asteroid impact extend into the mesosphere, and they have important interactions with atmospheric chemistry; therefore, we implemented the CARMA model in WACCM for this experiment. CARMA (12) is a sectional aerosol package, where each aerosol is tracked in a set of size bins. CARMA allows the size distribution of the aerosols to evolve freely, which is necessary when simulating large aerosol injections, as in this study. For the soot aerosol, the fractal treatment of Wolf and Toon (13) is used to better represent the effects of particle aggregation. Optical properties for the soot aggregates are calculated using a mean field approximation (59) assuming a real refractive index of 1.8 and an imaginary refractive index of 0.67. The shortwave optical properties of the fractal soot particles are dependent on monomer size, which is fixed at emission, but are largely independent of particle size, which does increase due to coagulation because of the large soot emissions used in our simulations (60). The Rapid Radiative Transfer Model for GCMs (RRTMG) (61), a radiation package within CESM, is used to include the radiative effects of the impact-generated aerosols.
It is likely that, initially, the particles would have a mixed composition of organic and elemental carbon; however, it is hard to know whether one can extrapolate from normal forest fires to what the resulting aerosol would be from a global firestorm. While it would be desirable to treat the aerosol as an internal mixture, knowing the emission of the other aerosols components and being able to treat oxidation of the aerosols is a level of complexity beyond the current capabilities of our model. The optical depth of coated soot particles is about 1.5 times larger than for pure soot particles (62). Thus, our simulations may underestimate the total absorption of the soot particles; however, these particles would also be larger, so their lifetime would be reduced (56).
Model Stability
Because the atmospheric response to the impact perturbations is very large, several adjustments to the model tuning and physical parameterizations had to be made to keep the model stable. With these changes, the model remained stable when driven by the exceptionally large chemical and radiative perturbations caused by the impact; we also verified that these modifications had minimal effect on the (unperturbed) control simulation.
Changes to Model Dynamics.
In WACCM, the dynamical core normally processes a model time step with several smaller dynamics substeps. One phase of the substepping involves a vertical remapping of the model state back to standard hybrid levels. At 1.9° × 2.5° horizontal resolution, WACCM normally uses eight dynamical substeps and performs a vertical remapping every four substeps. For our experiments, we increased the number of dynamical substeps to 128 and carried out the vertical remapping every 8 substeps. In the dynamics, the tendencies on temperature and winds are normally applied fully at the beginning of the dynamical step. Because of the very large temperature and wind tendencies generated by the physical parameterizations in our experiments, we apply a fraction of the tendencies throughout the dynamical step. For temperature, 1/16 of the tendency is applied every vertical remapping step, and, for the winds, 1/128 of the tendency is applied each dynamical substep.
Changes to Model Physics.
In WACCM, a moist adiabatic adjustment is performed in the troposphere and lower stratosphere, and a dry adiabatic adjustment is performed for the top three layers of the model. Because of the large heating rates, we have extended the dry adjustments to cover all model levels above the level where the moist adjustment stops. The dry adiabatic adjustment parameterization was also modified to mix all tracers in regions of instability rather than just mixing temperature and water vapor. The WACCM chemistry mechanism normally uses explicit calculations for several species that do not change rapidly; however, for these experiments, all of the chemical species are treated implicitly. The RRTMG radiation code was not designed to handle the large temperature and water vapor perturbations generated by our experiments, so some modifications were made to RRTMG to limit extrapolation in lookup tables for optical properties, ensuring nonnegative optical depths and model stability. Because of the large relative humidity produced in the upper atmosphere, the cloud physics parameterization was extended to be active over the entire model domain. The CO2 injections produced very large mixing ratios of this gas in the upper atmosphere, exceeding the range over which the non-LTE CO2 cooling parameterization was designed to operate, so we limited the mixing ratio accepted by the parameterization to 700 ppmv. Enhanced cooling in the CO2 injection case also caused very large temperature gradients in the top layers of the model, so the upper boundary condition for thermospheric temperature was relaxed. Instead of using a temperature from the Mass Spectrometer-Incoherent Scatter (MSIS) empirical model (63) for the upper boundary condition (64), the average of the MSIS and top layer temperatures are used. This choice reduces the temperature gradient sufficiently to prevent failure of the vertical diffusion parameterization.
UVI
WACCM does not calculate the UVI, so off-line calculations were performed with the Tropospheric UV and Visible Radiation Model (65), using monthly and zonally averaged output from the CESM simulations and assuming local noon conditions.
Acknowledgments
Initial support for C.G.B. and R.R.G. was provided by NASA Grant NNX09AM83G. O.B.T. was supported by the University of Colorado. The authors wish to thank S. Madronich for his comments and for the use of the Tropospheric UV and Visible model. Computational resources supporting this work were provided by both the NASA High-End Computing Program through the NASA Advanced Supercomputing Division at Ames Research Center and by the National Center for Atmospheric Research (NCAR) Wyoming Supercomputing Center, sponsored by the National Science Foundation (NSF) and the State of Wyoming, and supported by NCAR's Computational and Information Systems Laboratory. NCAR is sponsored by NSF.
Footnotes
The authors declare no conflict of interest.
This article is a PNAS Direct Submission.
This article contains supporting information online at www.pnas.org/lookup/suppl/doi:10.1073/pnas.1708980114/-/DCSupplemental.
References
- 1.Alvarez LW, Alvarez W, Asaro F, Michel HV. Extraterrestrial cause for the cretaceous-tertiary extinction. Science. 1980;208:1095–1108. doi: 10.1126/science.208.4448.1095. [DOI] [PubMed] [Google Scholar]
- 2.Schulte P, et al. The Chicxulub asteroid impact and mass extinction at the Cretaceous-Paleogene boundary. Science. 2010;327:1214–1218. doi: 10.1126/science.1177265. [DOI] [PubMed] [Google Scholar]
- 3.Renne PR, et al. Time scales of critical events around the Cretaceous-Paleogene boundary. Science. 2013;339:684–687. doi: 10.1126/science.1230492. [DOI] [PubMed] [Google Scholar]
- 4.Wolbach WS, Gilmour I, Anders E. Major wildfires at the Cretaceous/Tertiary boundary. Geol Soc Am Spec Pap. 1990;247:391–400. [Google Scholar]
- 5.Wolbach WS, et al. Global fire at the Cretaceous-Tertiary boundary. Nature. 1988;334:665–669. [Google Scholar]
- 6.Harvey MC, et al. Combustion of fossil organic matter at the Cretaceous–Paleogene (K–P) boundary. Geology. 2008;36:355–358. [Google Scholar]
- 7.Robertson DS, et al. K-Pg extinction: Reevaluation of the heat-fire hypothesis. J Geophys Res. 2013a;118:329–336. [Google Scholar]
- 8.Toon OB, Bardeen CG, Garcia RR. Designing global climate and atmospheric chemistry simulations for 1 km and 10 km diameter asteroid impacts using the properties of ejecta from the K-Pg impact. Atmos Chem Phys. 2016;16:13185–13212. [Google Scholar]
- 9.Kaiho K, et al. Global climate change driven by soot at the K-Pg boundary as the cause of the mass extinction. Sci Rep. 2016;6:28427. doi: 10.1038/srep28427. [DOI] [PMC free article] [PubMed] [Google Scholar]
- 10.Hurrell JW, et al. The Community Earth System Model: A framework for collaborative research. Bull Am Meteorol Soc. 2013;94:1339–1360. [Google Scholar]
- 11.Marsh DR, et al. Climate change from 1850 to 2005 simulated in CESM1(WACCM) J Clim. 2013;26:7372–7391. [Google Scholar]
- 12.Bardeen CG, et al. Numerical simulations of the three-dimensional distribution of meteoric dust in the mesosphere and upper stratosphere. J Geophys Res. 2008;113:D17202. [Google Scholar]
- 13.Wolf ET, Toon OB. Fractal organic hazes provided an ultraviolet shield for early Earth. Science. 2010;328:1266–1268. doi: 10.1126/science.1183260. [DOI] [PubMed] [Google Scholar]
- 14.de Laat ATJ, et al. A solar escalator: Observational evidence of the self-lifting of smoke and aerosols by absorption of solar radiation in the February 2009 Australian Black Saturday plume. J Geophys Res. 2012;117:D04204. [Google Scholar]
- 15.Smit J. The global stratigraphy of the Cretaceous-Tertiary boundary impact ejecta. Annu Rev Earth Planet Sci. 1999;27:75–113. [Google Scholar]
- 16.Johnson BC, Melosh HJ. Formation of spherules in impact produced vapor plumes. Icarus. 2012;217:416–430. [Google Scholar]
- 17.Pierazzo E, Kring DA, Melosh HJ. Hydrocode simulation of the Chicxulub impact event and the production of climatically active gases. J Geophys Res. 1998;103:28607–28625. [Google Scholar]
- 18.Pope KO, Baines KH, Ocampo AC, Ivanov BA. Energy, volatile production, and climatic effects of the Chicxulub Cretaceous/Tertiary impact. J Geophys Res. 1997;102:21645–21664. doi: 10.1029/97je01743. [DOI] [PubMed] [Google Scholar]
- 19.Pierazzo E, Hahmann AN, Sloan LC. Chicxulub and climate: Radiative perturbations of impact-produced S-bearing gases. Astrobiology. 2003;3:99–118. doi: 10.1089/153110703321632453. [DOI] [PubMed] [Google Scholar]
- 20.Brugger J, Feulner G, Petri S. Baby, it’s cold outside: Climate model simulations of the effects of the asteroid impact at the end of the Cretaceous. Geophys Res Lett. 2017;44:419–427. [Google Scholar]
- 21.Wolbach WS, Lewis RS, Anders E. Cretaceous extinctions: Evidence for wildfires and search for meteoritic material. Science. 1985;230:167–170. doi: 10.1126/science.230.4722.167. [DOI] [PubMed] [Google Scholar]
- 22.Robock A, et al. Nuclear winter revisited with a modern climate model and current nuclear arsenals: Still catastrophic consequences. J Geophys Res. 2007b;112:D13107. [Google Scholar]
- 23.Mills MJ, et al. Multidecadal global cooling and unprecedented ozone loss following a regional nuclear conflict. Earths Future. 2014;2:161–176. [Google Scholar]
- 24.Malone RC, Auer LH, Glatzmaier GA, Wood MC, Toon OB. Influence of solar heating and precipitation scavenging on the simulated lifetime of post-nuclear war smoke. Science. 1985;230:317–319. doi: 10.1126/science.230.4723.317. [DOI] [PubMed] [Google Scholar]
- 25.English JM, et al. Microphysical simulations of large volcanic eruptions: Pinatubo and Toba. J Geophys Res. 2013;118:1880–1895. [Google Scholar]
- 26.Morel A. Optical modeling of the upper ocean in relation to its biogenous matter content (case I waters) J Geophys Res. 1988;93:10,749–10,768. [Google Scholar]
- 27.Gattuso J-P, et al. Light availability in the coastal ocean: Impact on the distribution of benthic photosynthetic organisms and their contribution to primary production. Biogeosciences. 2006;3:489–513. [Google Scholar]
- 28.Andrews DG, Holton JR, Leovy CB. Middle Atmosphere Dynamics. Academic; New York: 1987. [Google Scholar]
- 29.Molina E, Arenillas I, Arz JA. Mass extinction in planktic forminifera at the Cretaceous/Tertiary boundary in subtropical and temperate latitudes. Bull Soc Geol Fr. 1998;169:351–363. [Google Scholar]
- 30.Behrenfeld MJ, Falkowski PG. Photosynthetic rates derived from satellite-based chlorophyll concentration. Limnol Oceanogr. 1997;42:1–20. [Google Scholar]
- 31.Milne PH, McKay CP. Response of marine plankton communities to a global atmospheric darkening. Geol Soc Am Spec Pap. 1982;190:297–303. [Google Scholar]
- 32.Pollack JB, Toon OB, Ackerman TP, McKay CP, Turco RP. Environmental effects of an impact-generated dust cloud: Implications for the cretaceous-tertiary extinctions. Science. 1983;219:287–289. doi: 10.1126/science.219.4582.287. [DOI] [PubMed] [Google Scholar]
- 33.Robertson DS, et al. K-Pg extinction patterns in marine and freshwater environments: The impact winter model. J Geophys Res Biogeosci. 2013;118:1006–1014. [Google Scholar]
- 34.Robertson DS, et al. Survival in the first hours of the Cenozoic. Geol Soc Am Bull. 2004;116:760–768. [Google Scholar]
- 35.Esmeray-Senlet S, et al. Evidence for reduced export productivity following the Cretaceous/Paleogene mass extinction. Paleoceanography. 2015;30:718–738. [Google Scholar]
- 36.Peters E, Thomas DN. Prolonged darkness and diatom mortality I: Marine Antarctic species. J Exp Mar Biol Ecol. 1996;207:24–41. [Google Scholar]
- 37.McQuoid MR, Godhe A, Nordberg K. Viability of phytoplankton resting stages in the sediments of a coastal Swedish fjord. Eur J Phycol. 2002;37:191–201. [Google Scholar]
- 38.McCue MD. Starvation physiology: Reviewing the different strategies animals use to survive a common challenge. Comp Biochem Physiol A Mol Integr Physiol. 2010;156:1–18. doi: 10.1016/j.cbpa.2010.01.002. [DOI] [PubMed] [Google Scholar]
- 39.Warrant E. Vision in the dimmest habitats on Earth. J Comp Physiol A Neuroethol Sens Neural Behav Physiol. 2004;190:765–789. doi: 10.1007/s00359-004-0546-z. [DOI] [PubMed] [Google Scholar]
- 40.Upchurch GR, Jr, et al. Latitudinal temperature gradients and high-latitude temperatures during the latest Cretaceous: Congruence of geologic data and climate models. Geology. 2015;43:683–686. [Google Scholar]
- 41.Boyd PW, et al. Marine phytoplankton temperature versus growth responses from polar to tropical waters—Outcome of a scientific community-wide study. PLoS One. 2013;8:e63091. doi: 10.1371/journal.pone.0063091. [DOI] [PMC free article] [PubMed] [Google Scholar]
- 42.Donaldson MR, et al. Cold shock and fish. J Fish Biol. 2008;73:1491–1530. [Google Scholar]
- 43.Brewer AW. Evidence for a world circulation provided by the measurements of helium and water vapour distribution in the stratosphere. Q J R Meteorol Soc. 1949;75:351–363. [Google Scholar]
- 44.Mills MJ, Toon OB, Turco RP, Kinnison DE, Garcia RR. Massive global ozone loss predicted following regional nuclear conflict. Proc Natl Acad Sci USA. 2008;105:5307–5312. doi: 10.1073/pnas.0710058105. [DOI] [PMC free article] [PubMed] [Google Scholar]
- 45.World Health Organization 2002. Global Solar UV index: A Practical Guide (World Health Org, Geneva), WHO/SDE/OEH.02.2.
- 46.Pierazzo E, et al. Ozone perturbation from medium-size asteroid impacts in the ocean. Earth Planet Sci Lett. 2010;299:263–272. [Google Scholar]
- 47.Solomon S. Stratospheric ozone depletion: A review of concepts and history. Rev Geophys. 1999;37:275–316. [Google Scholar]
- 48.Visscher H, et al. Environmental mutagenesis during the end-Permian ecological crisis. Proc Natl Acad Sci USA. 2004;101:12952–12956. doi: 10.1073/pnas.0404472101. [DOI] [PMC free article] [PubMed] [Google Scholar]
- 49.Murphy B, Mitchell FJG. An association between past levels of ozone column depletion and abnormal pollen morphology in the model angiosperm Arabidopsis thaliana L. Rev Palaeobot Palynol. 2013;194:12–20. [Google Scholar]
- 50.Shakun JD, Carlson AE. A global perspective on Last Glacial Maximum to Holocene climate change. Quat Sci Rev. 2010;29:1801–1816. [Google Scholar]
- 51.Vellekoop J, et al. Rapid short-term cooling following the Chicxulub impact at the Cretaceous-Paleogene boundary. Proc Natl Acad Sci USA. 2014;111:7537–7541. doi: 10.1073/pnas.1319253111. [DOI] [PMC free article] [PubMed] [Google Scholar]
- 52.Kring DA, Durda DD. Trajectories and distribution of material ejected from the Chicxulub impact crater: Implications for postimpact wildfires. J Geophys Res. 2002;107:5062. [Google Scholar]
- 53.Morgan J, Artemieva N, Goldin T. Revisiting wildfires at the K-Pg boundary. J Geophys Res Biogeosci. 2013;118:1508–1520. [Google Scholar]
- 54.Tabor CR, et al. The cause of Late Cretaceous cooling: A multimodel-proxy comparison. Geology. 2016;44:963–966. [Google Scholar]
- 55.Forrister H, et al. Evolution of brown carbon in wildfire plumes. Geophys Res Lett. 2015;42:4623–4630. [Google Scholar]
- 56.Pausata FSR, Lindvall J, Ekman AML, Svensson G. Climate effects of a hypothetical regional nuclear war: Sensitivity to emission duration and particle composition. Earths Future. 2016;4:498–511. [Google Scholar]
- 57.Jacobson MZ. Investigating cloud absorption effects: Global absorption properties of black carbon, tar balls, and soil dust in clouds and aerosols. J Geophys Res. 2012;117:D206205. [Google Scholar]
- 58.Robock A. Volcanic eruptions and climate. Rev Geophys. 2000;38:191–219. [Google Scholar]
- 59.Botet R, Rannou P, Cabane M. Mean-field approximation of Mie scattering by fractal aggregates of identical spheres. Appl Opt. 1997;36:8791–8797. doi: 10.1364/ao.36.008791. [DOI] [PubMed] [Google Scholar]
- 60.Nelson J. Fractality of sooty smoke: Implications for the severity of nuclear winter. Nature. 1989;339:611–613. [Google Scholar]
- 61.Iacono MJ, et al. Impact of an improved longwave radiation model, RRTM, on the energy budget and thermodynamic properties of the NCAR community climate mode, CCM3. J Geophys Res. 2000;105:14873–14890. [Google Scholar]
- 62.Jacobson MZ. A physically-based treatment of elemental carbon optics: Implications for global direct forcing of aerosol. Geophys Res Lett. 2000;27:217–220. [Google Scholar]
- 63.Hedin AE. MSIS-86 thermospheric model. J Geophys Res. 1987;92:4649–4662. [Google Scholar]
- 64.Garcia RR, et al. Simulation of secular trends in the middle atmosphere, 1950–2003. J Geophys Res. 2007;112:D09301. [Google Scholar]
- 65.Madronich S, Flocke S. Theoretical estimation of biologically effective UV radiation at the Earth’s surface. In: Zerefos C, editor. Solar Ultraviolet Radiation—Modeling, Measurements and Effects, NATO ASI Ser. Vol I52. Springer; Berlin: 1997. pp. 23–48. [Google Scholar]


