CELL BIOLOGY Correction for “Dual-specificity phosphatase 5 controls the localized inhibition, propagation, and transforming potential of ERK signaling,” by Andrew M. Kidger, Linda K. Rushworth, Julia Stellzig, Jane Davidson, Christopher J. Bryant, Cassidy Bayley, Edward Caddye, Tim Rogers, Stephen M. Keyse, and Christopher J. Caunt, which was first published January 4, 2017; 10.1073/pnas.1614684114 (Proc Natl Acad Sci USA 114:E317–E326).
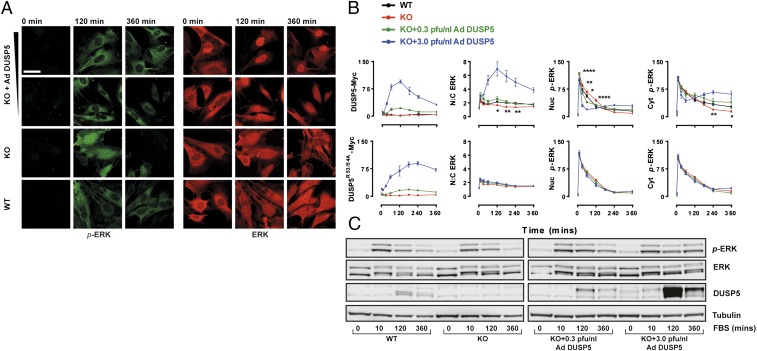
The authors wish to note the following: “Since the publication of our paper, we have become aware that the quantitative data presented in Fig. 1B do not represent the full raw data set provided in the supporting information deposited online at https://doi.org/10.15125/BATH-00317. We are therefore publishing a corrected version of Fig. 1 in which the graphs in panel B have been replaced by those generated from the complete online dataset. The result and the conclusions drawn are unchanged. A minor correction has also been made to the figure legend to reflect the altered P values that result from use of the complete dataset.” The corrected Fig. 1 and its corrected legend appear below.
Fig. 1.
DUSP5 propagates cytoplasmic ERK signaling. Serum-starved primary MEFs from WT or Dusp5 KO mice were infected with either 0.3–3.0 pfu/nL Ad ERK-responsive EGR1 promoter-driven DUSP5-Myc (DUSP5) or a KIM mutant of DUSP5-Myc (DUSP5R53/54A) and stimulated with 20% (vol/vol) FBS for times indicated. (A) Representative confocal images of p-ERK and ERK are shown. (Scale bar: 60 μm.) (B) HCM was used to quantify >104 cells per condition per experiment for levels of Myc tag, nuclear (Nuc), or cytoplasmic (Cyt) p-ERK intensity, or N:C of total ERK fluorescence. Data are normalized mean arbitrary fluorescence unit (AFU) values ± SEM, n = 4–8, *P < 0.05, **P < 0.01, ****P < 0.0001 comparing WT vs. KO using two-way repeated-measures ANOVA and Bonferroni posttest. Note: KO data are identical in Upper and Lower plots. (C) Western blots of whole-cell lysates are shown for total ERK, p-ERK, β-tubulin, and DUSP5. A representative blot is shown from n = 3 similar experiments; blot quantification is shown in Fig. S1C.


