Abstract
Objective:
The aim of this study was to investigate the predictability of bone density at posterior mandibular implant sites using cone-beam computed tomography (CBCT) intensity values.
Materials and Methods:
CBCT cross-sectional images for 436 posterior mandibular implant sites were selected for the study. Using Invivo software (Anatomage, San Jose, California, USA), two observers classified the bone density into three categories: low, intermediate, and high, and CBCT intensity values were generated.
Results:
Based on the consensus of the two observers, 15.6% of sites were of low bone density, 47.9% were of intermediate density, and 36.5% were of high density. Receiver-operating characteristic analysis showed that CBCT intensity values had a high predictive power for predicting high density sites (area under the curve [AUC] =0.94, P < 0.005) and intermediate density sites (AUC = 0.81, P < 0.005). The best cut-off value for intensity to predict intermediate density sites was 218 (sensitivity = 0.77 and specificity = 0.76) and the best cut-off value for intensity to predict high density sites was 403 (sensitivity = 0.93 and specificity = 0.77).
Conclusions:
CBCT intensity values are considered useful for predicting bone density at posterior mandibular implant sites.
Keywords: Bone density, cone-beam computed tomography, dental implants, predictability
INTRODUCTION
Since the introduction of osseointegration field by Branemark 1987, Restoring missing teeth with dental implants has become a predictable treatment option,[1] by which function and esthetics can be restored successfully. From a clinical point of view, successful osseointegration is reflected by implant stability, which can be divided into primary and secondary stability. Primary stability is associated with the mechanical engagement of an implant with the surrounding bone by which micromotion is reduced, allowing for the biological process of osseointegration of regeneration and remodeling to achieve the secondary (biological) stability.[2]
Several factors have been found to affect the primary stability of endosseous implants which can be classified into patient-related (like bone quality and quantity) and non-patient related factors (like implant design and surgical procedure). Regarding patient-related factors, available bone quality and quantity are considered prerequisite for successful and predictable implant treatment.[3] While the available bone quantity is reflected by the dimensions of alveolar bone that will house the fixture part of the implant, bone quality has been described by the relative amount of cancellous and cortical portions and the density of the recipient site of the alveolar bone.
In addition to the positive association between bone density and implant stability,[4,5,6,7] bone density can affect implant healing time and can modify the surgical technique.[8] Moreover, bone density evaluation in the periapical area of teeth has its importance in endodontics,[9] and bone density evaluation at specific areas like the palate, can be helpful in locating placement sites for mini implants and orthodontic skeletal anchorage devices.[10]
For objective assessment of bone density at implant sites, both computed tomography (CT) and cone-beam CT (CBCT) can be used, and good correlation was shown between CT numbers (Hounsfield unit [HU]) and CBCT gray values.[11] Unlike CT, many factors can affect CBCT grey or intensity values like type of scanner, field of view, position, and scanning parameters.[12] Calibration is needed to generate CBCT intensity values similar to CT HUs.[13]
On the other hand, several classifications have been proposed for subjective bone density assessment.[14,15,16,17] In the recent study done by Rebaudi et al.,[17] a novel method of classifying bone density in CT/micro-CT into hard, normal and soft was proposed and suggested to be used in combination with objective bone density analysis. Even in case of CBCT, objective assessment of the bone density should be added to subjective assessment due to limitations in subjective assessment.[18,19,20]
Similar to the example of Rebaudi et al.,[17] we classified bone density at implant sites into low, intermediate, and high in the current study. To the best of our knowledge, no study has investigated the predictability of these three categories of bone density using CBCT intensity values, thus validating the conduction of this study.
MATERIALS AND METHODS
Patients
In our retrospective study, images for all patients who underwent CBCT examination for dental implant treatment and other dental purposes at our dental radiology clinic were retrieved and evaluated between January 2011 and January 2016. Only cases with missing lower posterior teeth were included in the study. The number of cases included were 436 (160 premolars and 276 molars), from 210 patients (85 males and 125 females) with a mean patient age of 46 years. Cases with artifacts or pathology affecting bone density at implant sites were excluded from the study. In addition, we excluded cases in which we were not able to simulate placement of 4 mm × 10 mm dental implant. This study was approved by our institutional research board (no. 382/2016).
Cone-beam computed tomography examination
As a CBCT apparatus, KODAK 9500 Cone Beam 3D System (Carestream, Rochester, NY, USA) with flat panel detector was used. The imaging area of CBCT is a cylinder with a height of 15–20.6 cm and a diameter of 9–18 cm providing isotropic cubic voxels with sides approximating 0.2–0.3 mm. Only cases examined with 0.2 mm were included in the study. The exposure parameters were: 90 kV as a tube voltage, 10 mA as a tube current, and 10.8 s as an exposure time.
Examinations were performed by 360° rotation in the occlusal position with the patient standing and closing their teeth.
Images
One calibrated oral radiologist (MA) with 9 years of experience with CBCT and dental implants was responsible for determining the implant sites, subjectively classifying the bone density on cross-sectional images at proposed implant sites into: Low, intermediate, and high, generating CBCT intensity values based on this classification, then saving the images for a second evaluation after 1 month, and third evaluation by one calibrated oral implantologist (MH) with 9 years of experience on a separate occasion. When the two observers disagreed about bone density evaluation, they evaluated the images again, and a consensus was then reached by discussion.
For the subjective evaluation of bone density at the implant sites, the trabecular bone was considered low density if marrow spaces are filling most of the site, intermediate density if bone trabeculae are filling half of the site and high density if bone trabeculae are filling most of the site [Figures 1–3].
Figure 1.
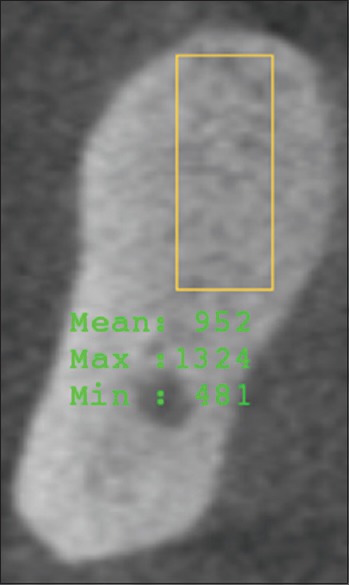
Cone-beam computed tomography section showing high dense trabecular bone at mandibular molar implant site
Figure 3.
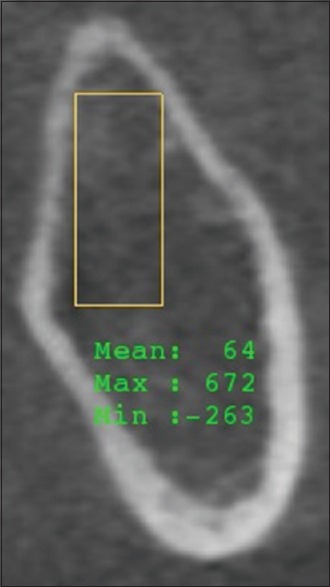
Cone-beam computed tomography section showing low dense trabecular bone at mandibular molar implant site
Figure 2.
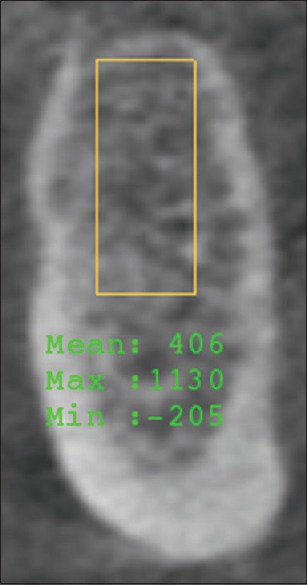
Cone-beam computed tomography section showing intermediate dense trabecular bone at mandibular premolar implant site
Using InVivo software (Anatomage, San Jose, California, USA), arch section module was utilized for determining the implant sites, simulating implant placement and generating CBCT intensity values. For simulating implant placement; the distance measurement tool was used for drawing a 4 mm × 10 mm rectangle at the implant sites, then HU measurement tool was used to generate intensity values for the simulated implants. HU measurement tool showed 3 intensity values at each implant site (minimum, mean and maximum). However, we only considered the mean intensity value for analysis.
All images were evaluated on high definition liquid crystal display with installed Invivo software, and window settings were fixed for all cases.
Statistical analysis
Analysis of data was achieved through the Statistical Package for Social Sciences software (version 15; SPSS Inc., Chicago, IL, USA). Means and standard deviations (SDs) as well as percentages were used to describe data. The difference in intensity values between the low, intermediate, and high-density sites was analyzed using one-way ANOVA. Overall percent agreement and Kappa statistics were used to determine the measure of agreements in the subjective evaluation of bone density between the two observers. Receiver-operating characteristic (ROC) curve analyses were used to examine the overall predictive power, sensitivity and specificity, and corresponding cutoff points of CBCT intensity values. The overall performance of CBCT intensity values for predicting bone density was assessed by computing the area under the curve (AUC). The best cutoff points for CBCT intensity values were determined at the point on the curve where the sum of sensitivity and specificity was highest. A value of P < 0.05 was considered statistically significant.
RESULTS
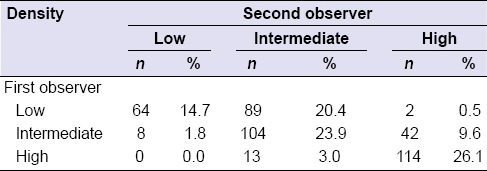
The overall percent of agreement in subjective classification of bone density for the first observer over the two repeated occasions of evaluations was 66.5% [Table 1] with a moderate agreement between the two repeated evaluations (Kappa statistics = 0.50; P < 0.005). The overall percent of agreement between the two observers was 64.7% [Table 2] with a moderate agreement between the two observers (Kappa statistics = 0.47; P < 0.005).
Table 1.
The overall agreement for the first observer between the two repeated occasions of measurements
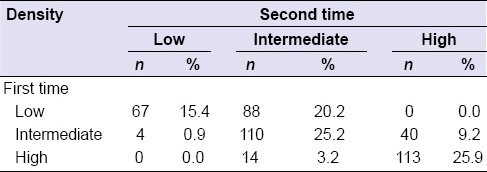
Table 2.
The overall agreement between the two observers
Based on the consensus of the two observers, 15.6% of sites were of low bone density, 47.9% were of intermediate density, and 36.5% were of high density. The means (SD) of intensity values were 172 (99.3) for those with low density, 307 (123.1) for intermediate density, and 645 (192.3) for high density (P < 0.05).
ROC analysis showed that CBCT intensity values had a high predictive power for predicting high density sites (AUC = 0.94, P < 0.005, Figure 4) and intermediate density sites (AUC = 0.81, P < 0.005, Figure 5). The best cutoff value for intensity to predict intermediate density sites was 218 (sensitivity = 0.77 and specificity = 0.76) and the best cutoff value for intensity to predict high density sites was 403 (sensitivity = 0.93 and specificity = 0.77).
Figure 4.
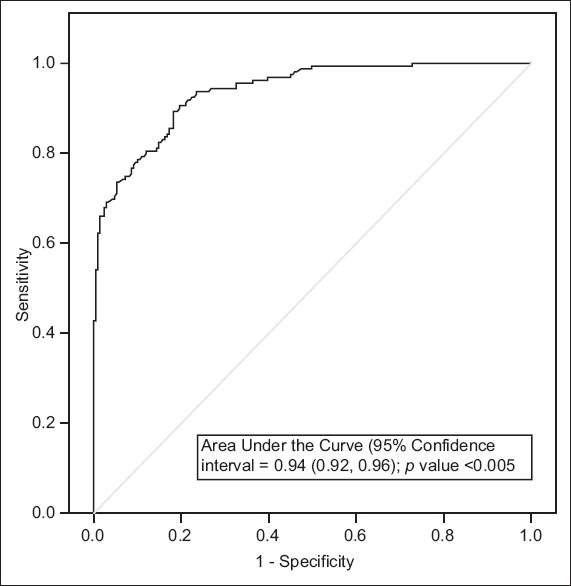
Receiver-operating characteristic curve for predicting high density implant sites
Figure 5.
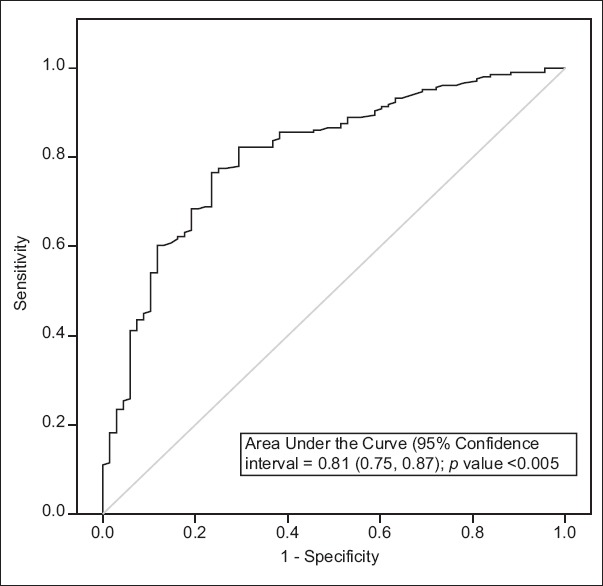
Receiver-operating characteristic curve for predicting intermediate density implant sites
DISCUSSION
The assessment of bone density at potential dental implant sites is considered of paramount significance presurgically since it affects locating the best implant site, implant site preparation technique, implant positions, and the success rate of the implants.[17,21,22,23] Therefore, several studies have been conducted for this task,[4,5,6,7,8,17,18,19,20] and different results were revealed due to use of various scanners, softwares, and methods.
Among imaging modalities used for bone density assessment, CBCT has advantages over conventional CT due to high image resolution and low radiation dose,[24] and an advantage over micro-CT, since it is being used clinically and not only for in vitro experiments. Moreover, CBCT showed comparable results to micro-CT in assessing grey level distribution in human mandible.[25]
In this study, we evaluated bone density at posterior mandibular implant sites. Around half of the sites had intermediate density, and the remaining half had both of low and high-density type of bone. This shows the importance of site-specific evaluation as recommended in previous studies.[17,20,22,26]
The inclusion of only posterior mandibular implant sites allowed us to simulate placement of one of commonly used implant sizes for all cases, and to evaluate the density of crestal 10 mm of trabecular bone, which is the most important area for osseointegration.[27] In addition, the alveolar ridge of posterior mandibular implant sites is vertically oriented, which enabled us to simulate placement of vertically oriented implants and to overcome the limitation of the software being used, in which it cannot simulate placement of tilted implants.
For the subjective assessment of bone density in the current study, the intra- and inter-observer agreement were moderate; this reveals the difficulty in subjective assessment, especially when the bone has low to intermediate or intermediate to high density. The difficulty in subjective assessment of bone density was also present in few previous studies,[8,26,28,29] which could partially be due to dependence of subjective assessment on observer experience.
To overcome the limitations and difficulties in subjective visual assessment of bone density, the use of an objective scale like the one suggested by Norton and Gamble,[28] or Trisi and Rao[29] is useful and would be more accurate. However, this cannot be applied to CBCT. Similarly, we investigated the usefulness of CBCT intensity values in predicting bone density, and the values had high power in prediction of different types of bone density.
In the previous study by de Oliveira et al.,[26] they used the subjective classification of bone density suggested by Lekholm and Zarb,[15] and they divided the bone into four types. Despite this, they had only three categories of HU; below 200 for Type 4, between 200 and 400 for Type 2 and 3, and more than 400 for denser bone (Type 1). Again, similarly to Norton and Gamble[28] and Trisi and Rao,[29] they had difficulty in the subjective differentiation, specifically between Type 2 and 3 of bone. Therefore, our classification of bone density into low, moderate, and high, would be easier and more flexible to apply than classifying the bone into four types. Interestingly, our results are in agreement with de Oliveira et al.,[26] since our cutoff intensity values were 403 and 218 for high and intermediate dense bone, respectively. This might be due to the exclusion of cortical bone from density assessment. Nevertheless, this shows the usefulness and ability of CBCT to generate intensity values comparable with CT numbers.
In the present study, a difference of about 200 of CBCT intensity value was required to differentiate between one type of bone density and the consecutive type. This difference is close to what reported by Lee et al.,[30] as they reported a difference of 180 of HU.
In contrast to other previous studies,[18,20,21,26,28] we simulate placement of implants in the crestal 10 mm of the trabecular bone, without including the cortical bone. The inclusion of cortical bone will increase the mean intensity value and is one cause for the different results. Needless to say, the shape and/or size of region of interest, and the section being used for evaluation are other causes for different results.
Our study has some limitations which require mentioning. We used third party software for CBCT intensity values calculation; this affected the quality of the imported images and resulted in difficulty in subjective image evaluation. Moreover, we simulated placement of a specific size of implants, which may not necessarily represent a true clinical situation and other factors may affect the treatment plan. Finally, our results cannot be generalized unless same CBCT machine and same protocol is followed for obtaining CBCT intensity values.
CONCLUSION
In conclusion, CBCT intensity values can be used for predicting bone density at posterior mandibular implant sites.
Financial support and sponsorship
Nil.
Conflicts of interest
There are no conflicts of interest.
Acknowledgment
We are thankful for the Deanship of Scientific Research in Jordan University of Science and Technology for their approval and support in conducting the research.
REFERENCES
- 1.Hanif A, Qureshi S, Sheikh Z, Rashid H. Complications in implant dentistry. Eur J Dent. 2017;11:135–40. doi: 10.4103/ejd.ejd_340_16. [DOI] [PMC free article] [PubMed] [Google Scholar]
- 2.Swami V, Vijayaraghavan V, Swami V. Current trends to measure implant stability. J Indian Prosthodont Soc. 2016;16:124–30. doi: 10.4103/0972-4052.176539. [DOI] [PMC free article] [PubMed] [Google Scholar]
- 3.Lekholm U. Osseointegrated implants in clinical practice. J Oral Implantol. 1986;12:357–64. [PubMed] [Google Scholar]
- 4.Farré-Pagés N, Augé-Castro ML, Alaejos-Algarra F, Mareque-Bueno J, Ferrés-Padró E, Hernández-Alfaro F. Relation between bone density and primary implant stability. Med Oral Patol Oral Cir Bucal. 2011;16:e62–7. doi: 10.4317/medoral.16.e62. [DOI] [PubMed] [Google Scholar]
- 5.Turkyilmaz I, Tumer C, Ozbek EN, Tözüm TF. Relations between the bone density values from computerized tomography, and implant stability parameters: A clinical study of 230 regular platform implants. J Clin Periodontol. 2007;34:716–22. doi: 10.1111/j.1600-051X.2007.01112.x. [DOI] [PubMed] [Google Scholar]
- 6.Salimov F, Tatli U, Kürkçü M, Akoglan M, Oztunç H, Kurtoglu C. Evaluation of relationship between preoperative bone density values derived from cone beam computed tomography and implant stability parameters: A clinical study. Clin Oral Implants Res. 2014;25:1016–21. doi: 10.1111/clr.12219. [DOI] [PubMed] [Google Scholar]
- 7.Isoda K, Ayukawa Y, Tsukiyama Y, Sogo M, Matsushita Y, Koyano K. Relationship between the bone density estimated by cone-beam computed tomography and the primary stability of dental implants. Clin Oral Implants Res. 2012;23:832–6. doi: 10.1111/j.1600-0501.2011.02203.x. [DOI] [PubMed] [Google Scholar]
- 8.Shapurian T, Damoulis PD, Reiser GM, Griffin TJ, Rand WM. Quantitative evaluation of bone density using the Hounsfield index. Int J Oral Maxillofac Implants. 2006;21:290–7. [PubMed] [Google Scholar]
- 9.Kaya S, Yavuz I, Uysal I, Akkus Z. Measuring bone density in healing periapical lesions by using cone beam computed tomography: A clinical investigation. J Endod. 2012;38:28–31. doi: 10.1016/j.joen.2011.09.032. [DOI] [PubMed] [Google Scholar]
- 10.Han S, Bayome M, Lee J, Lee YJ, Song HH, Kook YA. Evaluation of palatal bone density in adults and adolescents for application of skeletal anchorage devices. Angle Orthod. 2012;82:625–31. doi: 10.2319/071311-445.1. [DOI] [PMC free article] [PubMed] [Google Scholar]
- 11.Razi T, Niknami M, Alavi Ghazani F. Relationship between Hounsfield Unit in CT Scan and Gray Scale in CBCT. J Dent Res Dent Clin Dent Prospects. 2014;8:107–10. doi: 10.5681/joddd.2014.019. [DOI] [PMC free article] [PubMed] [Google Scholar]
- 12.Nackaerts O, Maes F, Yan H, Couto Souza P, Pauwels R, Jacobs R. Analysis of intensity variability in multislice and cone beam computed tomography. Clin Oral Implants Res. 2011;22:873–9. doi: 10.1111/j.1600-0501.2010.02076.x. [DOI] [PubMed] [Google Scholar]
- 13.Liu Y, Bäuerle T, Pan L, Dimitrakopoulou-Strauss A, Strauss LG, Heiss C, et al. Calibration of cone beam CT using relative attenuation ratio for quantitative assessment of bone density: A small animal study. Int J Comput Assist Radiol Surg. 2013;8:733–9. doi: 10.1007/s11548-012-0803-5. [DOI] [PubMed] [Google Scholar]
- 14.Sedlin ED, Hirsch C. Factors affecting the determination of the physical properties of femoral cortical bone. Acta Orthop Scand. 1966;37:29–48. doi: 10.3109/17453676608989401. [DOI] [PubMed] [Google Scholar]
- 15.Lekholm U, Zarb GA. Patient selection and preparation. In: Branemark P, editor. Tissue-Integrated Prosthese. Osseointegration in Clinical Dentistry. 1st ed. Chicago: Quintessence; 1985. pp. 199–209. [Google Scholar]
- 16.Misch CE. Density of bone: Effect on treatment plans, surgical approach, healing, and progressive boen loading. Int J Oral Implantol. 1990;6:23–31. [PubMed] [Google Scholar]
- 17.Rebaudi A, Trisi P, Cella R, Cecchini G. Preoperative evaluation of bone quality and bone density using a novel CT/microCT-based hard-normal-soft classification system. Int J Oral Maxillofac Implants. 2010;25:75–85. [PubMed] [Google Scholar]
- 18.Aranyarachkul P, Caruso J, Gantes B, Schulz E, Riggs M, Dus I, et al. Bone density assessments of dental implant sites: 2. Quantitative cone-beam computerized tomography. Int J Oral Maxillofac Implants. 2005;20:416–24. [PubMed] [Google Scholar]
- 19.Fuster-Torres MÁ, Peñarrocha-Diago M, Peñarrocha-Oltra D, Peñarrocha-Diago M. Relationships between bone density values from cone beam computed tomography, maximum insertion torque, and resonance frequency analysis at implant placement: A pilot study. Int J Oral Maxillofac Implants. 2011;26:1051–6. [PubMed] [Google Scholar]
- 20.Hao Y, Zhao W, Wang Y, Yu J, Zou D. Assessments of jaw bone density at implant sites using 3D cone-beam computed tomography. Eur Rev Med Pharmacol Sci. 2014;18:1398–403. [PubMed] [Google Scholar]
- 21.Turkyilmaz I, Ozan O, Yilmaz B, Ersoy AE. Determination of bone quality of 372 implant recipient sites using Hounsfield unit from computerized tomography: A clinical study. Clin Implant Dent Relat Res. 2008;10:238–44. doi: 10.1111/j.1708-8208.2008.00085.x. [DOI] [PubMed] [Google Scholar]
- 22.Jaffin RA, Berman CL. The excessive loss of Branemark fixtures in type IV bone: A 5-year analysis. J Periodontol. 1991;62:2–4. doi: 10.1902/jop.1991.62.1.2. [DOI] [PubMed] [Google Scholar]
- 23.Jemt T, Lekholm U. Implant treatment in edentulous maxillae: A 5-year follow-up report on patients with different degrees of jaw resorption. Int J Oral Maxillofac Implants. 1995;10:303–11. [PubMed] [Google Scholar]
- 24.Karatas OH, Toy E. Three-dimensional imaging techniques: A literature review. Eur J Dent. 2014;8:132–40. doi: 10.4103/1305-7456.126269. [DOI] [PMC free article] [PubMed] [Google Scholar]
- 25.Taylor TT, Gans SI, Jones EM, Firestone AR, Johnston WM, Kim DG. Comparison of micro-CT and cone beam CT-based assessments for relative difference of grey level distribution in a human mandible. Dentomaxillofac Radiol. 2013;42:25117764. doi: 10.1259/dmfr/25117764. [DOI] [PMC free article] [PubMed] [Google Scholar]
- 26.de Oliveira RC, Leles CR, Normanha LM, Lindh C, Ribeiro-Rotta RF. Assessments of trabecular bone density at implant sites on CT images. Oral Surg Oral Med Oral Pathol Oral Radiol Endod. 2008;105:231–8. doi: 10.1016/j.tripleo.2007.08.007. [DOI] [PubMed] [Google Scholar]
- 27.Misch CE. Contemporary Implant Dentistry. 3rd ed. St. Louis: Mosby Elsevier; 2007. [Google Scholar]
- 28.Norton MR, Gamble C. Bone classification: An objective scale of bone density using the computerized tomography scan. Clin Oral Implants Res. 2001;12:79–84. doi: 10.1034/j.1600-0501.2001.012001079.x. [DOI] [PubMed] [Google Scholar]
- 29.Trisi P, Rao W. Bone classification: Clinical-histomorphometric comparison. Clin Oral Implants Res. 1999;10:1–7. doi: 10.1034/j.1600-0501.1999.100101.x. [DOI] [PubMed] [Google Scholar]
- 30.Lee S, Gantes B, Riggs M, Crigger M. Bone density assessments of dental implant sites: 3. Bone quality evaluation during osteotomy and implant placement. Int J Oral Maxillofac Implants. 2007;22:208–12. [PubMed] [Google Scholar]


