Abstract
Objectives:
This study aimed to assess the effect of head position on the accuracy of transverse measurements of the maxillofacial region on CBCT and conventional posteroanterior (PA) cephalograms. The second objective of this study was to find skull positions with the greatest and smallest effect on transverse measurements in the maxillofacial region.
Methods:
PA cephalograms and CBCT scans were obtained from 10 dry human skulls in 7 positions, namely the central position, 10° and 20° rotations, 10° and 20° tilts and 10° and 20° tips. The CBCT scans were converted to PA cephalograms on which distances from six landmarks, namely the nasal cavity, zygomatic arch, jugale, antegonion, condylion and zygomaticofrontal suture to the mid-sagittal plane, were measured on both sides using Dolphin two-dimensional software. The paired t-test was used to compare the mean values separately in each position (for each landmark) with the gold standard (central skull position). The interclass correlation coefficient and the Bland–Altman plot were used to compare the mean values measured by two observers.
Results:
The mean values of the distances measured on CBCT PA cephalograms were greater than those measured on conventional PA cephalograms; this difference was statistically significant for some landmarks (p < 0.005). The rotated position (as compared with the central position) caused the greatest change in values for most landmarks on both sides (p < 0.005).
Conclusions:
The CBCT PA cephalogram was more accurate than the conventional PA cephalogram, and landmarks farther from the midline exhibited greater changes on cephalograms compared with those closer to the midline. Patients are at risk of improper positioning when undergoing extraoral radiography such as PA cephalograms. Changes in head position may affect the transverse measurements and thus the treatment plan.
Keywords: cephalometry, CBCT
Introduction
Success of orthodontic treatment highly depends upon the ability of the clinician to comprehend the relationship of dental structures, soft tissues and bone. Lateral and frontal cephalometric radiographs have been used for maxillofacial analyses, evaluation of orthodontic deformities and monitoring growth and development since the early 1930s.1,2 Nowadays, cephalograms are routinely requested by clinicians for accurate diagnosis and treatment planning.3 Although posteroanterior (PA) cephalometry is not commonly requested by many orthodontists, it provides valuable information for quantitative and qualitative analyses of the craniofacial region especially for the diagnosis of transverse discrepancies and asymmetries. Also, PA cephalometry is used for the diagnosis of craniofacial anomalies and dentoskeletal asymmetries and for determining the pattern of transverse growth of the maxilla and mandible.3,4 The limitations and shortcomings of this modality include image superimposition, image distortion and difficulty in identification of landmarks.5,6 Other problems include difficult standardization and reproducibility of head repositioning and maintaining a fixed distance between the film and the object.7–9
CT was introduced in 1972 and quickly gained popularity for orthodontic diagnosis and treatment planning.10,11 However, conventional CT has shortcomings such as high cost and relatively high patient radiation dose.10 CBCT was introduced for dentistry in 1988, and it is currently an ideal imaging modality for many dental applications.12 This modality has superiority over conventional CT mainly owing to having a lower patient radiation dose, lower cost and higher spatial resolution. CBCT also enables reconstruction of two-dimensional (2D) views from three-dimensional (3D) images for conventional cephalometric analysis.12 The ray sum technique is used to convert CBCT scans to 2D PA cephalograms.12 Cephalograms obtained from CBCT scans by the use of the ray sum technique do not have the distortion of conventional cephalograms. However, the use of 2D cephalograms obtained from CBCT scans as an alternative to conventional cephalograms has yet to be established.
According to the 2007 recommendations of the International Commission on Radiological Protection Publication 103 for calculation of effective dose, the three routinely used radiographic modalities in orthodontics include lateral cephalometry, PA cephalometry and panoramic radiography with a collective effective dose of 25–35 µSv, whereas the effective dose of CBCT with a large field of view used for orthodontic diagnosis ranges from 68 µSv to 1073 µSv, which is several times higher than the total dose of lateral cephalometry, PA cephalometry and panoramic radiography.12 Diagnostic information obtained from CBCT improves the outcome of treatment, shortens the course of recovery and decreases the treatment cost; thus, these advantages may compensate for the higher patient radiation dose. However, despite these advantages, this technique is not recommended. Taking patient radiation dose into account, conventional PA cephalometry is preferred to CBCT. CBCT is an ideal modality for complex cases requiring a thorough evaluation of the temporomandibular joint or other 3D structures prior to surgery because it provides more information than cephalometry and significantly enhances diagnosis and treatment planning, which may justify its use despite higher radiation dose.13
In most extraoral radiographies such as lateral and PA cephalometric radiographs, patients are at risk of improper positioning. CBCT scans are less commonly affected by improper patient positioning; however, during the process of image acquisition, maintaining a fixed position of the skull is necessary.7 Previous studies showed that rotation of the head significantly affects the accuracy of transverse measurements in the maxillofacial region, while tilting the head has no effect on the accuracy of transverse measurements in this region.14,15 To the best of the authors' knowledge, no previous study has evaluated the effect of tilting, rotation or tipping of the skull on the accuracy of transverse analysis of the maxillofacial region on CBCT and PA cephalograms. Thus, this study aimed to assess the effect of head position on the accuracy of landmark detection and transverse analysis of the maxillofacial region. The second objective was to find skull positions with the greatest and smallest effects on the accuracy of transverse analysis. The effects of head position on the accuracy of transverse measurements made on CBCT and PA cephalograms were also assessed.
Methods and materials
This study was conducted on dry human skulls. The study protocol was approved by the Medical Ethics Committee of the Hamadan University of Medical Sciences (ethical approval code: Res:project:9303191154). 10 dry skulls without asymmetry, fracture or pathologic lesions were selected for this study. The condyles were placed in the glenoid fossae in order to fix the mandible to the maxilla during image acquisition; Sticky wax (Kerr, Orange, CA) was melted at 73 °C (163 °F);16,17 1–5 mm of sticky wax was placed between the maxillary and mandibular teeth and 5–10 mm of sticky wax was placed between the maxillary and mandibular ridges in edentulous areas.
Positions
Skulls were adjusted in the central and six other positions, namely 10° rotation, 20° rotation, 20° tilt, 10° tilt, 20° tip and 10° tip, and conventional PA and CBCT PA cephalograms were obtained. Owing to differences in anatomical dimensions of the right and left sides of each skull, tilts and rotations of the skulls were applied to one side only.
Central position
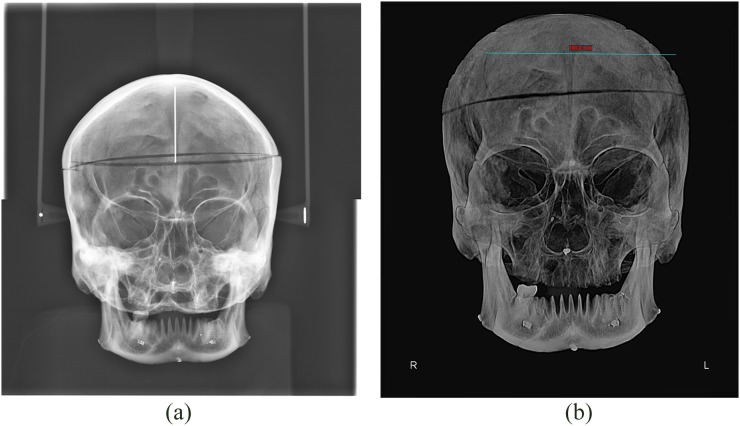
The skulls were placed in the standard position. Figure 1 shows the conventional PA cephalograms and the CBCT PA cephalograms of the skulls in central position.
Figure 1.
Taking conventional posteroanterior (PA) cephalograms (a) and CBCT PA cephalograms (b) of the skulls in the central position.
Tilted position
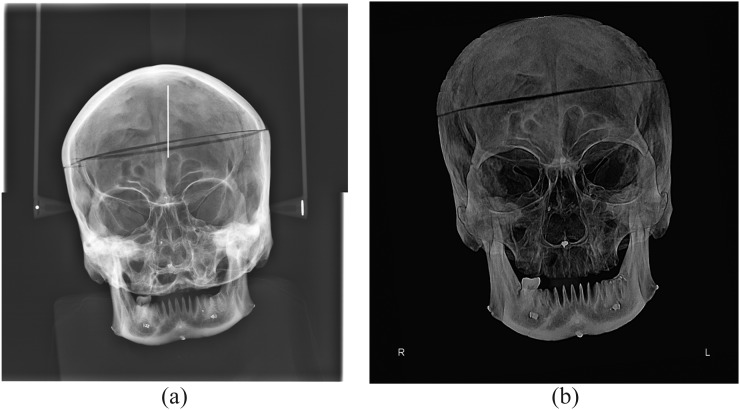
The mid-sagittal plane of the skulls was tilted to the right side. Figure 2 shows the conventional PA cephalograms and the CBCT PA cephalograms of the skulls tilted towards the right by 20°.
Figure 2.
Taking conventional posteroanterior (PA) cephalograms (right) and CBCT PA cephalograms (left) of the skulls tilted towards the right side by 20°.
Rotated position
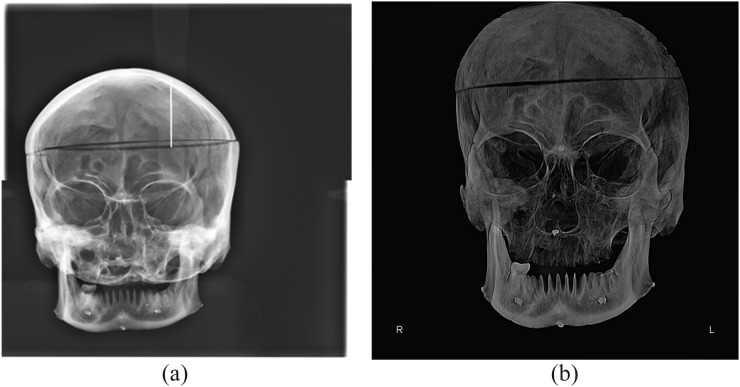
The skulls were rotated to the right side. Figure 3 shows the conventional PA cephalograms and the CBCT PA cephalograms of the skulls rotated to the right side by 20°.
Figure 3.
Taking conventional posteroanterior (PA) cephalograms (a) and CBCT PA cephalograms (b) of the skulls rotated to the right side by 20°.
Tipped position
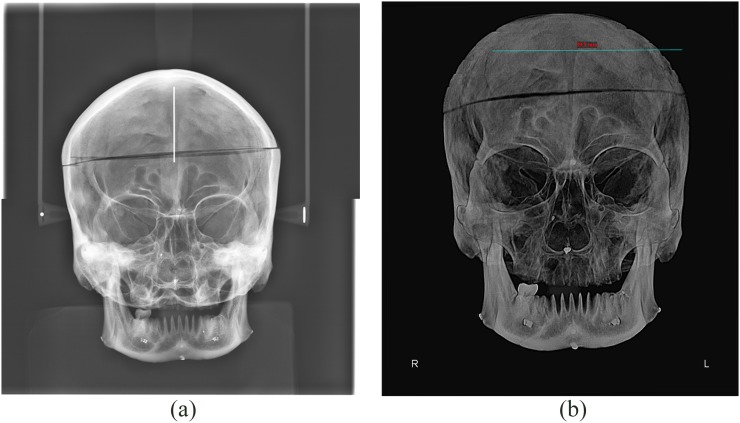
The skulls were tipped downwards. Figure 4 shows the conventional PA cephalograms and the CBCT PA cephalograms of the skulls tipped downwards by 20°.
Figure 4.
Taking conventional posteroanterior (PA) cephalograms (a) and CBCT PA cephalograms (b) of the skulls tipped downwards by 20°.
Conventional posteroanterior cephalometry protocol
Conventional PA cephalograms were obtained by a Scara II Planmeca X-ray unit (Planmeca, Helsinki, Finland) with exposure settings of 68 kVp, 10 mA and 15.3 s. Each skull was placed on a styrofoam sheet, and the mandible was outlined on the sheet. The outlined area was cut out of the sheet and the mandible was placed in the created space. Mandibles were positioned in styrofoam sheets such that the Frankfurt plane of the skull was parallel to the horizon.
A wooden apparatus was designed and fabricated for positioning of the skulls for conventional PA cephalometry with a height of 120 cm. Two wooden sheets were placed on the upper part of the apparatus, and the inferior wooden sheet had a screw by which the position (angulation) of the skull could be adjusted. Next, each skull along with the respective styrofoam sheet was placed on the wooden apparatus.
In conventional PA cephalometry, a cephalostat was used to fix the position of the skull relative to the detector and X-ray tube. Using a cephalostat, the distance between the mid-sagittal plane of the skull and detector and also the distance between the mid-sagittal plane and X-ray tube remained constant. It also enabled reproducibility of PA cephalometry in correct position.14
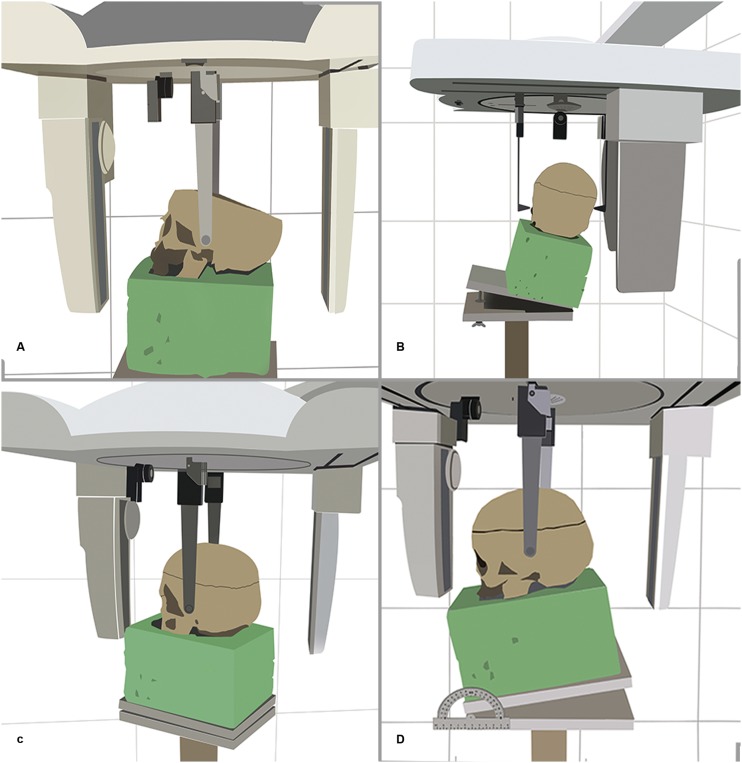
On conventional PA cephalogram in central position, each skull was adjusted in standard position (Figure 5a) such that the petrous ridge of the temporal bone was superimposed on the maxillary sinus floor (Figure 1).
Figure 5.
Taking conventional posteroanterior cephalograms of the skulls in central position (a), tilted position (b), rotated position (c) and tipped position (d).
In order to position the skulls in 10° and 20° tilted position, the skulls were first adjusted in central position and PA cephalograms were taken. After confirming central position of the skull, 10° and 20° angles were created between the two superior sheets of the wooden apparatus, and the skull was tilted to the right side by 10° and 20°, respectively (Figure 5b).
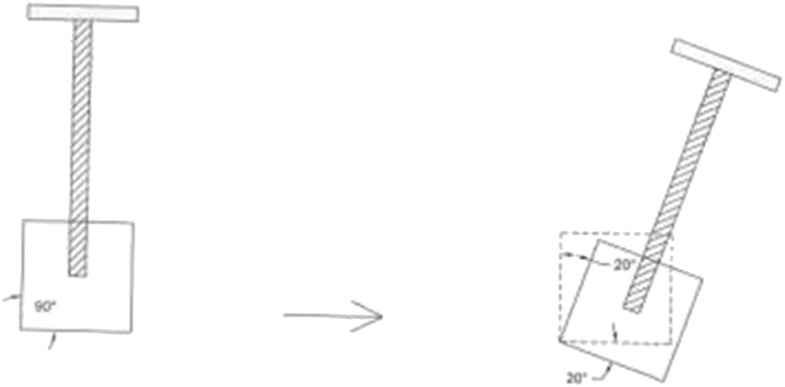
For the rotation position, the skulls were first placed in central position and PA cephalograms were obtained from them. After confirming central position of the skull, the wooden apparatus was rotated 10° and 20° to the right and a PA cephalogram was obtained in this position (Figures 5c and 6). As shown in Figure 6, the wooden apparatus was rotated 20° to the right (90° from its baseline). The skull (previously in central position) was also rotated along with the apparatus to the right and the PA cephalogram was taken.
Figure 6.
A schematic view of the rotation of the wooden apparatus by 20° relative to the central position for taking conventional posteroanterior cephalograms in the 20° rotated position.
For the tipping position, after confirming the central position of the skull, 10° and 20° angles were created between the two superior sheets of the wooden apparatus and the skull was tipped downwards (Figure 5d).
The CBCT protocol
The CBCT scans were obtained by a NewTom 3G volume scanner (QR SRL, Verona, Italy) with exposure settings of 110 kVp, 2.8 mA, 3.6 s and 12-inch field of view. The scans were processed using NNT Viewer software (QR SRL, Verona, Italy). The skulls were placed in central and six other positions mentioned earlier.
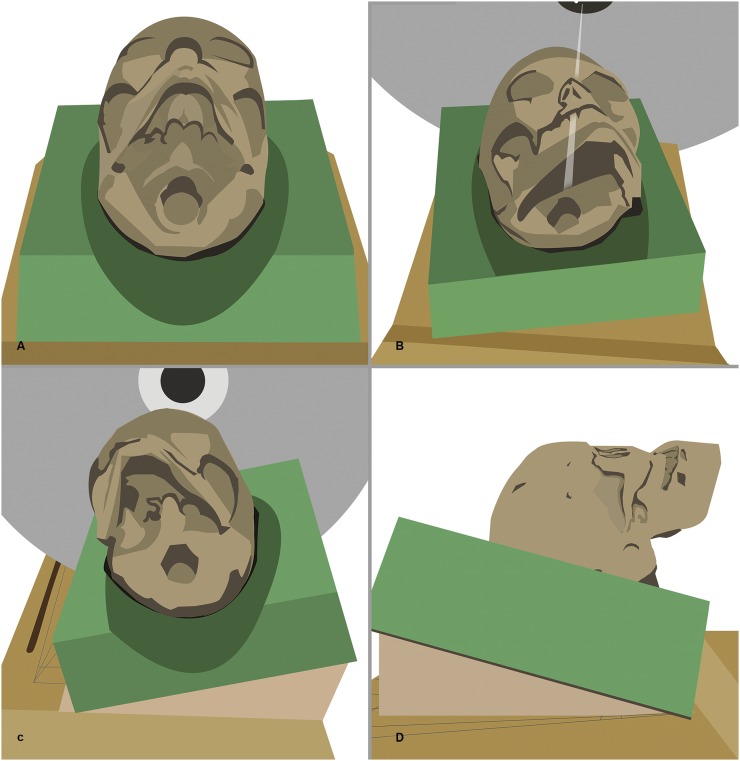
In order to obtain CBCT scans, the position of the skulls had to be fixed. For this purpose, each skull was placed on a styrofoam sheet and outlined. The outlined area was cut out of the styrofoam sheet. Each skull was placed in its respective styrofoam sheet for scanning (Figure 7).
Figure 7.
Taking CBCT scans of the skulls in central position (a), tilted position (b), rotated position (c) and tipped position (d).
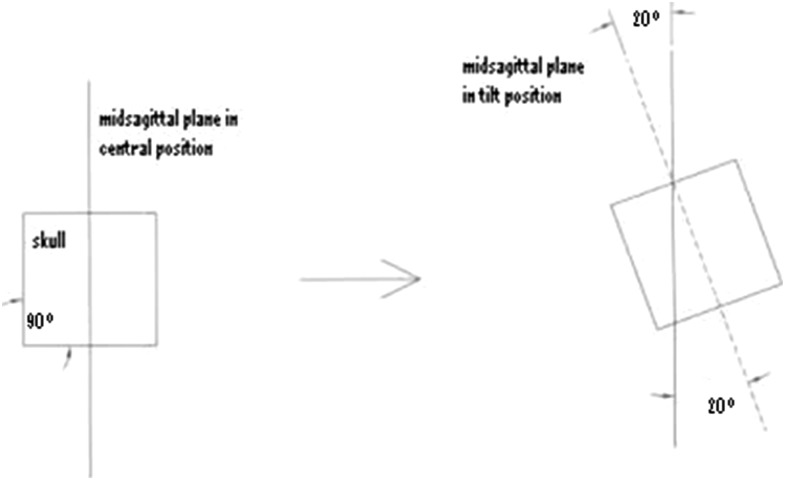
In central position, laser light of the CBCT unit was adjusted to the mid-sagittal plane of the skull. The Frankfurt plane of the skull was perpendicular to the horizon, and CBCT scans were obtained in this position (Figure 7a). To obtain CBCT scans in the tilted position, skulls were first placed in central position. After confirming the central position of each skull, the skulls were tilted by 10° and 20°. As shown in Figure 8, the mid-sagittal plane of the skull in central position was considered as the reference plane, and then the skull was tilted to the right by 20° (corresponding to the dotted line) (Figure 7b).
Figure 8.
A schematic view of the tilted position of the skull by 20° relative to the central position to take CBCT scans in the 20° tilted position.
To obtain CBCT scans in rotation, the skulls were first placed in the central position. After confirming, the skulls were rotated by 10° and 20° (Figure 7c). Triangular wedges measuring 4 × 20 × 25 mm and 8 × 20 × 25 mm and tapered by 10° and 20° towards their tip were placed beneath the styrofoam sheet from the left side, and images were captured.
To obtain CBCT scans in tipped position, after confirming the central position of each skull on CBCT scans, triangular wedges were placed beneath the styrofoam sheet and the skulls were tipped downwards by 10° and 20° (Figure 7d).
Image evaluation
The PA cephalograms were obtained from CBCT images. The steps taken to obtain a CBCT PA cephalogram in NewTom 3G are as follows: image creation, new 3D model, load 3D and ray cast model style. On conventional and CBCT PA cephalograms taken at seven different positions, the distance from each of the below-mentioned landmarks to the mid-sagittal plane was measured using Dolphin 2D software v. 11.7 (Chatsworth, CA).
Jugale (J): the intersection point of outline of the maxillary tuberosity and zygomatic buttress in the right and left sides
Antegonion (AG): the notch at the inferolateral margin of AG protuberance in the right and left sides
Zygomaticofrontal suture: the cranial suture between the frontal and zygomatic bones
Zygomatic arch: this is formed by the zygomatic process of the temporal bone.
Width of nasal pyriform: nasal cavity at the widest point
Condylion: this is the most lateral point of the mandible in the glenoid fossa of the temporal bone.
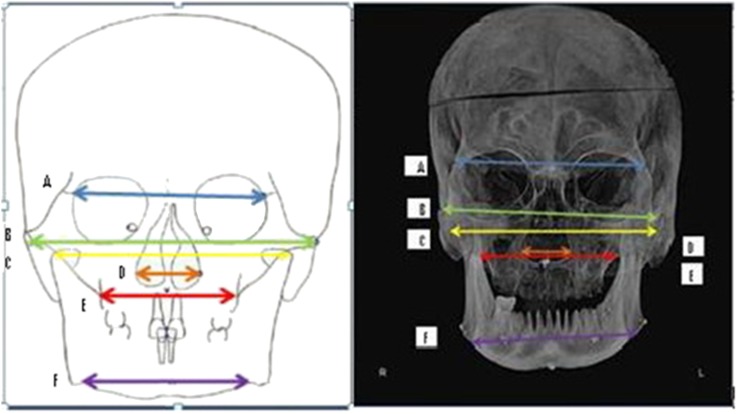
Figure 9 shows the schematic view and PA cephalogram of transverse distances between the zygomaticofrontal suture, zygomatic arch, condylion, jugale, nasal cavity and antegonion landmarks.
Figure 9.
Transverse distances between landmarks: (A) zygomaticofrontal suture–zygomaticofrontal suture, (B) zygomatic arch–zygomatic arch, (C) condylion–condylion, (D) nasal cavity–nasal cavity, (E) jugale (J)–J, (F) antegonion (AG)–AG.
Statistical analysis
On conventional and CBCT PA cephalograms, the central position of skulls 1–10 was considered as the gold standard, and the distances measured in other positions were compared with the gold standard values. Transverse measurements made in tilted, rotated and tipped positions were compared with the transverse distances measured in the central position of the skulls (for each landmark). The paired t-test was used to compare the mean values for each position (separately for each landmark) with the gold standard values. All statistical analyses were performed using SPSS® v. 12 (IBM Corp., New York, NY; formerly SPSS Inc., Chicago, IL) and R software v. 3.0.2 (random effects model and Bootstrap model; University of Auckland, New Zealand) with 95% confidence interval. Also, the interclass correlation coefficient and the Bland–Altman plot were used to compare the mean values measured by the two observers. Observations were made by two experienced observers. The first observer was an oral and maxillofacial radiologist and the second observer was an orthodontist. Each observer made the measurements independently. 2 weeks later, all measurements were repeated by the two observers.
Results
For the conventional and CBCT PA cephalograms, central positions of the 10 skulls were considered as the gold standard. The mean values of the distances in the right and left sides of the 10 skulls in 10° tilted position were independently calculated and compared with the mean distances of the right and left sides on PA cephalograms of the 10 skulls in central position. This was repeated for other positions as well. The results are presented in Tables 1 and 2. Based on the results presented in Tables 1 and 2, changes in transverse distances between landmarks in tested positions of the skulls relative to the central position were evaluated.
Table 1.
Comparison of measurements made in tilted, rotated and tipping positions with those made in central position on conventional posteroanterior cephalograms separately for each landmark (in mm)
| Position |
Central |
Tilt 10° |
p-value | Tilt 20° |
p-value | Central |
Tilt 10° |
p-value | Tilt 20° |
p-value |
|---|---|---|---|---|---|---|---|---|---|---|
| Side |
R |
R |
R |
L |
L |
L |
||||
| PAC | Mean ± SD | Mean ± SD | Mean ± SD | Mean ± SD | Mean ± SD | Mean ± SD | ||||
| AG | 39.46 ± 4.87 | 37.76 ± 4.27 | 0.019 | 37.40 ± 3.89 | 0.026 | 41.72 ± 3.74 | 43.17 ± 3.87 | 0.078 | 43.87 ± 3.98 | 0.021 |
| J | 28.24 ± 2.58 | 27.77 ± 2.71 | 0.589 | 27.26 ± 2.46 | 0.214 | 28.98 ± 3.11 | 29.68 ± 2.73 | 0.281 | 29.69 ± 2.68 | 0.239 |
| ZA | 53.65 ± 1.74 | 53.40 ± 1.52 | 0.512 | 53.37 ± 1.55 | 0.627 | 54.52 ± 1.68 | 54.71 ± 1.53 | 0.704 | 54.87 ± 1.72 | 0.576 |
| NC | 11.12 ± 1.51 | 10.82 ± 1.55 | 0.341 | 10.47 ± 1.64 | 0.171 | 12.84 ± 2.29 | 12.84 ± 1.45 | 1.00 | 12.94 ± 2.43 | 0.856 |
| ZF | 50.22 ± 1.11 | 49.80 ± 0.90 | 0.445 | 49.78 ± 1.04 | 0.339 | 49.91 ± 1.04 | 50.24 ± 1.10 | 0.493 | 50.26 ± 1.10 | 0.384 |
| CO | 52.57 ± 2.98 | 51.80 ± 2.69 | 0.410 | 50.47 ± 1.93 | 0.022 | 54.25 ± 4.19 | 55.96 ± 4.15 | 0.103 | 56.34 ± 4.08 | 0.023 |
| Position | Central | Rotation 10° | p-value | Rotation 20° | p-value | Central | Rotation 10° | p-value | Rotation 20° | p-value |
| Side | R | R | R | L | L | L | ||||
| PAC | Mean ± SD | Mean ± SD | Mean ± SD | Mean ± SD | Mean ± SD | Mean ± SD | ||||
| AG | 39.46 ± 4.87 | 36.22 ± 6.22 | 0.027 | 34.36 ± 8.10 | 0.008 | 41.72 ± 3.74 | 44.73 ± 4.51 | 0.023 | 48.29 ± 3.95 | 0.001 |
| J | 28.24 ± 2.58 | 27.43 ± 2.22 | 0.429 | 26.29 ± 3.57 | 0.157 | 28.98 ± 3.11 | 30.21 ± 4.20 | 0.245 | 30.70 ± 4.31 | 0.142 |
| ZA | 53.65 ± 1.74 | 51.06 ± 2.14 | 0.012 | 50.07 ± 2.10 | 0.003 | 54.52 ± 1.68 | 56.45 ± 2.90 | 0.102 | 57.36 ± 2.05 | 0.007 |
| NC | 11.12 ± 1.51 | 10.29 ± 1.86 | 0.224 | 9.34 ± 2.46 | 0.085 | 12.84 ± 2.29 | 12.92 ± 1.76 | 0.915 | 13.24 ± 2.95 | 0.675 |
| ZF | 50.22 ± 1.11 | 49.02 ± 1.63 | 0.052 | 48.77 ± 1.17 | 0.030 | 49.91 ± 1.04 | 50.64 ± 1.32 | 0.083 | 50.81 ± 2.37 | 0.259 |
| CO | 52.57 ± 2.98 | 47.32 ± 5.15 | 0.025 | 42.79 ± 6.97 | 0.000 | 54.25 ± 4.19 | 61.14 ± 6.10 | 0.002 | 64.68 ± 7.01 | 0.000 |
| Position | Central | Tip 10° | p-value | Tip 20° | p-value | Central | Tip 10° | p-value | Tip 20° | p-value |
| Side | R | R | R | L | L | L | ||||
| PAC | Mean ± SD | Mean ± SD | Mean ± SD | Mean ± SD | Mean ± SD | Mean ± SD | ||||
| AG | 39.46 ± 4.87 | 40.33 ± 5.30 | 0.096 | 41.19 ± 5.11 | 0.031 | 41.72 ± 3.74 | 41.78 ± 3.24 | 0.926 | 42.79 ± 3.56 | 0.038 |
| J | 28.24 ± 2.58 | 28.27 ± 2.82 | 0.968 | 28.31 ± 3.16 | 0.944 | 28.98 ± 3.11 | 29.16 ± 1.81 | 0.737 | 29.56 ± 2.54 | 0.380 |
| ZA | 53.65 ± 1.74 | 53.65 ± 1.65 | 1.000 | 53.72 ± 2.32 | 0.933 | 54.52 ± 1.68 | 54.52 ± 1.68 | 0.759 | 55.27 ± 1.61 | 0.322 |
| NC | 11.12 ± 1.51 | 11.13 ± 1.42 | 0.981 | 11.21 ± 0.76 | 0.821 | 12.84 ± 2.29 | 12.89 ± 1.82 | 0.928 | 13.04 ± 1.27 | 0.678 |
| ZF | 50.22 ± 1.11 | 50.28 ± 0.44 | 0.910 | 50.31 ± 1.00 | 0.842 | 49.91 ± 1.04 | 50.08 ± 0.84 | 0.614 | 50.13 ± 0.87 | 0.564 |
| CO | 52.57 ± 2.98 | 52.62 ± 2.77 | 0.944 | 52.77 ± 4.29 | 0.868 | 54.25 ± 4.19 | 54.47 ± 4.48 | 0.788 | 55.16 ± 6.90 | 0.579 |
AG, antegonion; CO, condylion; J, jugale; L, left; NC, nasal cavity; PAC, conventional posterior anterior cephalometry; R, right; SD, standard deviation; ZA, zygomatic arch; ZF, zygomaticofrontal suture.
The values given in bold are statistically significant.
Table 2.
Comparison of measurements made in tilted, rotated and tipping positions with those made in central position on CBCT posteroanterior cephalograms separately for each landmark (in mm)
| Position |
Central |
Tilt 10° |
p-value | Tilt 20° |
p-value | Central |
Tilt 10° |
p-value | Tilt 20° |
p-value |
|---|---|---|---|---|---|---|---|---|---|---|
| Side |
R |
R |
R |
L |
L |
L |
||||
| PAC/CBCT | Mean ± SD | Mean ± SD | Mean ± SD | Mean ± SD | Mean ± SD | Mean ± SD | ||||
| AG | 41.30 ± 4.87 | 40.92 ± 4.20 | 0.762 | 40.71 ± 4.57 | 0.588 | 40.25 ± 3.63 | 42.30 ± 3.31 | 0.027 | 42.47 ± 3.29 | 0.025 |
| J | 30.10 ± 2.31 | 28.30 ± 2.32 | 0.032 | 28.21 ± 2.58 | 0.050 | 28.96 ± 2.35 | 29.05 ± 2.20 | 0.876 | 29.17 ± 1.51 | 0.787 |
| ZA | 54.21 ± 1.46 | 54.03 ± 1.55 | 0.772 | 53.95 ± 2.02 | 0.736 | 53.27 ± 1.45 | 54.73 ± 1.72 | 0.082 | 54.79 ± 2.20 | 0.130 |
| NC | 10.89 ± 1.25 | 10.31 ± 1.57 | 0.259 | 10.05 ± 1.16 | 0.070 | 11.04 ± 1.30 | 11.41 ± 0.55 | 0.405 | 11.63 ± 0.59 | 0.215 |
| ZF | 50.43 ± 0.40 | 50.06 ± 0.59 | 0.032 | 49.94 ± 1.19 | 0.168 | 49.84 ± 0.46 | 49.95 ± 0.53 | 0.497 | 50.15 ± 0.95 | 0.248 |
| CO | 54.22 ± 3.39 | 53.51 ± 1.79 | 0.536 | 52.09 ± 2.93 | 0.008 | 53.17 ± 3.04 | 53.35 ± 3.50 | 0.816 | 53.56 ± 4.07 | 0.744 |
| Position | Central | Rotation 10° | p-value | Rotation 20° | p-value | Central | Rotation 10° | p-value | Rotation 20° | p-value |
| Side | R | R | R | L | L | L | ||||
| PAC/CBCT | Mean ± SD | Mean ± SD | Mean ± SD | Mean ± SD | Mean ± SD | Mean ± SD | ||||
| AG | 41.30 ± 4.87 | 34.47 ± 4.48 | 0.000 | 27.54 ± 4.84 | 0.000 | 40.25 ± 3.63 | 49.27 ± 4.51 | 0.000 | 63.01 ± 5.63 | 0.000 |
| J | 30.10 ± 2.31 | 25.70 ± 3.11 | 0.000 | 21.12 ± 3.82 | 0.000 | 28.96 ± 2.35 | 32.79 ± 2.11 | 0.010 | 41.97 ± 4.04 | 0.000 |
| ZA | 54.21 ± 1.46 | 48.10 ± 2.29 | 0.000 | 34.26 ± 3.04 | 0.000 | 53.27 ± 1.45 | 57.93 ± 2.69 | 0.000 | 65.98 ± 5.09 | 0.000 |
| NC | 10.89 ± 1.25 | 10.29 ± 1.86 | 0.224 | 9.34 ± 2.46 | 0.085 | 11.04 ± 1.30 | 12.07 ± 2.17 | 0.179 | 12.58 ± 2.27 | 0.157 |
| ZF | 50.43 ± 0.40 | 48.10 ± 2.31 | 0.013 | 42.87 ± 3.54 | 0.000 | 49.84 ± 0.46 | 52.88 ± 4.33 | 0.044 | 57.39 ± 3.06 | 0.000 |
| CO | 54.22 ± 3.39 | 42.03 ± 4.26 | 0.000 | 32.40 ± 6.10 | 0.000 | 53.17 ± 3.04 | 63.41 ± 5.96 | 0.000 | 79.19 ± 4.14 | 0.000 |
| Position | Central | Tip 10° | p-value | Tip 20° | p-value | Central | Tip 10° | p-value | Tip 20° | p-value |
| Side | R | R | R | L | L | L | ||||
| PAC/CBCT | Mean ± SD | Mean ± SD | Mean ± SD | Mean ± SD | Mean ± SD | Mean ± SD | ||||
| AG | 41.30 ± 4.87 | 42.52 ± 3.72 | 0.242 | 43.63 ± 5.50 | 0.075 | 40.25 ± 3.63 | 41.07 ± 2.00 | 0.463 | 42.85 ± 3.42 | 0.064 |
| J | 30.10 ± 2.31 | 30.53 ± 1.43 | 0.537 | 30.74 ± 0.79 | 0.416 | 28.96 ± 2.35 | 29.07 ± 2.26 | 0.842 | 29.52 ± 3.34 | 0.484 |
| ZA | 54.21 ± 1.46 | 54.37 ± 3.11 | 0.866 | 55.68 ± 3.53 | 0.181 | 53.27 ± 1.45 | 53.58 ± 3.13 | 0.817 | 55.32 ± 3.74 | 0.125 |
| NC | 10.89 ± 1.25 | 11.31 ± 0.13 | 0.360 | 11.47 ± 0.58 | 0.197 | 11.04 ± 1.30 | 11.97 ± 1.05 | 0.149 | 11.98 ± 0.59 | 0.062 |
| ZF | 50.43 ± 0.40 | 50.54 ± 0.94 | 0.663 | 50.76 ± 1.42 | 0.429 | 49.84 ± 0.46 | 49.84 ± 0.46 | 0.748 | 50.03 ± 0.78 | 0.551 |
| CO | 54.22 ± 3.39 | 54.67 ± 5.28 | 0.639 | 55.16 ± 5.00 | 0.601 | 53.17 ± 3.04 | 53.48 ± 4.37 | 0.803 | 53.77 ± 4.17 | 0.688 |
AG, antegonion; CO, condylion; J, jugale; L, left; NC, nasal cavity; PAC/CBCT, the posterior anterior cephalograms were obtained from CBCT images; R, right; SD, standard deviation; ZA, zygomatic arch; ZF, zygomaticofrontal suture.
The values given in bold are statistically significant.
In our study, on both conventional and CBCT cephalograms, the mean distances from different landmarks to the mid-sagittal plane in tilted and rotated positions were smaller than those in the central position on the right side and greater than those in the central position on the left side. Since tilting and rotation of skulls were towards the right, the values measured in this position on the right were smaller than the values measured in the central position. The opposite was true for the left side. The changes in 20° tilted and rotated positions compared with the central position were greater than those in 10° tilted and rotated positions. The rotated position affected the mean values more than the tilted position. The mean distances measured in tipped position were the closest to the mean values measured in central position. In the tipped position, the mean distances measured were greater than those measured in the central position (and had an ascending trend). These changes in 20° tipped position were greater than those in 10° tipped position.
Next, the mean distances on the right and left sides of the 10 skulls in central position on conventional PA cephalograms (gold standard) were compared with those on CBCT PA cephalograms of the 10 skulls. The results are presented in Table 3. As shown in Table 3, the mean values of distances measured on CBCT PA cephalograms were greater than those measured on conventional PA cephalograms, and the difference in this regard was significant for some landmarks (p < 0.05).
Table 3.
Comparison of measurements made in central position on conventional and CBCT posteroanterior cephalograms separately for each landmark (in mm)
| Position |
Central PAC |
Central PAC/CBCT |
p-value | Central PAC |
Central PAC/CBCT |
p-value |
|---|---|---|---|---|---|---|
| Side |
R |
R |
L |
L |
||
| PAC | Mean ± SD | Mean ± SD | Mean ± SD | Mean ± SD | ||
| AG | 39.46 ± 4.87 | 41.30 ± 4.87 | 0.008 | 41.72 ± 3.74 | 40.25 ± 3.63 | 0.127 |
| J | 28.24 ± 2.58 | 30.10 ± 2.31 | 0.030 | 28.98 ± 3.11 | 28.96 ± 2.35 | 0.985 |
| ZA | 53.65 ± 1.74 | 54.21 ± 1.46 | 0.084 | 54.52 ± 1.68 | 53.27 ± 1.45 | 0.104 |
| NC | 11.12 ± 1.51 | 10.89 ± 1.25 | 0.582 | 12.84 ± 2.29 | 11.04 ± 1.30 | 0.014 |
| ZF | 50.22 ± 1.11 | 50.43 ± 0.40 | 0.500 | 49.91 ± 1.04 | 49.84 ± 0.46 | 0.807 |
| CO | 52.57 ± 2.98 | 54.22 ± 3.39 | 0.241 | 54.25 ± 4.19 | 53.17 ± 3.04 | 0.407 |
AG, antegonion; CO, condylion; J, jugale; L, left; NC, nasal cavity; PAC, posterior anterior cephalomety; PAC/CBCT, the posterior anterior cephalograms were obtained from CBCT images; R, right; SD, standard deviation; ZA, zygomatic arch; ZF, zygomaticofrontal suture.
The values given in bold are statistically significant.
The Bootstrap simulation method was conducted to assess the difference in standard deviation (SD) of central position on conventional and CBCT PA cephalograms.
The results are shown in Table 4. As presented in Table 4, the difference in the SDs of the mean distances of different landmarks in central position was not significant between conventional and CBCT PA cephalograms. Since there was no significant difference in the SDs of the two modalities, the mean values obtained in central position were compared between the two methods.
Table 4.
The mean, confidence interval and significance of differences in the accuracy of measurements made in central position on conventional and CBCT posteroanterior cephalograms separately for each landmark (in mm)
| Landmark | Number of repetition | Mean (SD) | Confidence interval 95% | Significant difference in accuracy |
|---|---|---|---|---|
| PAC-AG-R | 1000 | 4.57 | 2.82–6.32 | No difference |
| PAC/CBCT-AG-R | 1000 | 4.60 | 3.17–6.03 | |
| PAC-AG-L | 1000 | 3.44 | 1.96–4.91 | No difference |
| PAC/CBCT-AG-L | 1000 | 3.33 | 1.55–5.11 | |
| PAC-J-R | 1000 | 2.40 | 1.56–3.24 | No difference |
| PAC/CBCT-J-R | 1000 | 2.14 | 1.24–3.02 | |
| PAC-J-L | 1000 | 3.88 | 1.64–4.12 | No difference |
| PAC/CBCT-J-L | 1000 | 2.18 | 1.33–3.03 | |
| PAC-ZA-R | 1000 | 1.63 | 1.12–2.14 | No difference |
| PAC/CBCT-ZA-R | 1000 | 1.35 | 0.80–1.93 | |
| PAC-ZA-L | 1000 | 1.57 | 1.06–2.08 | No difference |
| PAC/CBCT-ZA-L | 1000 | 1.36 | 0.78–1.93 | |
| PAC-NC-R | 1000 | 1.40 | 0.88–1.91 | No difference |
| PAC/CBCT-NC-R | 1000 | 1.17 | 0.78–1.55 | |
| PAC-NC-L | 1000 | 2.16 | 1.54–2.77 | No difference |
| PAC/CBCT-NC-L | 1000 | 1.18 | 0.45–1.91 | |
| PAC-ZF-R | 1000 | 1.03 | 0.53–1.53 | No difference |
| PAC/CBCT-ZF-R | 1000 | 0.38 | 0.24–1.52 | |
| PAC-ZF-L | 1000 | 0.97 | 0.50–1.44 | No difference |
| PAC/CBCT-ZF-L | 1000 | 0.43 | 0.29–0.56 | |
| PAC-CO-R | 1000 | 2.80 | 1.46–3.73 | No difference |
| PAC/CBCT-CO-R | 1000 | 3.13 | 1.70–4.57 | |
| PAC-CO-L | 1000 | 3.89 | 2.11–5.67 | No difference |
| PAC/CBCT-CO-L | 1000 | 2.84 | 1.85–3.84 |
AG, antegonion; CO, condylion; J, jugale; NC, nasal cavity; SD, standard deviation; ZA, zygomatic arch; ZF, zygomaticofrontal suture.
Changes in measurements of different landmarks in tilted, rotated and tipped positions (compared with the central position) were compared between conventional and CBCT PA cephalograms. Table 5 shows significant changes in this regard between the two modalities. As demonstrated in Table 5, significant differences were noted for most landmarks in measurements made on conventional and CBCT PA cephalograms in 10° and 20° rotations compared with the central position at both sides.
Table 5.
Comparison of measurements made in the right and left sides in 10° and 20° rotations compared with the central position on conventional and CBCT posteroanterior cephalograms separately for each landmark (in mm)
| Landmark | Mean | SD | 95% confidence interval of the difference |
p-value | |
|---|---|---|---|---|---|
| Lower | Upper | ||||
| Right | |||||
| AG—Rotation 10 | 3.590 | 4.306 | 0.509 | 6.670 | 0.027 |
| AG—Rotation 20 | 8.660 | 7.444 | 3.334 | 13.985 | 0.005 |
| J—Rotation 10 | 3.590 | 4.012 | 0.719 | 6.460 | 0.020 |
| J—Rotation 20 | 7.030 | 5.021 | 3.437 | 10.622 | 0.002 |
| ZA—Rotation 10 | 3.520 | 3.530 | 0.994 | 6.045 | 0.012 |
| ZA—Rotation 20 | 16.370 | 3.472 | 13.885 | 18.854 | 0.000 |
| NC—Rotation 10 | −0.680 | 2.199 | −2.253 | 0.893 | 0.354 |
| NC—Rotation 20 | −1.080 | 2.839 | −3.111 | 0.951 | 0.260 |
| ZF—Rotation 10 | 1.130 | 2.585 | −0.719 | 2.979 | 0.200 |
| ZF—Rotation 20 | 6.110 | 3.829 | 3.370 | 8.849 | 0.001 |
| CO—Rotation 10 | 6.940 | 7.287 | 1.726 | 12.153 | 0.015 |
| CO—Rotation 20 | 12.040 | 7.384 | 6.757 | 17.322 | 0.001 |
| Left | |||||
| AG—Rotation 10 | −6.010 | 3.980 | −8.857 | −3.162 | 0.001 |
| AG—Rotation 20 | −16.190 | 6.539 | −20.868 | −11.511 | 0.000 |
| J—Rotation 10 | −2.600 | 5.983 | −6.880 | 1.680 | 0.203 |
| J—Rotation 20 | −11.290 | 6.738 | −16.110 | −6.469 | 0.000 |
| ZA—Rotation 10 | −2.730 | 3.451 | −5.199 | −0.260 | 0.034 |
| ZA—Rotation 20 | −9.870 | 5.413 | −13.742 | −5.997 | 0.000 |
| NC—Rotation 10 | −0.950 | 2.540 | −2.767 | 0.867 | 0.267 |
| NC—Rotation 20 | −1.140 | 3.696 | −3.783 | 1.503 | 0.355 |
| ZF—Rotation 10 | −2.310 | 4.476 | −5.512 | 0.892 | 0.137 |
| ZF—Rotation 20 | −6.650 | 3.642 | −9.255 | −4.044 | 0.000 |
| CO—Rotation 10 | −3.350 | 7.578 | −8.771 | 2.071 | 0.196 |
| CO—Rotation 20 | −15.590 | 8.319 | −21.541 | −9.638 | 0.000 |
AG, antegonion; CO, condylion; J, jugale; NC, nasal cavity; SD, standard deviation; ZA, zygomatic arch; ZF, zygomaticofrontal suture.
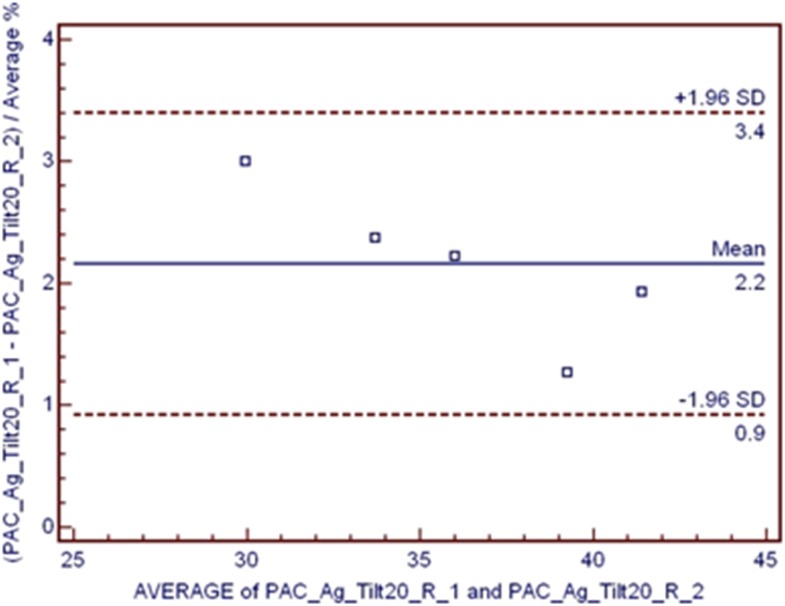
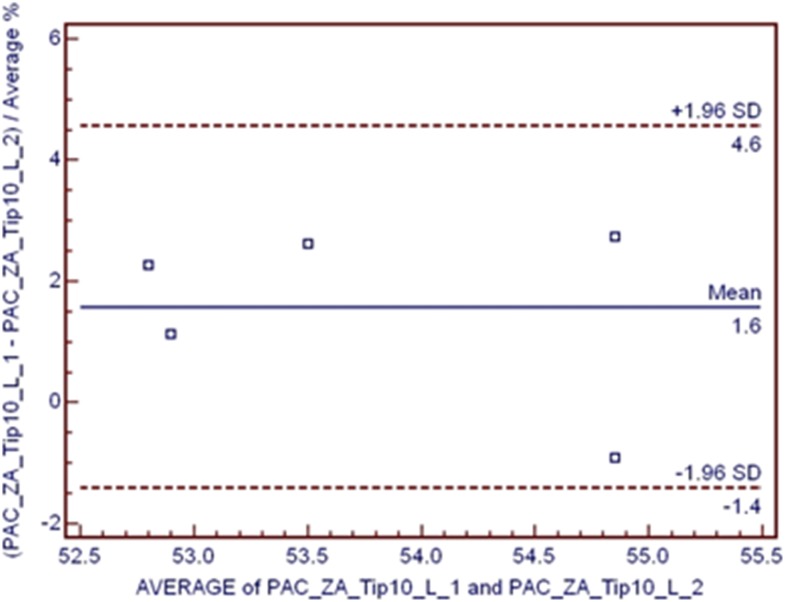
To assess the interobserver agreement in conventional and CBCT PA cephalometry, interclass correlation coefficient was applied and the Bland–Altman plot was drawn for the items with the highest and lowest significance. The results are presented in Figures 10 and 11. Figure 10 shows a high interobserver agreement for AG measurements in the tilted position by 20° on a conventional PA cephalogram. Figure 11 shows a low interobserver agreement for zygomatic arch measurements in tipping by 10° on the left side on the conventional PA cephalogram.
Figure 10.
High interobserver agreement in antegonion measurements in 20° tilted position in the right side on conventional posteroanterior cephalogram. SD, standard deviation.
Figure 11.
Low interobserver agreement in zygomatic arch measurements in the 10° tilted position in the left side on conventional posteroanterior cephalogram. SD, standard deviation.
Discussion
PA cephalometry provides valuable information about the asymmetries and horizontal jaw relations. Data obtained from PA cephalograms are of high clinical significance in patients requiring surgical interventions.2 Also, CBCT is requested for patients with 3D deformities such as craniofacial anomalies or orofacial clefts. Evidence shows that conventional lateral cephalograms may be comparable with CBCT cephalograms.18–20 Use of CBCT-generated lateral and PA cephalograms has greatly increased in the recent years and has become a routine in diagnostic CBCT report of patients undergoing orthodontic treatment.12
In the present study, dry skulls were used because patient exposure by both conventional radiography and CBCT was not ethically feasible. This study aimed to assess the effect of head position on skeletal landmark detection and transverse analysis on PA cephalograms. Thus, soft tissues were not simulated in order to allow better visualization of skeletal landmarks and prevent image distortion. As a result, errors in detection of landmarks decreased, and skeletal landmarks were more easily and accurately identified and traced. Landmark selection in each analysis depends on the objective of the respective analysis.21 The highest error in cephalometric studies is related to landmark identification. Identification of points at the intersections of two lines is by far easier than that of those on wide arches. The J landmark is located at the intersection of the maxillary tuberosity and zygomatic buttress, but AG is located on a wide arch.22–24
The slice thickness of orthogonal or multiplanar reformatted images can be “thickened” by increasing the number of adjacent voxels in the display. This results in an image slab representing a specific volume of the patient, referred to as a ray sum. The slab thickness is often variable and is determined by the thickness of the structure to be imaged. Full-thickness perpendicular ray sum images can be used to generate simulated projections, such as lateral cephalometric images. This technique uses the entire volumetric data set, and interpretation is negatively affected by “anatomic noise”, the superimposition of multiple structures also inherent in conventional projection radiography.25 The mean of SDs for measurements made on CBCT PA cephalograms was lower than that of conventional PA cephalograms. Therefore, CBCT PA cephalograms are probably more accurate than conventional PA cephalograms. The reason for this finding may be the statistically significant difference in identification of landmarks on conventional and CBCT cephalograms. Another reason is that in contrast to conventional radiographs, these ray sum images are without magnification and parallax distortion.25 Since the CBCT PA cephalograms do not have magnification or parallax distortion (compared with conventional PA cephalograms), landmark identification and subsequent transverse measurements on CBCT PA cephalograms have higher accuracy.25
Chen et al,12 in their study, concluded that CBCT cephalograms were more reliable than conventional cephalograms for detection of landmarks. Their results were similar to our findings. Cattaneo et al26 found no significant difference between measurements made on conventional radiographs and those made on CBCT cephalograms (p > 0.05). Their results were in contrast to ours. In conventional cephalometry, X-ray beams are not parallel. Thus, objects closer to the X-ray tube have higher magnification on the image. When 3D structures of the skull are visualized on a 2D detector, varying distances from the X-ray tube result in different sizes of landmarks on the image. However, 2D cephalograms synthesized of CBCT scans are built by adjusting the centre of projection at an infinite distance from the projection plane; thus, parallel rays are simulated and magnification errors are non-existent. Thus, reliability of landmark identification is higher in CBCT cephalometry.12 Also, CBCT cephalograms have higher contrast than conventional cephalograms, and thus anatomical landmarks can be evaluated more easily and with higher accuracy.27
In our study, the mean distances measured on CBCT PA cephalograms were greater than those measured on conventional PA cephalograms. Also, on both conventional and CBCT PA cephalograms, significant changes in different positions (compared with the central position) were mainly related to AG, condylion and zygomaticofrontal suture landmarks. Oz et al24 concluded that identification and measurement of landmarks on curved surfaces of the skull such as AG and condylion on CBCT PA cephalograms are subject to more errors and alterations than other landmarks. Their findings were in agreement with ours. The reason is, on PA cephalograms, landmarks are located at varying distances from the midline and those farther from the midline are subject to more alterations than those closer to the midline.15
In the present study, we found that the rotated position affected the mean values more than the tilted position. The mean distances measured in tipped position were the closest to the mean values measured in central position. Hassan et al15 discussed that linear measurements are influenced by two factors, namely errors in patient positioning and location of anatomical landmarks. Moreover, Hassan et al15 showed that rotation of the skull (relative to the central position) caused more than 10-mm difference in measurement of transverse distances. It means that CBCT scans are sensitive even to the slightest changes in patient position. Linear measurements made on 2D lateral and CBCT PA cephalograms are also sensitive to the slightest changes in patient head position. These findings were in accordance with ours. Furthermore, van Vlijmen et al14 compared conventional and CBCT lateral cephalograms and reported a significant difference between the two (p < 0.05). Their results were in line with our findings. Also van Vlijmen et al reported that head tilting in both conventional and CBCT lateral cephalometry had no effect on the accuracy of linear or angular measurements because all these points would move in the same direction.14 Their results were in contrast to our findings. Reduction in accuracy of landmark identification as the result of head rotation may be attributed to superimposition of skull structures. Structures located farther from the rotational axis move to a greater extent than those closer to the rotational axis. Also, structures located opposite to the direction of rotation move towards the other side. In some cases, rotation of the skull results in superimposition of structures, which decreases the clarity of landmarks and increases the range of diagnostic errors. By rotating the head towards the left or right side, landmarks in the two sides of the skull are affected differently. In some cases, rotation of the skull results in movement of structures towards the area with less superimposition, and identification of structures is enhanced as such. By rotation of the skull around the mid-sagittal axis, horizontal relations are affected, but vertical relations remain unchanged; this complicates the assessment of asymmetry relative to the midline.28 In the tipped position, the mean distances measured were greater than those measured in the central position (had an ascending trend). This finding was in agreement with the results of Major et al,28 because the tipped position (rotation around a transverse axis) affects the relationship of landmarks in the vertical (and not horizontal) dimension, since landmarks on both sides of the skull move to the same extent. In our study, significant differences were noted for most landmarks in measurements made on conventional and CBCT PA cephalograms in 10° and 20° rotations compared with the central position at both sides. This controversy in the results of the two studies is attributed to the difference in PA and lateral cephalometry techniques. Rotation affects the measurement of distances made on CBCT PA cephalograms more than that on conventional cephalograms. Van Vlijmen et al2 reported that the difference in the mean measurements made on conventional and CBCT PA cephalograms was statistically significant (p < 0.001). Their findings were almost similar to ours. No statistically significant difference was noted in the interobserver agreements between the two methods of conventional and CBCT PA cephalometry. In the conventional PA cephalometry, the highest (99%) and the lowest (71%) agreement belonged to AG and zygomatic arch landmarks, respectively. In the CBCT PA cephalometry, the highest (99%) and the lowest (72%) agreement belonged to J and zygomaticofrontal suture landmarks, respectively.
This study was conducted on dry human skulls, and therefore it had limitations compared with in vivo studies. Future studies with the use of phantoms are required to simulate soft tissues to obtain more accurate results.
In conclusion, the CBCT PA cephalometry is more accurate than the conventional PA cephalometry. On both conventional and CBCT PA cephalograms, landmarks farther from the midline are subject to more changes than those closer to the midline. Rotation of the head affects the measurements made on CBCT PA cephalograms more than those made on conventional PA cephalograms.
Contributor Information
Abbas Shokri, Email: dr.sfalah@yahoo.com.
Sepideh Falah-kooshki, Email: Dr.sepidehf@yahoo.com.
References
- 1.Damstra J, Fourie Z, Ren Y. Evaluation and comparison of postero-anterior cephalograms and cone-beam computed tomography images for the detection of mandibular asymmetry. Eur J Orthod 2013; 35: 45–50. [DOI] [PubMed] [Google Scholar]
- 2.van Vlijmen OJ, Maal TJ, Bergé SJ, Bronkhorst EM, Katsaros C, Kuijpers-Jagtman AM. A comparsion of frontal radiographs obtained from cone beam CT scans and conventional frontal radiographs of human skulls. Int J Oral Maxillofac Surg 2009; 38: 773–8. doi: https://doi.org/10.1016/j.ijom.2009.02.024 [DOI] [PubMed] [Google Scholar]
- 3.Betts NJ, Vanarsdall RL, Barber HD, Higgins-Baeber K, Fonesca RJ. Diagnosis and treatment of transverse maxillary deficiency. Int J Adult Orthodon Orthognath Surg 1995; 10: 75–96. [PubMed] [Google Scholar]
- 4.Caple JM, Stephan CN, Gregory LS, MacGregor DM. Effect of head position on facial soft tissue depth measurements obtained using computed tomography. J Forensic Sci 2016; 61: 147–52. doi: https://doi.org/10.1111/1556-4029.12896 [DOI] [PubMed] [Google Scholar]
- 5.Poleti ML, Fernandes TM, Pagin O, Moretti MR, Rubira-Bullen IR. Analysis of linear measurements on 3D surface models using CBCT data segmentation obtained by automatic standard pre-set thresholds in two segmentation software programs: an in vitro study. Clin Oral Investig 2016; 20: 179–85. doi: https://doi.org/10.1007/s00784-015-1485-5 [DOI] [PubMed] [Google Scholar]
- 6.Leonardi R, Annunziata A, Caltabiano M. Landmark identification error in posteroanteriorcephalometric radiography: a systematic review. Angle Orthod 2008; 78: 761–5. [DOI] [PubMed] [Google Scholar]
- 7.Periago DR, Scarfe WC, Moshiri M, Scheetz JP, Silveria AM, Farman AG. Linear accuracy and reliability of cone beam CT derived 3-dimensional images constructed using an orthodontic volumetric rendering program. Angle Orthod 2008; 78: 387–95. [DOI] [PubMed] [Google Scholar]
- 8.Malkoc S, Sari Z, Usumez S, Koyuturk AE. The effect head rotation cephalometric radiographs. Eur J Orthod 2005; 27: 315–21. doi: https://doi.org/10.1093/ejo/cjh098 [DOI] [PubMed] [Google Scholar]
- 9.Betts NJ, Sturtz DH, Aldrich DA. Treatment of transverse (width) discrepancies in patients who require isolated mandibular surgery: the case for maxillary expansion. J Oral Maxillofac Surg 2004; 62: 361–4. [DOI] [PubMed] [Google Scholar]
- 10.Lee HJ, Lee S, Lee EJ, Song IJ, Kang BC, Lee JS, et al. A comparative study of the deviation of the menton on posteroanterior cephalograms and three-dimensional computed tomography. Imaging Sci Dent 2016; 46: 33–8. [DOI] [PMC free article] [PubMed] [Google Scholar]
- 11.Kim MS, Lee EJ, Song IJ, Lee JS, Kang BC, Yoon SJ. The location of midfacial landmarks according to the method of establishing the midsagittal reference plane in three-dimensional computed tomography analysis of facial asymmetry. Imaging Sci Dent 2015; 45: 227–32. [DOI] [PMC free article] [PubMed] [Google Scholar]
- 12.Chen MH, Chang JZ, Kok SH, Chen YJ, Huang YD, Cheng KY, et al. Intraobserver reliability of landmark identification in cone-beam computed tomography-synthesized two-dimensional cephalograms versus conventional cephalometric radiography: a preliminary study. J Dent Sci 2014; 9: 56–62. [Google Scholar]
- 13.Ludlow JB, Gubler M, Cevidanes L, Mol A. Precision of cephalometric landmark identification: cone-beam computed tomography vs conventional cephalometric views. Am J Orthod Dentofacial Orthop 2009; 136: 312.e1–10. [DOI] [PMC free article] [PubMed] [Google Scholar]
- 14.van Vlijmen OJ, Bergé SJ, Swennen GR, Bronkhorst EM, Katsaros C, Kuijpers-Jagtman AM. Comparison of cephalometric radiographs obtained from cone-beam computed tomography scans and conventional radiographs. J Oral Maxillofac Surg 2009; 67: 92–7. doi: https://doi.org/10.1016/j.joms.2008.04.025 [DOI] [PubMed] [Google Scholar]
- 15.Hassan B, van der Stelt P, Sanderink G. Accuracy of three-dimensional measurements obtained from cone beam computed tomography surface-rendered images for cephalometric analysis: influence of patient scanning position. Eur J Orthod 2009; 31: 129–34. [DOI] [PubMed] [Google Scholar]
- 16.Sato H, Ohki M, Kitamori H. A method for quantifying positional change of the condyle on lateral tomograms by means of digital subtraction. J Oral Rehabil 1998; 25: 448–55. doi: https://doi.org/10.1046/j.1365-2842.1998.00252.x [DOI] [PubMed] [Google Scholar]
- 17.Paul PE, Barbenel JC, Walker FS, Khambay BS, Moos KF, Ayoub AF. Evaluation of an improved orthognathic articulator system. 2. Accuracy of occlusal wafers. Int J Oral Maxillofac Surg 2012; 41: 155–9. [DOI] [PubMed] [Google Scholar]
- 18.Ludlow JB, Davies-Ludlow LE, Brooks SL, Howerton WB. Dosimetry of 3 CBCT devices for oral and maxillofacial radiology: CB Mercurary, NewTom 3G and i-CAT. Dentomaxillofac Radiol 2006; 35: 219–26. [DOI] [PubMed] [Google Scholar]
- 19.Greiner M, Greiner A, Hirschfelder U. Variance of landmarks in digital evaluation: comparsion between CT-based and conventional digital lateral cephalometric radiographs. [In German.] J Orofac Orthop 2007; 68: 290–8. [DOI] [PubMed] [Google Scholar]
- 20.Kumar V, Ludlow JB, Mol A, Cevidanes L. Comparison of conventional and cone beam CT synthesized cephalograms. Dentomaxillofac Radiol 2007; 36: 263–9. doi: https://doi.org/10.1259/dmfr/98032356 [DOI] [PubMed] [Google Scholar]
- 21.Major PW, Johnson DE, Hesse KL, Glover KE. Landmark identification error in posterior anterior cephalometrics. Angle Orthod 1994; 64: 447–54. [DOI] [PubMed] [Google Scholar]
- 22.El-Mangoury NH, Shaheen SI, Mostafa YA. Landmark identification in computerized posteroanterior cephalometrics. Am J Orthod Dentofacial Orthop 1987; 91: 57–61. [DOI] [PubMed] [Google Scholar]
- 23.Schlicher W, Nielsen I, Huang JC, Maki K, Hatcher DC, Miller AJ. Consistency and precision of landmark identification in three dimensional cone beam computed tomograph scans. Eur J Orthod 2012; 34: 263–75. [DOI] [PubMed] [Google Scholar]
- 24.Oz U, Orhan K, Abe N. Comparison of linear and angular measurements using two-dimensional conventional methods and three-dimensional cone beam CT images reconstructed from a volumetric rendering program in vivo. Dentomaxillofac Radiol 2011; 40: 492–500. [DOI] [PMC free article] [PubMed] [Google Scholar]
- 25.White SC, Pharoah MJ, eds. Oral radiology: principles and interpretation. 6th edn. St. Louis, MO: Mosby; 2014. [Google Scholar]
- 26.Cattaneo PM, Bloch CB, Calmar D, Hjortshøj M, Melsen B. Comparsion between conventional and cone-beam computed tomography-generated cephalograms. Am J Orthod Dentofacial Orthop 2008; 134: 798–802. [DOI] [PubMed] [Google Scholar]
- 27.Liedke GS, Delamare EL, Vizzotto MB, da Silveira HL, Prietsch JR, Dutra V, et al. Comparative study between conventional and cone beam CT-synthesized half and total skull cephalograms. Dentomaxillofac Radiol 2012; 41: 136–42. doi: https://doi.org/10.1259/dmfr/22287302 [DOI] [PMC free article] [PubMed] [Google Scholar]
- 28.Major PW, Johnson DE, Hesse KL, Glover KE. Effect of head orientation on posterior anterior cephalometric landmark identification. Angle Orthod 1996; 66: 51–60. [DOI] [PubMed] [Google Scholar]


