Abstract
Objectives:
To evaluate the accuracy of CBCT in assessing trabecular structures.
Methods:
Two human mandibles were scanned by micro-CT (Skyscan 1173 high-energy spiral scan micro-CT; Skyscan NV, Kontich, Belgium) and CBCT (3D Accuitomo 170; Morita, Japan). The CBCT images were reconstructed with 0.5 and 1 mm thicknesses. The condylar images were selected for registration. A parallel algorithm for histogram computation was introduced to perform the registration. A mutual information (MI) value was used to evaluate the match between the images obtained from micro-CT and CBCT.
Results:
In comparison with the micro-CT image for the two samples, the CBCT image with 0.5 mm thickness has a MI value of 0.873 and 0.903 while that with 1.0 mm thickness has a MI value of 0.741 and 0.752. The CBCT images with 0.5 mm thickness were better matched with micro-CT images.
Conclusions:
CBCT shows comparable accuracy with high-resolution micro-CT in assessing trabecular structures. CBCT can be a feasible tool to evaluate osseous changes of jaw bones.
Keywords: CBCT, micro-CT, trabecular structure
Introduction
A number of studies have investigated bone trabecular structures by quantifying their parameters using histomorphometry, backscattered electron imaging and microradiography,1–3 since the mechanical properties of these structures may affect bone strength and indicate early physiopathological changes. In dentistry, this osseous change could be observed during temporomandibular joint (TMJ) osteoarthritic progressing. The plate-like trabeculae are primarily oriented vertically and anteroposteriorly and are also optimal to resist compressive and tensile deformations during loading of the jawbones, especially of the TMJ.4,5 Some methods can be used to measure trabeculae parameters on excised bone specimens, such as histomorphometry. In addition, modern imaging techniques to characterize bone structure from three dimensions have been developed as non-invasive methods, such as micro-CT.
Micro-CT has become the “gold-standard” for evaluation of bone morphology and microstructure in the ex vivo bone model or small animal bone.6–8 On the other hand, clinical CBCT has been widely applied in dentistry for over two decades. It can offer high image quality with low radiation dose and at low cost. Liang et al9 reported that Accuitomo three-dimensional (3D) CBCT even had better visibility for the trabecular bone than multislice CT (MSCT). Clinically, Hsu et al10 did a comparison between micro-CT and dental CT in assessing trabecular bone microarchitecture parameters using rat femurs and lumbar vertebral body. The results showed different morphological parameters but with high correlations. So far, the reliability of CBCT to analyze the trabecular bone is still controversial and has not been properly studied in human clinics.11,12
In the present study, a 3D registration method was applied based on mutual information (MI) to align the CBCT images with micro-CT images, and a comparison of the condylar trabecular structure between the two imaging modalities was made in order to determine if the accuracy of CBCT is feasible to assess trabecular structures. Data of the human condyle were used in the present study due to easy access and data consistency.
Methods and materials
Two human mandibles obtained from Caucasian cadavers were used for the present investigation. The specimens were derived from patients who had donated their bodies for research and with ethical approval from the Department of Medical Basic Sciences (University of Hasselt, Hasselt, Belgium). Specimens were scanned by micro-CT (Skyscan 1173 high-energy spiral scan micro-CT; Skyscan NV, Kontich, Belgium) with the following scanning conditions: 130 kV, 61 μA, 900 ms exposure with 0.2° rotation steps, a 2240 × 2240 image size and 35-μm image pixel size. The same specimen were also scanned by a CBCT scanner (3D Accuitomo 170; Morita, Japan) at 80 kV, 2 mA tube current, 17 s scanning time, 360° rotation and 125-μm pixel size with 0.5 and 1 mm slice thickness. After scanning, the condylar images were selected for registration. The trabecular structures on CBCT images were aligned with the micro-CT images.
Registration algorithm
About mutual information
MI is widely used in image registration, especially in multimodal image registration problem. In MI, the entropy of a random variable is defined as:
where p(x) is the (marginal) probability density function. The MI of two random variables is defined as:
This concept is in a sense representative of the amount of information that one image provides about the other (Viola and Wells13).
When MI is used in image registration, the key requirement is to measure the joint spatiointensity probability distributions of the two images. And this process is also most time consuming. In our method, a parallel algorithm for histogram computation was introduced to speed up the registration.
Algorithm details
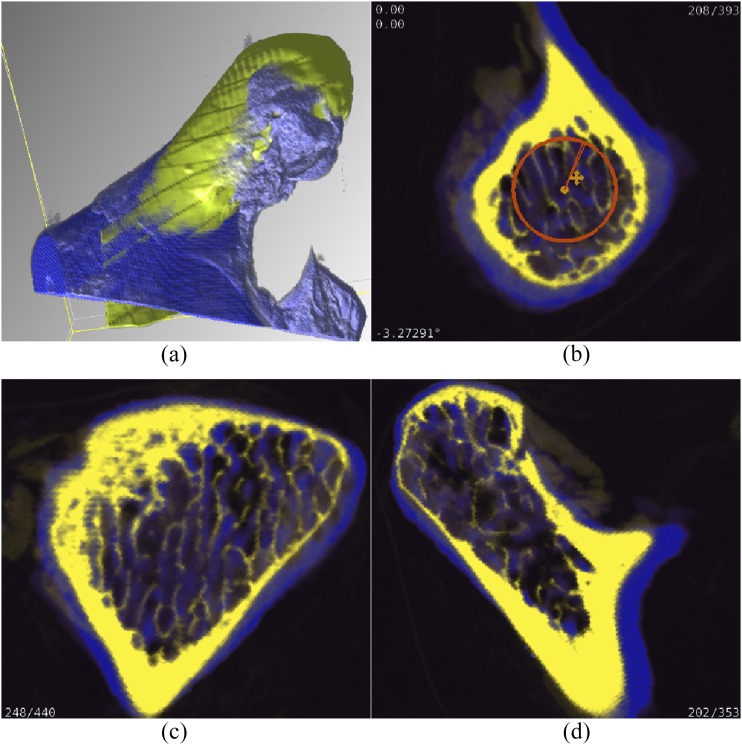
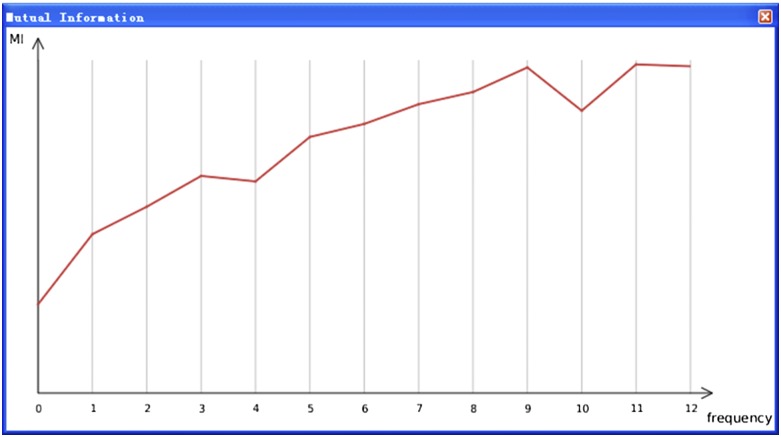
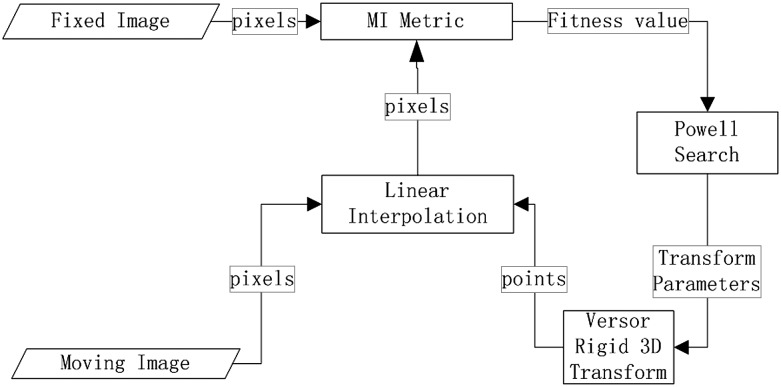
To reach the registration purpose, we firstly manipulated a widget to rotate and translated volume for co-registration purposes (Figure 1). In the process of manual adjustment, the real-time output of the MI value showed the matching degree of current operation. As shown in Figure 2, the MI value attained its maximum in the current state. Rather than computing MI for the whole volume of data, our algorithm computed it for three orthogonal slices: axial, sagittal and coronal. Owing to this simplification, we could do histogram computation that was completely conflict free and without the need of any update synchronization and costly data transfers between the graphics processing unit (GPU) and the central processing unit. For histogram computation, the GPU was programmed by means of compute unified device architecture,14 which was a new hardware and software architecture for computing on the GPU. Secondly, starting from the initial alignment, we can improve it by maximizing MI using iteration method. Figure 3 shows the framework of precise registration. The basic input data of this process are two images: one is defined as the fixed image and the other as the moving image. The precise registration is treated as an optimization problem with the goal of finding the spatial mapping that will bring the moving image into alignment with the fixed image.15 A rough alignment is made by moving the image to basically coincidence with the fixed image in the first step, therefore the speed of precise registration can be improved by up to 30 times compared with a central processing unit-based implementation.
Figure 1.
Three-dimensional images from different modalities (CBCT and micro-CT) aligned roughly and viewed in different colours. (a) Volume fused rendering of two images; (b) axial; (c) coronal; (d) sagittal.
Figure 2.
Real-time output of the mutual information (MI) value.
Figure 3.
Registration framework. 3D, three-dimensional; MI, mutual information.
Results
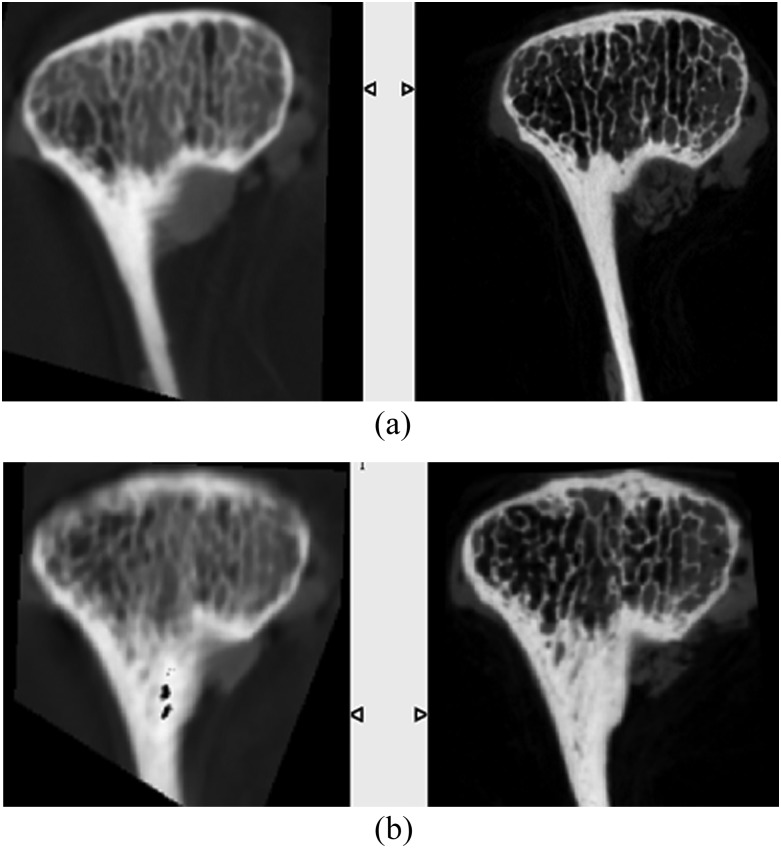
The example images from a registered data set are shown in Figure 4. For a thickness of 0.5 mm, the optimal MI values are 0.873 and 0.903 for the two samples, whereas for a thickness of 1.0 mm, the optimal MI values are 0.741 and 0.752 for the two samples (Table 1). For two reconstructions of one scanning process, the larger MI value indicated to a better matching degree. When the MI value equals 1, it represents an exact match, and a MI value of 0 represents an entirely unmatched result. When the MI value is >0.5, a reasonable match is indicated.
Figure 4.
Sample images from a registered micro-CT/CBCT pair. (a) Micro-CT image (right) vs CBCT image (left) of 0.5 mm slice thickness, (b) micro-CT image (right) vs CBCT image (left) of 1 mm slice thickness.
Table 1.
Mutual information value results of two samples
SL, slice thickness.
Good match: metric value ≥0.5.
Therefore, this computing result determined that CBCT images with slice thickness of 0.5 mm had better matching with micro-CT images than CBCT images with 1-mm slice thickness. Because micro-CT is considered widely as the gold standard, it can be concluded that CBCT images with a thickness of 0.5 mm is good for clinical investigation of mandibular trabeculae.
Discussion
The present study evaluated a new information theoretic approach that was efficient for finding the registration of volumetric medical images of differing modalities. Registration was achieved by adjusting the relative position and orientation until the MI between the images was maximized. In our derivation of the registration procedure, the imaging process took shorter time, but a good result was obtained by the algorithm (Figure 4) and the texture of trabeculae was aligned well. This approach works directly with image data; no pre-processing or segmentation is required. Therefore, it avoids errors caused by segmentation or pre-processing. This technique is, however, more flexible and robust than other intensity-based techniques such as correlation.16 Additionally, because of the complexity and irregular distribution of the TMJ trabeculae, it is hard to use registration methods based on feature point or frequency field. The method based on MI is effective for this kind of image, but it is a time-consuming process. An optimized procedure and a fast implementation through the compute unified device architecture were successfully programmed in the present study.
Evaluation of the trabeculae has been widely applied in analyzing the function and strength of bone, the healing of bone graft, bone disease (e.g. osteoporosis) and bone quality before the implant surgery and osseointegration after it. Such analysis was proposed to aid the diagnosis of bone disease. Although some methods such as microradiographs, quantitative backscattered electron imaging or histomorphometry allowed for accurate analysis of trabecular structures, these methods required a destructive process during specimen preparation and only allowed two-dimensional analysis with a small local region of interest. With 3D, scanning of whole bone specimens to analyze microarchitecture is available. Micro-CT imaging could provide a valid result with a “gold standard” accuracy for trabecular parameters, but its high radiation exposure and small scan field limit its clinical application in scanning patients. Medical MSCT is widely applied in clinical examination, but the resolution is not enough to evaluate bony microstructures. The limitation of CT to analyze trabeculae is the low signal-to-noise ratio and low resolution. The average thickness of the human trabeculae is 100–400 μm, and the average trabecular separation is 200–2000 μm.17 The ideal device to analyse trabecular structures requires a higher resolution than the thinnest trabeculae.18 The imaging resolution of the CBCT device used in the present study was 125 μm, which was close to the finest trabeculae, with low radiation which was 1/100–1/400 the radiation of MSCT.18 In addition, the reconstruction slice thickness of CT images may also affect parameter examinations. A thicker slice could cause an increased trabecular thickness and a decreased number of trabeculae.19 Liu et al19 also reported that the signal-to-noise ratio was too low to analyze trabecular structures when the slice thickness is <0.5 mm in CBCT. In the present research, we had the same finding and slice thicknesses with 0.5 and 1 mm were selected for the final alignments.
With the present alignment results, the peak value of MI is mostly close to 1 with 0.5-mm slice thickness CBCT images. Even with 1 mm slice thickness, the MI value of CBCT images was still >0.5, which was an acceptable result too. The MI value of such alignments would never be one because of the different resolutions of two different imaging modalities. Therefore, when the value is >0.5, a good match is considered. This finding suggests that assessments for mandibular trabeculae morphology based on the clinical CBCT scanner are comparable with those based on high-resolution micro-CT.
Conclusions
The present study showed a comparable accuracy between CBCT and micro-CT images on trabecular structures. This result may also support that non-invasive clinical CBCT can be a validation tool to provide useful information to estimate osseous changes of jaw bones which can account for the progress of dental diagnosis and treatments in a patient.
Contributor Information
Xin Liang, Email: lilyliang13@hotmail.com.
Zuyan Zhang, Email: zuyanzhang@pkuss.bjmu.edu.cn.
Jianping Gu, Email: gujianping@nuctech.com.
Zhihui Wang, Email: wzhsherlock@gmail.com.
Bart Vandenberghe, Email: bartvdberghe@hotmail.com.
Reinhilde Jacobs, Email: reinhilde.jacobs@uz.kuleuven.ac.be.
Jie Yang, Email: jieyang@temple.edu.
Guowu Ma, Email: xuchenma.bjmu@gmail.com.
Haibin Ling, Email: hbling@temple.edu.
Xuchen Ma, Email: xuchenma.bjmu@gmail.com.
References
- 1.Kuhn JL, Goldstein SA, Feldkamp LA, Goulet RW, Jesion G. Evaluation of a microcomputed tomography system to study trabecular bone structure. J Orthop Res 1990; 8: 833–42. doi: https://doi.org/10.1002/jor.1100080608 [DOI] [PubMed] [Google Scholar]
- 2.Müller R, Hahn M, Vogel M, Delling G, Rüegsegger P. Morphometric analysis of noninvasively assessed bone biopsies: comparison of high-resolution computed tomography and histologic sections. Bone 1996; 18: 215–20. doi: https://doi.org/10.1016/8756-3282(95)00489-0 [DOI] [PubMed] [Google Scholar]
- 3.Katakami K, Shimoda S, Kobayashi K, Kawasaki K. Histological investigation of osseous changes of mandibular condyles with backscattered electron images. Dentomaxillofac Radiol 2008; 37: 330–9. doi: https://doi.org/10.1259/dmfr/93169617 [DOI] [PubMed] [Google Scholar]
- 4.Giesen EB, van Eijden TM. The three-dimensional cancellous bone architecture of the human mandibular condyle. J Dent Res 2000; 79: 957–63. doi: https://doi.org/10.1177/00220345000790041101 [DOI] [PubMed] [Google Scholar]
- 5.van Ruijven LJ, Giesen EB, van Eijden TM. Mechanical significance of the trabecular microstructure of the human mandibular condyle. J Dent Res 2002; 81: 706–10. doi: https://doi.org/10.1177/154405910208101010 [DOI] [PubMed] [Google Scholar]
- 6.Martín-Badosa E, Amblard D, Nuzzo S, Elmoutaouakkil A, Vico L, Peyrin F. Excised bone structures in mice: imaging at three-dimensional synchrotron radiation micro CT. Radiology 2003; 229: 921–8. [DOI] [PubMed] [Google Scholar]
- 7.Ritman EL. Current status of developments and applications of micro-CT. Annu Rev Biomed Eng 2011; 13: 531–52. doi: https://doi.org/10.1146/annurev-bioeng-071910-124717 [DOI] [PubMed] [Google Scholar]
- 8.Burghardt AJ, Link TM, Majumdar S. High-resolution computed tomography for clinical imaging of bone microarchitecture. Clin Orthop Relat Res 2011; 469: 2179–93. doi: https://doi.org/10.1007/s11999-010-1766-x [DOI] [PMC free article] [PubMed] [Google Scholar]
- 9.Liang X, Lambrichts I, Sun Y, Denis K, Hassan B, Li L, et al. A comparative evaluation of cone beam computed tomography (CBCT) and multi-slice CT (MSCT). Part II: On 3D model accuracy. Eur J Radiol 2010; 75: 270–4. doi: https://doi.org/10.1016/j.ejrad.2009.04.016 [DOI] [PubMed] [Google Scholar]
- 10.Hsu J, Chen YJ, Ho JT, Huang HL, Wang SP, Cheng FC, et al. A Comparison of micro-CT and dental CT in assessing cortical bone morphology and trabecular bone microarchitecture. PLoS One 2014; 9: e107545. doi: https://doi.org/10.1371/journal.pone.0107545 [DOI] [PMC free article] [PubMed] [Google Scholar]
- 11.Hua Y, Nackaerts O, Duyck J, Maes F, Jacobs R. Bone quality assessment based on cone beam computed tomography imaging. Clin Oral Implants Res 2009; 20: 767–71. doi: https://doi.org/10.1111/j.1600-0501.2008.01677.x [DOI] [PubMed] [Google Scholar]
- 12.Taylor TT, Gans SI, Jones EM, Firestone AR, Johnston WM, Kim DG. Comparison of micro-CT and cone beam CT-based assessments for relative difference of grey level distribution in a human mandible. Dentomaxillofac Radiol 2013; 42: 25117764. [DOI] [PMC free article] [PubMed] [Google Scholar]
- 13.Viola P, Wells WM, 3rd. Alignment by maximization of mutual information. Int J Comput Vis 1997; 24: 137–54. [Google Scholar]
- 14.Shams R, Kennedy RA. Efficient histogram algorithms for NVIDIA CUDA compatible devices. Proceedings International Conference on Signal Processing and Communication Systems (ICSPCS) 2007: 418–22. [Google Scholar]
- 15.Mattes D, Haynor DR, Vesselle H, Lewellyn TK, Eubank W. Nonrigid multimodality image registration. Proc SPIE 2001; 4322: 1609–20. [Google Scholar]
- 16.Wells WM, 3rd, Viola P, Atsumi H, Nakajima S, Kikinis R. Multi-modal volume registration by maximization of mutual information. Med Image Anal 1996; 1: 35–51. [DOI] [PubMed] [Google Scholar]
- 17.Genant HK, Gordon C, Jiang Y, Link TM, Hans D, Majumdar S, et al. Advanced imaging of the macrostructure and microstructure of bone. Horm Res 2000; 54: 24–30. doi: https://doi.org/63444 [DOI] [PubMed] [Google Scholar]
- 18.Lespessailles E, Chappard C, Bonnet N, Benhamou CL. Imaging techniques for evaluating bone microarchitecture. Joint Bone Spine 2006; 3: 254–61. doi: https://doi.org/10.1016/j.jbspin.2005.12.002 [DOI] [PubMed] [Google Scholar]
- 19.Liu S, Zhang Z, Li J, Liu D, Ma X. A study of trabecular bone structure in the mandibular condyle of healthy young people by cone beam computed tomography. [In Chinese.] Zhonghua Kou Qiang Yi Xue Za Zhi 2007; 42: 357–60. [PubMed] [Google Scholar]


