Abstract
Objectives:
The aim of this study was to compare apparent diffusion coefficient (ADC) values from diffusion-weighted MRI (DWI) among normal salivary glands, cases with sialadenitis and cases with pleomorphic adenoma of major salivary glands.
Methods:
22 patients (totalling 44 major salivary glands) diagnosed with either unilateral sialadenitis (on either parotid or submandibular gland) or parotid gland pleomorphic adenoma were selected. Contralateral non-affected glands (normal) were also analyzed. DW images were achieved using a spin-echo pulse sequence with a 1.5-T MRI device. Mean ADC values were compared among the three groups analyzed (contralateral normal glands, sialadenitis and pleomorphic adenoma).
Results:
The mean ADC values were significantly higher in cases of parotid sialadenitis (p = 0.001), but not in cases of submandibular sialadenitis (p = 0.466), as compared with the contralateral non-affected glands. Cases of pleomorphic adenoma presented the highest ADC values of the study. In addition, one-way ANOVA test revealed a significant difference among the three groups of parotid glands analyzed.
Conclusions:
Within the limitations of this study, the present results suggest that DWI allows for differentiation between parotid sialadenitis and pleomorphic adenoma.
Keywords: MRI, diffusion-weighted imaging, salivary glands, pleomorphic adenoma
Introduction
Sialadenitis is a condition that represents inflammation of the acinoparenchyma of a salivary gland. It can result from various conditions such as obstruction of the salivary duct, trauma, infection (viral or bacterial) and systemic diseases, among others. The condition may be acute or chronical, leading to fibrosis of the glandular parenchyma in some situations.1
Clinically, recurrent acute sialadenitis, as a consequence of duct obstruction, may produce excessively thick saliva. In chronic salivary gland disorder, the symptoms are similar, but less intense: swelling of the affected gland is usually reported with less discomfort and overlying tenderness. Such symptoms may also be observed in neoplastic lesions of the salivary glands such as pleomorphic adenoma.1,2
The advent of MRI in dentistry has led to important advances in the field of oral diagnosis.3,4 MRI provides multiplanar imaging with satisfactory soft-tissue contrast using non-ionizing electromagnetic fields. One of the MRI modalities is diffusion-weighted imaging (DWI), which takes into account water motion at the molecular level, within voxels of a tissue.5
In general, lesions and tumours with high cellularity or cellular swelling tend to present lower apparent diffusion coefficients (ADCs). Accordingly, ADC values have been reported to be lower in malignant tumours, as compared with benign tumours,6–8 and inflammatory lesions.9
For alterations of the salivary glands, MRI might be decisive for the diagnosis and can also contribute to defining the stage of the disease.10,11 Sialadenitis is usually detected by MRI techniques,12 but its imaging presentation may mimic a salivary gland tumour.13 Furthermore, various salivary gland tumours may show similar characteristics on MRI.13 Among the evaluated image-based techniques, DWI seems to be promising at diagnosing tumours of the salivary glands,6,14,15 and even at classifying their histological subtypes.16,17 However, little is known on the use of DWI to diagnose and differentiate between reactive and neoplastic inflammatory lesions of major salivary glands. We hypothesized that ADC values from DWI would differ significantly between sialadenitis and pleomorphic adenoma.
Thus, the aim of this study was to compare ADC values from DWI among normal salivary glands, cases with sialadenitis and cases with pleomorphic adenoma.
Methods and materials
Subjects
Approval was obtained from the ethics committee of the university of this study (protocol number: 981.097). The guidelines of the Helsinki Declaration were followed in this investigation. All patients willing to participate in this study signed an informed consent form.
Inclusion and exclusion criteria
This study was performed on consecutive patients from a private dental clinic, between March 2012 and May 2013. All patients presented with a clinically suspected unilateral reactive inflammatory or neoplastic lesion of either the parotid or submandibular salivary gland. All diagnoses were defined as either sialadenitis (confirmed by punctate cytological analysis or histological analysis) or pleomorphic adenoma (confirmed by histological analysis).
Patients with MRI susceptibility or motion artefacts were excluded from the study. Insufficient clinical or imaging data were also considered as exclusion criteria.
MRI scans
All patients were scanned with an eight-channel head coil in a 1.5-T MRI scanner (OptimaMR360; GE Medical Systems, Milwaukee, WI). All scans were acquired using the coronal orientation with a field of view of 40 × 40 × 40 cm3 and a matrix of 160 × 160 pixels. Radiofrequency pulse and gradient modes were set to “fast”, with a phase resolution of 100%. DW images were achieved using a spin-echo (SE) pulse sequence with 260 pixel bandwidth, 6 averages, 6000-ms repetition time, 96-ms echo time, 9-mm slice thickness (intersection gap = 0 mm) and 17 slices, resulting in a total acquisition time of 24 min per scan. MRI data were retrieved from the digital imaging and communications in medicine files in the meta-data window of an open-source digital imaging and communications in medicine viewer (OsiriX 6.0; Pixmeo, Geneva, Switzerland) and recorded.
Apparent diffusion coefficient calculation
All ADC values were calculated using the same software (Func Tool; GE Medical Systems, Milwaukee, WI). Initially, regions of interest enclosing the area of the major salivary glands were defined. For the quantitative determination of the ADC, DW images with different gradient strengths (b-factor: 800, 1500 s/mm2) were recorded. ADC measurements were performed using the following equation:
where S0 refers to signal intensity on non-DW images; S1 refers to signal intensity on DW images; b0 refers to 0 mm2 s−1; and b1 varies from 1 to 1500 mm2 s−1. Since this method is entirely automated and reproducible, a single observer performed all calculations.
Statistical analyses
Sample size was determined to give the study a power of 80%, at a level of significance of 5%. Normality for ADC values was assessed using the Shapiro–Wilk test. Mean comparisons between salivary glands affected with sialadenitis and their contralateral non-affected glands were performed individually for parotid and submandibular cases using the Student's t-test. In addition, mean ADC values at parotid salivary glands of three groups (normal gland, sialadenitis and pleomorphic adenoma) of different patients were compared with one-way ANOVA test. To examine individual differences between groups, Tukey's post hoc test was utilized.
All statistical analyses were performed at a level of significance of 5%, using the IBM SPSS® Statistics 17 software (IBM Corp., New York, NY; formerly SPSS Inc., Chicago, IL).
Results
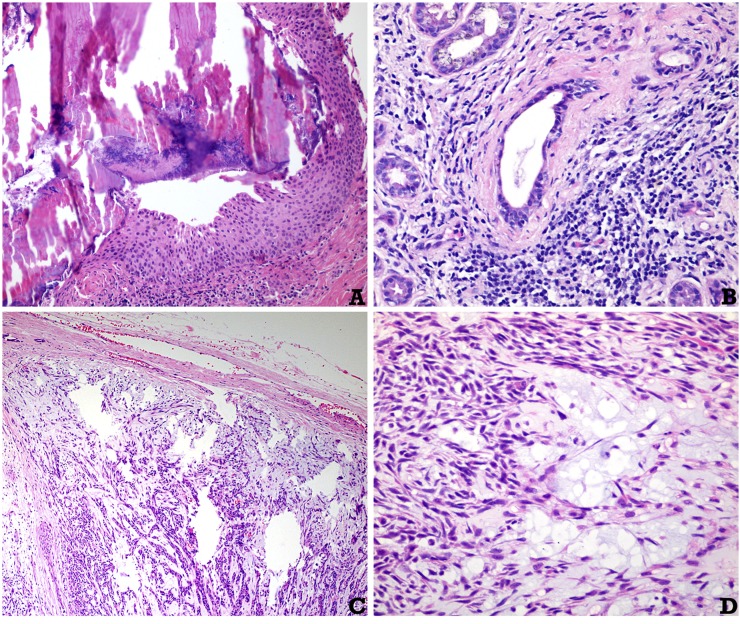
25 subjects were initially enrolled in the study. Three subjects were excluded owing to insufficient clinical/imaging data. As a result, 22 subjects were included in the study (16 females and 6 males; mean age of 41.32 ± 6.21 years), totalling 44 major salivary glands analyzed with DWI. From the 15 patients with sialadenitis, 7 of them presented sialadenitis on a parotid gland, and the other 8 presented sialadenitis on a submandibular gland. All lesions were unilateral. Histopathological confirmation was obtained in all cases analyzed. Histological examples of the conditions diagnosed are depicted in Figure 1.
Figure 1.
Histological aspects of representative cases: (a) obstruction of a salivary gland excretory duct due to a calcified calculus. The periductal inflammation can be noted (haematoxylin and eosin, original magnification × 150). (b) Chronic sialadenitis in a case of lupus erythematous (haematoxylin and eosin, original magnification × 200). (c, d) Pleomorphic adenoma of the parotid gland: in (c), a nodular neoplasm surrounded by a fibrous pseudocapsule can be noted. In (d), the neoplasm is composed of spindle myoepithelial cells, ductal structures and a myxoid amorphous material (haematoxylin and eosin, original magnification × 40 and × 400, respectively).
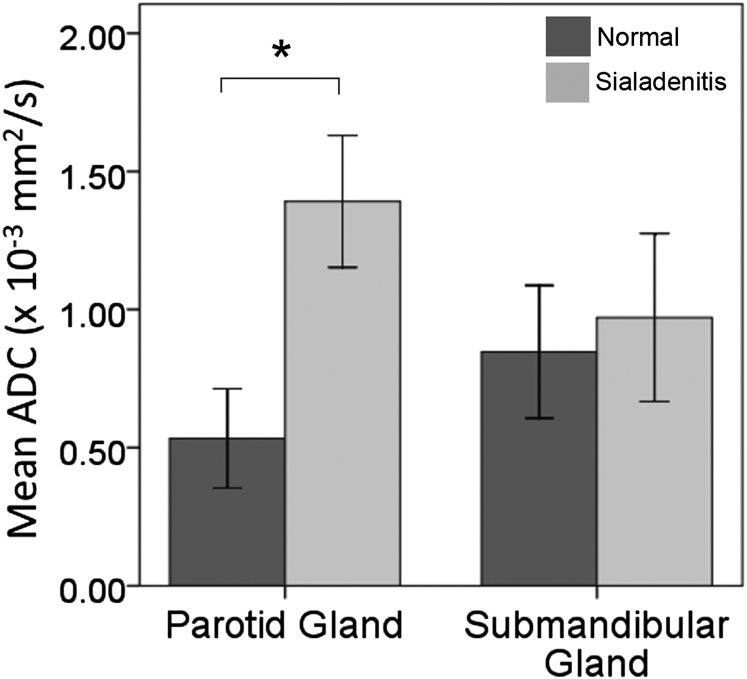
Normality of ADC values was confirmed (p > 0.05) for the three groups analyzed (contralateral non-affected glands, sialadenitis and pleomorphic adenoma). Mean ADC results are available in Table 1. A significant difference of ADC values was found between parotid sialadenitis and contralateral non-affected glands, according to the Student's t-test results (p = 0.001) (Figure 2). However, no significant difference was observed between the same groups for submandibular salivary glands (p = 0.466).
Table 1.
Mean apparent diffusion coefficient (ADC) results of the study
| Salivary gland | Group | Mean ADC value (×10−3 mm2 s−1) | p-value |
|---|---|---|---|
| Parotid | Normal | 0.53 ± 0.25 | 0.001a |
| Sialadenitis | 1.39 ± 0.26 | ||
| Pleomorphic adenoma | 1.91 ± 0.68 | ||
| Submandibular | Normal | 0.84 ± 0.10 | 0.466b |
| Sialadenitis | 0.97 ± 0.12 |
One-way ANOVA test. Bold value is indicating statistical significance (p < 0.05).
Student's t-test.
Figure 2.
Mean apparent diffusion coefficient (ADC) results for parotid and submandibular sialadenitis, in comparison with the contralateral normal glands of each patient; *p < 0.05, according to the Student's t-test.
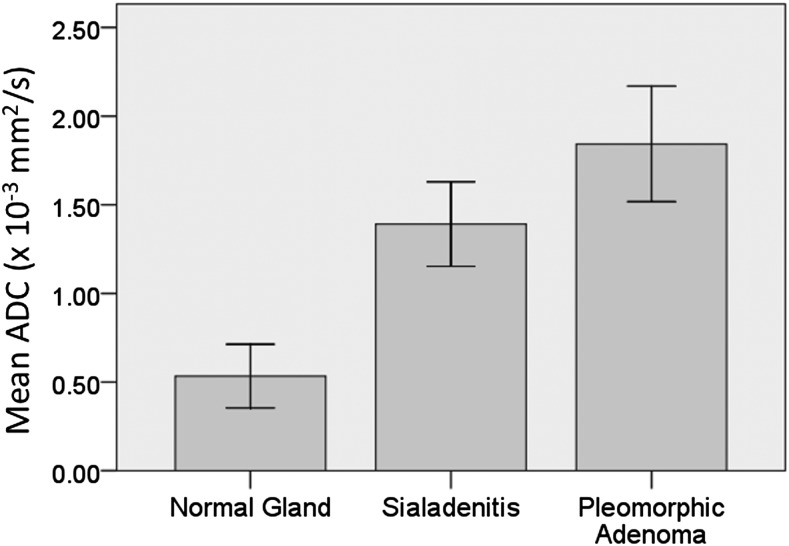
In addition, for the parotid glands, one-way ANOVA test revealed a significant difference among the three groups analyzed (p = 0.001; Figure 3). Tukey's post hoc test showed significant differences between non-affected glands and sialadenitis (p = 0.001) and between sialadenitis and pleomorphic adenoma (p = 0.020) (Figure 4).
Figure 3.
Mean apparent diffusion coefficient (ADC) results for parotid normal glands, sialadenitis and pleomorphic adenoma: there is a significant difference among the three groups, according to the one-way ANOVA test (p = 0.001).
Figure 4.
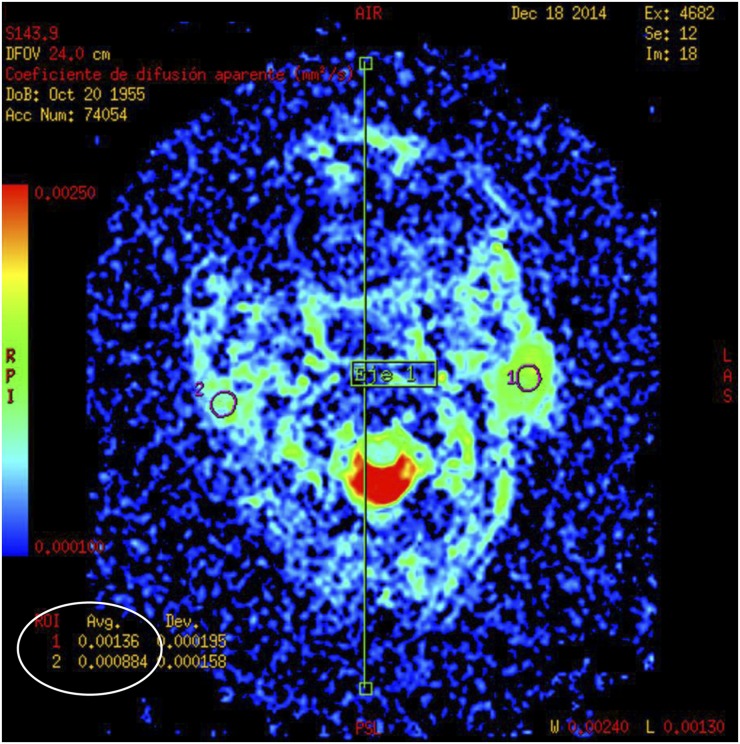
Diffusion-weighted MRI of a case of pleomorphic adenoma at the left parotid gland: mean apparent diffusion coefficient values were calculated for the selected regions of interest (ROIs) (circles).
Discussion
Imaging diagnosis of reactive inflammatory and neoplastic lesions of the major salivary glands can be challenging. In this context, MRI is a non-invasive method that may contribute to defining the diagnosis.11 Areas with increased T2 signal intensity have a high predictive value for the diagnosis of pleomorphic adenoma.18 In addition, DWI has been described as a useful tool to obtain additional information on the function of salivary glands19 and helps distinguish among different disorders.17,20,21 The latter finding is supported by the present study, since significant ADC differences were observed between different salivary gland lesions (p = 0.001).
Despite the above-mentioned usefulness of DWI, when used to assess parotid salivary glands, the technique is susceptible to transient signal loss, where ADC values may be overexpressed.22 As suggested in the aforementioned citation, in order to avoid such issues, we performed a higher number of averages (six experiments), as compared with similar studies.20,23
Little is known in the literature on the use of DWI to differentiate and diagnose inflammatory lesions. A previous study reported higher ADC values for lung inflammatory lesions, as compared with cancer. On the other hand, studies on oral tumours have reported even higher ADC values in cases of pleomorphic adenoma.6,23 The aforementioned findings are in agreement with the present study. On the other hand, different mean ADC values for pleomorphic adenoma have been reported in the literature. A study comparing with malignant tumours found a mean ADC of 2.09 ± 0.16 (×10−3 mm2 s−1) for cases of pleomorphic adenoma,6 whereas another study using DWI and dynamic contrast-enhanced MRI found a mean ADC of 1.42 ± 0.35,23 also contrasting with the mean ADC values observed herein (1.91 ± 0.68). The aforementioned difference may be due to different pulse sequence parameters used in the SE sequence. Further studies with larger sample sizes would be recommended to compare the diagnostic performance of different SE T2 weighted pulse sequences for screening pleomorphic adenoma of the salivary glands.
The present study also strove to assess differences between results for parotid and submandibular glands. According to our findings, ADC values are significantly higher in cases of parotid sialadenitis (p = 0.001), but not in cases of submandibular sialadenitis (p = 0.466), as compared with the contralateral non-affected glands. This finding is in agreement with a previous study concluding that DWI is more reliable to detect functional changes in parotid glands, as compared with submandibular ones.24 One of the possible reasons is that the submandibular duct commonly presents physiologic narrowing due to the mylohyoid muscle, which makes it difficult to distinguish between pathologic stenosis and physiologic narrowing.
One of the limitations of the present study is that no comparison between imaging observations from conventional MRI techniques and DWI could be performed. Future studies would be recommended to address the diagnostic performance of subjective evaluations of images from MRI and DWI for screening sialadenitis and pleomorphic adenoma.
A further limitation of this study is that no ADC comparisons could be performed among the different histological types of the pleomorphic adenoma cases of this study. On the other hand, previous studies have indicated that fast SE pulse sequences might allow for prediction of histologic classification of pleomorphic adenomas and other salivary gland tumours.16,17 Further studies with larger sample sizes would be recommended to compare ADC results among different histological types of pleomorphic adenoma using different MRI pulse sequences.
In conclusion, within the limitations of this study, the present results suggest that DWI allows for differentiation between reactive inflammatory and neoplastic lesions of the parotid salivary glands.
References
- 1.Wilson KF, Meier JD, Ward PD. Salivary gland disorders. Am Fam Physician 2014; 89: 882–8. [PubMed] [Google Scholar]
- 2.Delli K, Spijkervet FK, Vissink A. Salivary gland diseases: infections, sialolithiasis and mucoceles. Monogr Oral Sci 2014; 24: 135–48. doi: https://doi.org/10.1159/000358794 [DOI] [PubMed] [Google Scholar]
- 3.Cortes AR, Abdala-Junior R, Weber M, Arita ES, Ackerman JL. Influence of pulse sequence parameters at 1.5 T and 3.0 T on MRI artefacts produced by metal-ceramic restorations. Dentomaxillofac Radiol 2015; 44: 20150136. doi: https://doi.org/10.1259/dmfr.20150136 [DOI] [PMC free article] [PubMed] [Google Scholar]
- 4.Nagamatsu-Sakaguchi C, Maekawa K, Ono T, Yanagi Y, Minakuchi H, Miyawaki S, et al. Test-retest reliability of MRI-based disk position diagnosis of the temporomandibular joint. Clin Oral Investig 2012; 16: 101–8. doi: https://doi.org/10.1007/s00784-010-0476-9 [DOI] [PubMed] [Google Scholar]
- 5.Patterson DM, Padhani AR, Collins DJ. Technology insight: water diffusion MRI—a potential new biomarker of response to cancer therapy. Nat Clin Pract Oncol 2008; 5: 220–33. doi: https://doi.org/10.1038/ncponc1073 [DOI] [PubMed] [Google Scholar]
- 6.Habermann CR, Arndt C, Graessner J, Diestel L, Petersen KU, Reitmeier F, et al. Diffusion-weighted echo-planar MR imaging of primary parotid gland tumors: is a prediction of different histologic subtypes possible? AJNR Am J Neuroradiol 2009; 30: 591–6. doi: https://doi.org/10.3174/ajnr.A1412 [DOI] [PMC free article] [PubMed] [Google Scholar]
- 7.Matsushima N, Maeda M, Takamura M, Takeda K. Apparent diffusion coefficients of benign and malignant salivary gland tumors. Comparison to histopathological findings. J Neuroradiol 2007; 34: 183–9. doi: https://doi.org/10.1016/j.neurad.2007.04.002 [DOI] [PubMed] [Google Scholar]
- 8.Yuan Y, Tang W, Jiang M, Tao X. Palatal lesions: discriminative value of conventional MRI and diffusion weighted imaging. Br J Radiol 2016; 89: 20150911. doi: https://doi.org/10.1259/bjr.20150911 [DOI] [PMC free article] [PubMed] [Google Scholar]
- 9.Deng Y, Li X, Lei Y, Liang C, Liu Z. Use of diffusion-weighted magnetic resonance imaging to distinguish between lung cancer and focal inflammatory lesions: a comparison of intravoxel incoherent motion derived parameters and apparent diffusion coefficient. Acta Radiol 2015. [DOI] [PubMed] [Google Scholar]
- 10.Aghaghazvini L, Salahshour F, Yazdani N, Sharifian H, Kooraki S, Pakravan M, et al. Dynamic contrast-enhanced MRI for differentiation of major salivary glands neoplasms, a 3-T MRI study. Dentomaxillofac Radiol 2015; 44: 20140166. doi: https://doi.org/10.1259/dmfr.20140166 [DOI] [PMC free article] [PubMed] [Google Scholar]
- 11.Tanaka T, Ono K, Habu M, Inoue H, Tominaga K, Okabe S, et al. Functional evaluations of the parotid and submandibular glands using dynamic magnetic resonance sialography. Dentomaxillofac Radiol 2007; 36: 218–23. doi: https://doi.org/10.1259/dmfr/27496576 [DOI] [PubMed] [Google Scholar]
- 12.Kalinowski M, Heverhagen JT, Rehberg E, Klose KJ, Wagner HJ. Comparative study of MR sialography and digital subtraction sialography for benign salivary gland disorders. AJNR Am J Neuroradiol 2002; 23: 1485–92. [PMC free article] [PubMed] [Google Scholar]
- 13.Lee YY, Wong KT, King AD, Ahuja AT. Imaging of salivary gland tumours. Eur J Radiol 2008; 66: 419–36. doi: https://doi.org/10.1016/j.ejrad.2008.01.027 [DOI] [PubMed] [Google Scholar]
- 14.Assili S, Fathi Kazerooni A, Aghaghazvini L, Saligheh Rad HR, Pirayesh Islamian J. Dynamic contrast magnetic resonance imaging (DCE-MRI) and diffusion weighted MR imaging (DWI) for differentiation between benign and malignant salivary gland tumors. J Biomed Phys Eng 2015; 5: 157–68. [PMC free article] [PubMed] [Google Scholar]
- 15.Li S, Cheng J, Zhang Y, Zhang Z. Differentiation of benign and malignant lesions of the tongue by using diffusion-weighted MRI at 3.0 T. Dentomaxillofac Radiol 2015; 44: 20140325. doi: https://doi.org/10.1259/dmfr.20140325 [DOI] [PMC free article] [PubMed] [Google Scholar]
- 16.Eida S, Sumi M, Sakihama N, Takahashi H, Nakamura T. Apparent diffusion coefficient mapping of salivary gland tumors: prediction of the benignancy and malignancy. AJNR Am J Neuroradiol 2007; 28: 116–21. [PMC free article] [PubMed] [Google Scholar]
- 17.Yoshino N, Yamada I, Ohbayashi N, Honda E, Ida M, Kurabayashi T, et al. Salivary glands and lesions: evaluation of apparent diffusion coefficients with split-echo diffusion-weighted MR imaging—initial results. Radiology 2001; 221: 837–42. doi: https://doi.org/10.1148/radiol.2213010131 [DOI] [PubMed] [Google Scholar]
- 18.Kinoshita T, Ishii K, Naganuma H, Okitsu T. MR imaging findings of parotid tumors with pathologic diagnostic clues: a pictorial essay. Clin Imaging 2004; 28: 93–101. doi: https://doi.org/10.1016/S0899-7071(03)00120-7 [DOI] [PubMed] [Google Scholar]
- 19.Zhang Y, Ou D, Gu Y, He X, Peng W, Mao J, et al. Diffusion-weighted MR imaging of salivary glands with gustatory stimulation: comparison before and after radiotherapy. Acta Radiol 2013; 54: 928–33. doi: https://doi.org/10.1177/0284185113491089 [DOI] [PubMed] [Google Scholar]
- 20.Kato H, Kanematsu M, Goto H, Mizuta K, Aoki M, Kuze B, et al. Mucosa-associated lymphoid tissue lymphoma of the salivary glands: MR imaging findings including diffusion-weighted imaging. Eur J Radiol 2012; 81: e612–7. doi: https://doi.org/10.1016/j.ejrad.2011.12.035 [DOI] [PubMed] [Google Scholar]
- 21.Yerli H, Aydin E, Haberal N, Harman A, Kaskati T, Alibek S. Diagnosing common parotid tumours with magnetic resonance imaging including diffusion-weighted imaging vs fine-needle aspiration cytology: a comparative study. Dentomaxillofac Radiol 2010; 39: 349–55. doi: https://doi.org/10.1259/dmfr/15047967 [DOI] [PMC free article] [PubMed] [Google Scholar]
- 22.Liu YJ, Lee YH, Chang HC, Huang TY, Chiu HC, Wang CW, et al. A potential risk of overestimating apparent diffusion coefficient in parotid glands. PLoS One 2015; 10: e0124118. doi: https://doi.org/10.1371/journal.pone.0124118 [DOI] [PMC free article] [PubMed] [Google Scholar]
- 23.Kitamoto E, Chikui T, Kawano S, Ohga M, Kobayashi K, Matsuo Y, et al. The application of dynamic contrast-enhanced MRI and diffusion-weighted MRI in patients with maxillofacial tumors. Acad Radiol 2015; 22: 210–16. doi: https://doi.org/10.1016/j.acra.2014.08.016 [DOI] [PubMed] [Google Scholar]
- 24.Thoeny HC, De Keyzer F, Claus FG, Sunaert S, Hermans R. Gustatory stimulation changes the apparent diffusion coefficient of salivary glands: initial experience. Radiology 2005; 235: 629–34. doi: https://doi.org/10.1148/radiol.2352040127 [DOI] [PubMed] [Google Scholar]


