

Abstract
Internationally, ovarian cancer is the 7th leading cancer diagnosis and 8th leading cause of cancer mortality among women. Ovarian cancer incidence varies by region, particularly when comparing high versus low income countries. Temporal changes in reproductive factors coupled with shifts in diagnostic criteria may have influenced incidence trends of ovarian cancer and relative rates by histologic subtype. Accordingly, we evaluated trends in ovarian cancer incidence overall (1973–1977 to 2003–2007) and by histologic subtype (1988–1992 to 2003–2007) using volumes IV-IX of the Cancer Incidence in Five Continents database (CI5plus) and CI5X (volume X) database. Annual percent changes were calculated for ovarian cancer incidence trends, and rates of histologic subtypes for individual countries were compared to overall international incidence. Ovarian cancer incidence rates were stable across regions, although there were notable increases in Eastern/Southern Europe (e.g. Poland: Annual Percent Change (APC) 1.6%, p=0.02) and Asia (e.g. Japan: APC 1.7%, p=0.01) and decreases in Northern Europe (e.g. Denmark: APC −0.7%, p=0.01) and North America (e.g. US Whites: APC −0.9%, p<0.01). Relative proportions of histologic subtypes were similar across countries, except for Asian nations, where clear cell and endometrioid carcinomas comprised a higher proportion of the rate and serous carcinomas comprised a lower proportion of the rate than the worldwide distribution. Geographic variation in temporal trends of ovarian cancer incidence and differences in the distribution of histologic subtype may be partially explained by reproductive and genetic factors. Thus, histology-specific ovarian cancer should continue to be monitored to further understand the etiology of this neoplasm.
Keywords: ovarian cancer, incidence trends, international, histologic subtype
INTRODUCTION
Ovarian cancer was the 7th most frequent cancer diagnosis worldwide, with 238,700 new cases in 2012, and the 8th leading cause of cancer mortality, with 151,900 deaths1. Among all gynecological cancers, ovarian cancer is associated with the worst prognosis and highest mortality rate1–4. Incidence and mortality rates of ovarian cancer vary markedly geographically, particularly according to level of development. Regions reporting the highest incidence rates of ovarian cancer, including North America and Europe, may be linked to higher prevalence of several established risk factors including nulliparity/low parity, menopausal hormone therapy use, and familial predisposition5 and lower prevalence of a strong protective factor, oral contraceptive use6.
Evidence regarding risk factors, treatment response, and prognosis has demonstrated differences by subtype7–9. Approximately ninety percent of all ovarian cancers are epithelial tumors, which include serous, mucinous, endometrioid, clear cell, transitional cell, squamous cell, mixed epithelial, undifferentiated, and unclassified tumors10–12. Among epithelial ovarian cancers, serous tumors are the most common subtype. The remaining, non-epithelial tumors include sex cord-stromal and germ cell tumors.
Shifts in diagnostic criteria for ovarian cancer as well as temporal changes in the prevalence of modifiable reproductive factors may influence the incidence of ovarian cancer as well as the distribution of histologic subtype within populations13–16. However, international incidence rates of ovarian cancer have not been recently analyzed. Two prior studies have reported on international patterns of ovarian cancer incidence, suggesting variation in rates overall and by histologic subtype17, 18. However, only one study evaluated incidence by histologic subtype18, and the other study limited predictive analysis to only a select number of countries17.
In the present analysis, we summarize international trends in the incidence of ovarian cancer and provide estimates of ovarian cancer incidence by histologic subtype and geographic region utilizing data from high quality population-based cancer registries included in successive volumes of Cancer Incidence in Five Continents (CI5).
MATERIALS AND METHODS
Data were extracted from IARC’s CI5plus19 and the most recent published (Volume X, CI5-X) database20, available online. Briefly, the CI5 series is a compendium of high quality incidence data collected in 5-year periods over ten volumes beginning in the 1960s. The data compiled includes summary information on new cancer cases by registry, ethnicity, cancer site, histology (where possible), sex, and 5-year age group, together with corresponding population data. Data were extracted from the CI5plus database, including information for Volume 4 (1973–1977), Volume 5 (1978–1982), Volume 6 (1983–1987), Volume 7 (1988–1992), Volume 8 (1993–1997), Volume 9 (1998–2002), and Volume 10 (2003–2007). Incidence data for diagnoses 2003–2007 were also extracted from the CI5-X electronic database since the number of countries with histology data included for 2003–2007 in the CI5plus database was limited. Registries were included if there was at least fifteen years of consecutive data, and the percent unspecified for histologic subtype was less than 15% in CI5-X. Additionally, data from one or more regional registries were combined to provide an estimate of national incidence rates. Lastly, if a country did not have data for all five years per volume, that volume was excluded.
International trends in ovarian cancer were calculated for each five-year volume from 1973–1977 through 2003–2007 for registries available in the CI5plus database by country. Incidence rates (per 100,000 woman-years) were calculated and age-adjusted to the world standard population utilizing five year age groups 0–4 to 70–7421, 22. Data from ages 80–84 and 85 and older were excluded because the rates were imprecise due to very small case numbers in these age groups. Trends in the incidence of ovarian cancer were then plotted on a semi-log scale for comparisons by region (Northern Europe, Western Europe, Eastern/Southern Europe, the Americas, and Asia/Oceania)23. Trends were also calculated by histologic subtype from 1988–1992 through 2003–2007 for select countries within each region based on the largest number of overall ovarian cancers and availability of histology data. For histology analyses, data for earlier volumes were not utilized because of instability due to limited sample size. To assess the change in age-adjusted rates by country over time, the annual percent change (APC) was calculated across volumes for each five-year period using linear regression of the natural-log transformed rates per five-year period. The APCs were then plotted against the most recent (2003–2007) incidence rate.
Age-standardized incidence rates of ovarian cancer by histologic subtype and country were tabulated using the CI5-X data. Histologic subtypes included serous carcinomas, mucinous carcinomas, endometrioid carcinomas, clear cell carcinomas, other epithelial carcinomas (adenocarcinoma, and other/unspecified carcinomas) as well as sex cord-stromal tumors, germ cell tumors, other morphology and unspecified morphology. The proportion of each epithelial subtype relative to the total incidence of epithelial ovarian cancers was then summarized graphically on a bar graph to determine subtype variation for each country relative to the international distribution of epithelial cancers. Finally, to evaluate the international age distribution of ovarian cancer by histologic subtype, age-specific incidence rates were calculated using five-year age groups and were plotted by subtype on a semi-log scale.
Data management and analyses were completed utilizing Stata (Stata Corp 2015. Stata statistical software: Release 14. College Station TX, US: Statacorp LP) and figures were plotted using SigmaPlot (v.12.5, SY Software Inc., San Jose, CA, US).
RESULTS
International incidence of ovarian cancer and temporal trends
In the most recent 5-year period (2003–2007), the incidence of ovarian cancer was highest in Eastern/Southern Europe, followed by Northern Europe, and Western Europe (Fig. 1, Supplemental Table 1). More specifically, the highest rate of ovarian cancer was seen in Latvia (14.3 per 100,000 woman-years), followed by the United Kingdom (UK) (12.5), and the Czech Republic (12.3). Intermediate rates of ovarian cancer were observed in North and South America, while the lowest rates were seen in Asia/Oceania. The lowest rate of ovarian cancer was found in Thailand (5.7).
Figure 1.
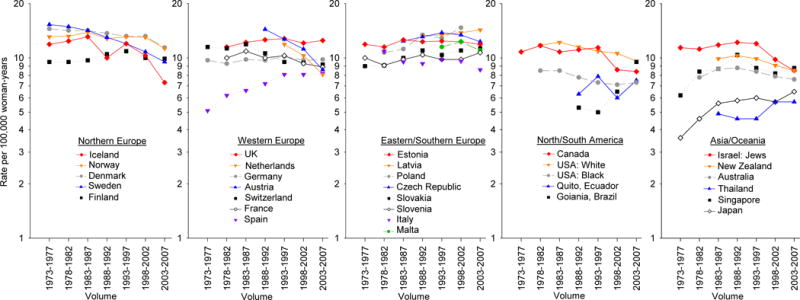
Trends in age-adjusted ovarian cancer incidence rates per 100,000 woman-years by continent and country from 1973–1977 through 2003–2007, Cancer Incidence in Five Continents (CI5) volume IV–X
In most countries, rates remained relatively stable over time (Fig. 1, Supplemental Table 1). Incidence rates appeared to decrease from high to intermediate rates in the Northern European region, with declines observed in Denmark (APC=−0.7, 95% CI −1.1, −0.3) from 14.5 in 1973–1977 to 11.4 in 2003–2007 and Sweden (APC=−1.5, 95% CI −1.9, −1.2) from 15.3 in 1977–1973 to 9.5 in 2003–2007.
By contrast, rates in Eastern/Southern Europe appeared to be steadily increasing over time; there was a significant increase in Poland (APC=1.6, 95% CI 0.6, 2.7) from 10.7 in 1978–1982 to 14.7 in 1998–2002, and in Slovakia, with rates increasing (APC=0.8, 95% CI 0.4, 1.2) from 9.0 to 11.3 over time. In Western Europe, temporal patterns of rates varied, with notable rises in ovarian cancer incidence in Spain (APC=1.6, 95% CI 1.0, 2.3) from 6.2 in 1978–1982 to 8.2 in 2003–2007, contrasting with the substantial declines in Austria (APC=−3.1, 95% CI −4.7, −1.3) from 14.4 in 1988–1992 to 8.6 in 2003–2007.
With respect to North America, ovarian cancer incidence gradually decreased in the United States (US) among both whites and blacks (APC=−0.9, 95% CI −1.3, −0.4 and −0.7, 95% CI −1.2, −0.3, respectively) from 11.8 to 9.6 for whites and 8.5 to 7.3 among blacks over time. In Canada, the incidence of ovarian cancer was stable from 1973–1977 through 1993–1997, and decreased to 8.4 in 2003–2007 (APC −0.9, 95% CI −1.8, 0.0). Rates have been consistently increasing in South America, beginning in 1993 in Brazil, with rates of 5.0 in 1993–1997 rising to 9.5 in 2003–2007 (APC 4.4, 95% CI −2.1, 13.3); rates were however inconsistent in Ecuador, remaining around 6–7 over time.
Lastly, in Asia/Oceania, where countries generally had low incidence rates ranging from 5.7–8.5 in 2003–2007, an increase was seen in Japan (APC=1.7, 95% CI 0.6, 2.9) from 3.6 to 6.5, while rates were relatively stable in Thailand, Singapore and Australia. Rates of ovarian cancer in Israel were stable from 1973–1977 through 1993–1997, and then decreased to 8.5 in recent years, while incidence in New Zealand remained relatively stable throughout the years studied.
Globally, ovarian cancer incidence rates have remained relatively static over the past 35 years (1973–2007) (Fig. 2, Supplemental Table 1). The incidence rates in only 5 out of 30 countries evaluated were increasing 0.5–1.7% per year. Of note, incidence rates were highest in Poland and Latvia where significant increases in the rate over time were also noted. While incidence rates in 6 countries decreased significantly over time.
Figure 2.
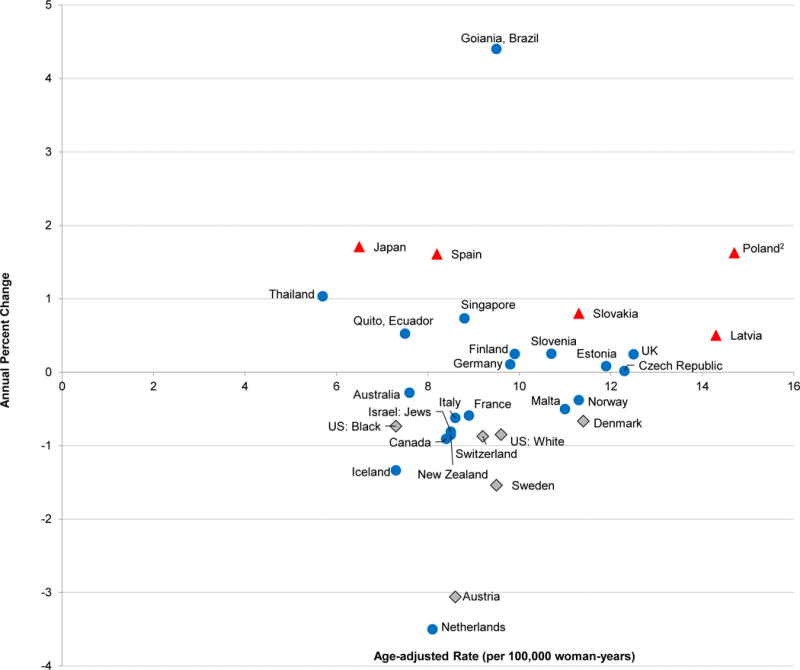
Annual Percent Change (APC) in age-adjusted ovarian cancer incidence rates from 1973–1977 through 2003–2007 by the age-adjusted rate in 2003–2007, Cancer Incidence in Five Continents (CI5)1
1Triangles represent populations in which the APC increased significantly (p<0.05), circles represent populations in which the APC increase or decrease was not statistically significant (p≥0.05), and the diamonds represent populations in which the APC decreased significantly across the time periods evaluated (p<0.05).
2Age-adjusted rate in 1998–2002
International incidence and temporal trends of ovarian cancer by histologic subtype
Serous carcinomas consistently had the highest incidence rate of all histologic subtypes in all countries assessed (Table 1, Fig. 3). In Europe and North America, following “other” epithelial carcinomas, the third and fourth most common subtype tended to alternate between endometrioid carcinomas and mucinous carcinomas. Notably the incidence of clear cell carcinomas was higher in Asian countries relative to other regions, with rates of 1.5 in Singapore, 1.0 in Japan compared with rates less than or equal to 0.6 in Europe and North America. With respect to non-epithelial ovarian cancer (germ cell and sex cord-stromal tumors), the incidence rates for all countries were much lower than the epithelial cancers.
Table 1.
Age-adjusted ovarian cancer incidence rates per 100,000 woman-years by histologic subtype and country, Cancer Incidence in Five Continents (CI5) volume X, 2003–20071
| Serous | Mucinous | Endometrioid | Clear cell | Other epithelial | Non-epithelial | Other | ||||||||
|---|---|---|---|---|---|---|---|---|---|---|---|---|---|---|
|
| ||||||||||||||
| Region | Cases | Rate (95% CI) | Cases | Rate (95% CI) | Cases | Rate (95% CI) | Cases | Rate (95% CI) | Cases | Rate (95% CI) | Cases | Rate (95% CI) | Cases | Rate (95% CI) |
| Northern Europe1 | ||||||||||||||
| Denmark | 1260 | 5.7 (5.4, 6.1) | 213 | 1.0 (0.9, 1.2) | 250 | 1.2 (1.1, 1.4) | 106 | 0.5 (0.4, 0.6) | 340 | 1.5 (1.3, 1.7) | 49 | 0.4 (0.3, 0.5) | 74 | 0.3 (0.3, 0.4) |
| Norway | 883 | 5.3 (4.9, 5.7) | 117 | 0.8 (0.6, 0.9) | 175 | 1.1 (0.9, 1.3) | 82 | 0.5 (0.4, 0.6) | 346 | 2.0 (1.8, 2.2) | 75 | 0.6 (0.5, 0.8) | 45 | 0.2 (0.2, 0.3) |
| Finland | 985 | 4.4 (4.1, 4.7) | 245 | 1.3 (1.1, 1.5) | 333 | 1.5 (1.3, 1.7) | 114 | 0.5 (0.4, 0.7) | 144 | 0.6 (0.5, 0.8) | 43 | 0.3 (0.2, 0.5) | 44 | 0.2 (0.1, 0.3) |
| Iceland | 39 | 4.1 (2.9, 5.6) | * | – | * | – | * | – | * | – | * | – | * | – |
| Western Europe | ||||||||||||||
| Austria | 175 | 4.3 (3.6, 5.0) | 33 | 0.8 (0.6, 1.2) | 35 | 0.8 (0.6, 1.2) | * | – | 72 | 1.6 (1.2, 2.1) | * | – | * | – |
| Switzerland | 388 | 4.2 (3.8, 4.6) | 48 | 0.5 (0.4, 0.7) | 83 | 0.9 (0.7, 1.2) | 30 | 0.4 (0.2, 0.5) | 185 | 1.8 (1.6, 2.1) | 26 | 0.5 (0.3, 0.7) | 27 | 0.3 (0.2, 0.4) |
| France | 964 | 4.1 (3.9, 4.4) | 156 | 0.7 (0.6, 0.8) | 199 | 0.9 (0.8, 1.0) | 60 | 0.3 (0.2, 0.3) | 412 | 1.7 (1.5, 1.9) | 96 | 0.6 (0.5, 0.8) | 40 | 0.1 (0.1, 0.2) |
| Germany | 191 | 4.0 (3.5, 4.7) | 41 | 1.1 (0.8, 1.6) | 43 | 0.9 (0.6, 1.2) | * | – | 133 | 2.6 (2.1, 3.2) | * | – | 15 | 0.3 (0.1, 0.5) |
| UK | 5980 | 3.7 (3.6, 3.8) | 2895 | 2.1 (2.0, 2.2) | 1499 | 1.0 (0.9, 1.0) | 924 | 0.6 (0.6, 0.7) | 5155 | 3.1 (3.0, 3.2) | 468 | 0.4 (0.4, 0.5) | 537 | 0.3 (0.3, 0.4) |
| Netherlands | 2138 | 3.4 (3.3, 3.6) | 486 | 0.8 (0.8, 0.9) | 520 | 0.9 (0.8, 0.9) | 282 | 0.5 (0.4, 0.5) | 1061 | 1.6 (1.5, 1.7) | 179 | 0.4 (0.4, 0.5) | 143 | 0.2 (0.2, 0.3) |
| Spain | 506 | 3.0 (2.8, 3.3) | 140 | 0.9 (0.7, 1.0) | 162 | 1.0 (0.9, 1.2) | 84 | 0.5 (0.4, 0.6) | 271 | 1.5 (1.3, 1.7) | 48 | 0.4 (0.3, 0.5) | 26 | 0.2 (0.1, 0.3) |
| Eastern/Southern Europe2 | ||||||||||||||
| Estonia | 344 | 5.8 (5.2, 6.5) | 72 | 1.4 (1.0, 1.7) | 30 | 0.6 (0.4, 0.8) | 21 | 0.4 (0.2, 0.6) | 102 | 1.4 (1.1, 1.8) | 35 | 0.8 (0.6, 1.2) | * | – |
| Slovenia | 420 | 5.2 (4.7, 5.7) | 63 | 0.8 (0.6, 1.1) | 123 | 1.6 (1.3, 1.9) | 40 | 0.5 (0.3, 0.7) | 112 | 1.2 (1.0, 1.5) | 21 | 0.4 (0.2, 0.7) | 16 | 0.2 (0.1, 0.4) |
| Czech Republic | 1797 | 4.4 (4.1, 4.6) | 425 | 1.0 (0.9, 1.2) | 519 | 1.3 (1.2, 1.4) | 90 | 0.2 (0.2, 0.3) | 1391 | 3.3 (3.1, 3.5) | 220 | 0.7 (0.6, 0.8) | 81 | 0.2 (0.1, 0.2) |
| Slovakia | 822 | 4.2 (3.9, 4.5) | 245 | 1.3 (1.1, 1.5) | 229 | 1.2 (1.1, 1.4) | 70 | 0.4 (0.3, 0.5) | 437 | 2.2 (2.0, 2.4) | 107 | 0.7 (0.6, 0.9) | 30 | 0.2 (0.1, 0.2) |
| Italy | 881 | 3.1 (2.9, 3.3) | 184 | 0.7 (0.6, 0.8) | 251 | 1.0 (0.8, 1.1) | 78 | 0.3 (0.2, 0.4) | 582 | 1.9 (1.7, 2.0) | 59 | 0.4 (0.3, 0.6) | 59 | 0.2 (0.1, 0.3) |
| Malta | 49 | 3.0 (2.2, 4.1) | 17 | 1.3 (0.7, 2.2) | 29 | 2.0 (1.3, 2.9) | * | – | 41 | 2.5 (1.7, 3.5) | * | – | * | – |
| North/South America | ||||||||||||||
| US: White | 3119 | 4.2 (4.1, 4.4) | 345 | 0.5 (0.5, 0.6) | 741 | 1.0 (1.0, 1.1) | 364 | 0.5 (0.5, 0.6) | 1411 | 1.8 (1.7, 1.9) | 257 | 0.5 (0.4, 0.6) | 201 | 0.3 (0.2, 0.3) |
| US: Black | 260 | 2.7 (2.4, 3.0) | 45 | 0.4 (0.3, 0.6) | 35 | 0.3 (0.2, 0.5) | 17 | 0.2 (0.1, 0.3) | 195 | 2.0 (1.8, 2.4) | 62 | 0.6 (0.5, 0.8) | 26 | 0.2 (0.2, 0.4) |
| Canada | 360 | 3.1 (2.8, 3.5) | 70 | 0.7 (0.5, 0.8) | 94 | 0.9 (0.7, 1.1) | 61 | 0.6 (0.4, 0.7) | 209 | 1.7 (1.5, 2.0) | 26 | 0.4 (0.2, 0.5) | 33 | 0.3 (0.2, 0.4) |
| Quito, Ecuador | 78 | 2.2 (1.7, 2.8) | 23 | 0.7 (0.4, 1.0) | 14 | 0.4 (0.2, 0.7) | * | – | 73 | 2.2 (1.7, 2.7) | 31 | 0.8 (0.5, 1.1) | * | – |
| Goiania, Brazil | 54 | 2.0 (1.5, 2.6) | 34 | 1.2 (0.8, 1.7) | 11 | 0.4 (0.2, 0.7) | * | – | 107 | 4.1 (3.4, 5.0) | 19 | 0.6 (0.3, 0.9) | * | – |
| Asia/Oceania | ||||||||||||||
| Israel: Jews | 767 | 4.6 (4.3, 5.0) | 44 | 0.3 (0.2, 0.4) | 105 | 0.7 (0.6, 0.8) | 26 | 0.2 (0.1, 0.3) | 280 | 1.5 (1.3, 1.7) | 43 | 0.3 (0.2, 0.5) | 15 | 0.1 (0.0, 0.1) |
| New Zealand | 482 | 3.5 (3.2, 3.8) | 78 | 0.6 (0.5, 0.8) | 94 | 0.7 (0.6, 0.9) | 70 | 0.5 (0.4, 0.7) | 196 | 1.3 (1.1, 1.5) | 55 | 0.5 (0.4, 0.7) | 42 | 0.3 (0.2, 0.4) |
| Australia | 2371 | 3.4 (3.3, 3.6) | 354 | 0.5 (0.5, 0.6) | 445 | 0.7 (0.6, 0.7) | 294 | 0.4 (0.4, 0.5) | 810 | 1.1 (1.0, 1.2) | 232 | 0.5 (0.4, 0.5) | 205 | 0.3 (0.2, 0.3) |
| Singapore | 279 | 2.5 (2.2, 2.8) | 105 | 1.0 (0.8, 1.2) | 150 | 1.3 (1.1, 1.5) | 171 | 1.5 (1.3, 1.7) | 108 | 1.0 (0.8, 1.2) | 66 | 0.9 (0.7, 1.1) | 22 | 0.2 (0.1, 0.3) |
| Japan | 728 | 1.4 (1.3, 1.5) | 385 | 0.8 (0.7, 0.9) | 293 | 0.7 (0.6, 0.7) | 469 | 1.0 (0.9, 1.1) | 612 | 1.1 (1.0, 1.2) | 126 | 0.5 (0.4, 0.6) | 55 | 0.1 (0.1, 0.1) |
| Thailand | 131 | 1.3 (1.1, 1.5) | 90 | 0.9 (0.7, 1.1) | 80 | 0.8 (0.6, 1.0) | 83 | 0.8 (0.6, 1.0) | 67 | 0.6 (0.5, 0.8) | 46 | 0.6 (0.4, 0.8) | * | – |
Note: Ordered by region and highest to lowest serous carcinoma incidence rate in 2003–2007. When the case count was less than 11, cases were marked (*) and rates were not calculated.
Sweden was excluded due to lack of data on histologic subtype.
Poland and Latvia were excluded due to lack of complete 5-year data in 2003–2007.
Figure 3.
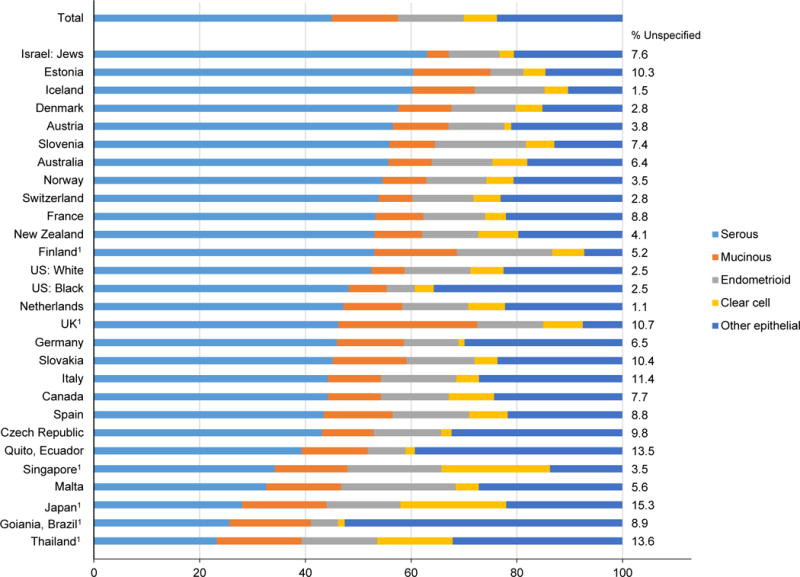
Proportion of the total epithelial ovarian cancer incidence rate by histologic subtype, Cancer Incidence in Five Continents (CI5) volume X, 2003–2007
1p<0.05, indicates that the proportion of the incidence rate contributed by the histologic subtype is statistically different from the corresponding international proportion (45% serous, 13% mucinous, 13% endometrioid, 6% clear cell, 24% other epithelial). Brazil 26% serous, 15% mucinous, 5% endometrioid, 1% clear cell and 53% other epithelial. Singapore 34% serous, 14% mucinous, 18% endometrioid, 21% clear cell and 14% other epithelial. Japan 28% serous, 16% mucinous, 14% endometrioid, 20% clear cell and 22% other epithelial. Thailand 23% serous, 16% mucinous, 14% endometrioid, 14% clear cell and 32% other epithelial. UK 46% serous, 26% mucinous, 13% endometrioid, 8% clear cell, 8% other epithelial. Finland 53% serous, 16% mucinous, 18% endometrioid, 6% clear cell, 7% other epithelial.
Figure 3 depicts the incidence rates of epithelial ovarian cancer subtypes expressed as proportions of the total epithelial cancer rate. Internationally, of the total incidence rate of epithelial ovarian cancers, 45% were serous carcinomas, followed by mucinous carcinomas (13%), endometrioid carcinomas (13%), “other” epithelial carcinomas (24%) and clear cell carcinomas (6%). Though the proportion of each subtype does vary by country, there were a few countries for which there was a statistically significant difference in the proportion of epithelial subtypes as compared to the international distribution.
The most substantial deviation was seen in the Asia/Oceania region, with Singapore, Japan, and Thailand having a smaller proportion of serous carcinomas, and larger proportions of endometrioid, clear cell, and mucinous carcinomas. By contrast, Israel appeared to have a much higher proportion of serous carcinomas and a lower proportion of clear cell carcinomas, albeit the association was of borderline statistical significance (p=0.051). Brazil also differed from the international distribution of epithelial subtypes, with a lower proportion of serous carcinomas and a higher proportion of “other” epithelial subtypes and mucinous carcinomas. In the UK, there was a higher proportion of mucinous carcinomas and a lower proportion of “other” epithelial subtypes as compared to the international distribution. In Finland, higher proportions of serous, mucinous and endometrioid carcinomas was supplemented with a lower proportion of “other” epithelial subtypes.
Among selected countries, there was notable temporal variation in histologic subtype (Figure 4). In Denmark and the UK, increases were seen from 1988–1992 to 2003–2007 in serous carcinomas (APC 0.9, 95% CI 0.3, 1.5 and 4.1, 95% CI 0.3, 8.6, respectively), while rates of “other” epithelial subtypes declined over time (APC −4.5, 95% CI −7.8, −0.3 and −2.7, 95% CI −3.0, −2.5, respectively). Decreases in “other” epithelial subtypes were also observed among whites in the United States (APC −2.9, 95% CI −6.4, 0.4). In Japan there has been a striking increase from 1988–1992 to 2003–2007 in the rate of endometrioid carcinomas (APC 10.0, 95% CI 5.6, 15.1) in addition to an increase in clear cell carcinomas (APC 7.8, 95% CI 0.1, 19.0). Rates by histologic subtype remained stable over the years in Italy as well as among Israeli Jews.
Figure 4.
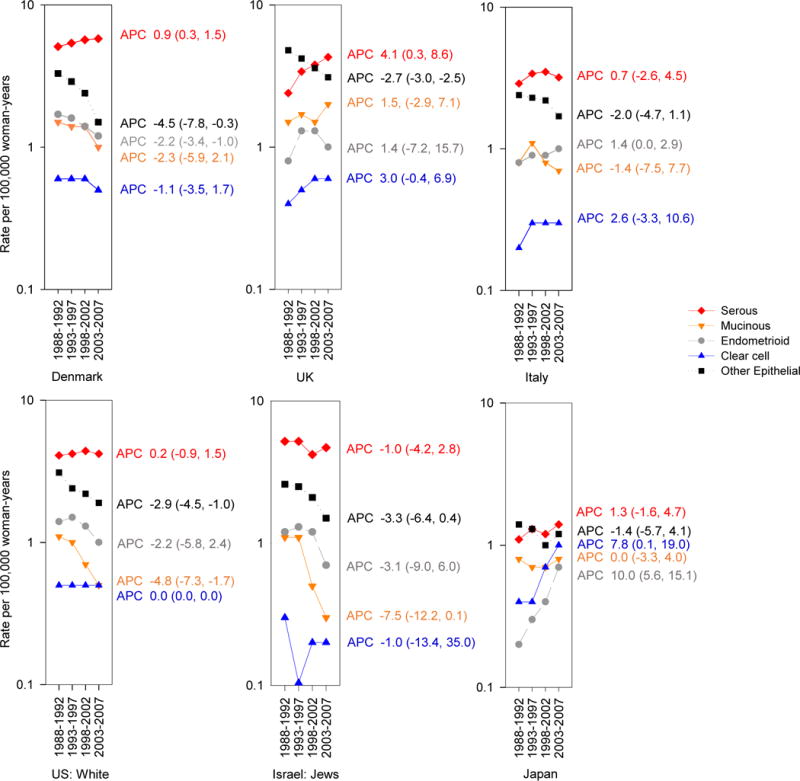
Trends and Annual Percent Change (APC) in age-adjusted ovarian cancer incidence rates per 100,000 woman-years by country and histology from 1988–1992 through 2003–2007, Cancer Incidence in Five Continents (CI5) volume VII–X
Figure 5 depicts the international incidence rates per 100,000 woman-years of ovarian cancer by five-year age group and subtype. For all subtypes, incidence rates before ages 35–39 remained relatively low (approximately 1–2). The incidence rates of serous carcinomas steadily increased with age, reaching over 18 in women at ages 70–74, and slightly decreasing to 16 in women ages 75–79. There were also steady increases by age in cancers of mucinous carcinomas, “other” epithelial subtypes, and unspecified subtypes, reaching 3, 15, and 9 in the oldest age group, respectively. Rates for endometrioid and clear cell carcinomas were notably parallel across age groups, both plateauing around age 55–59. The non-epithelial ovarian cancers (germ cell tumors and sex cord-stromal tumors) conveyed consistently low rates across all age groups, as did the rates of ovarian cancer classified as “other”.
Figure 5.
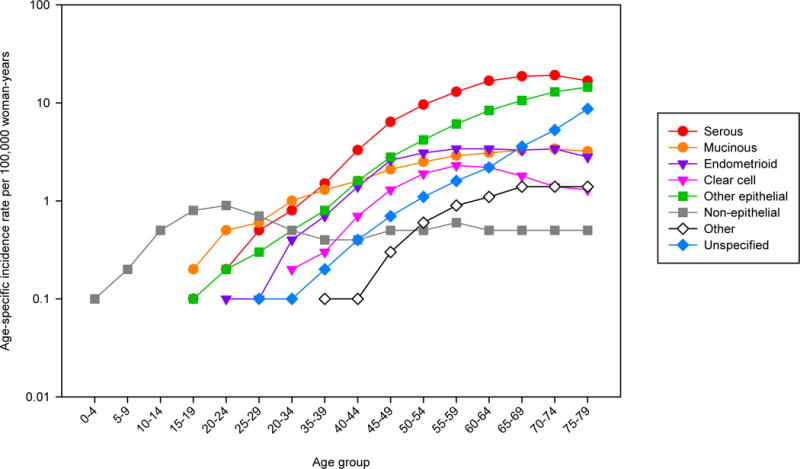
Age-specific incidence of ovarian cancer by histologic subtype, Cancer Incidence in Five Continents (CI5) volume X, 2003–2007
DISCUSSION
Ovarian cancer incidence remains highest among women of European descent, and especially in Northern Europe, where modest declines are noted since 1993–1997. Similar declines in rates are observed in North America. By contrast, gradual increases in ovarian cancer incidence were observed in Asia, especially in Japan. Within regions there was considerable variation with respect to changes in incidence over time. In Western Europe, decreases in ovarian cancer rates were observed in Austria, Switzerland, and the Netherlands, while increases were observed in the UK and Spain. In Australia, New Zealand and Israel, the incidence remained stable.
Disparate incidence rates and trends may reflect changes in the prevalence of risk factors, including removal of gynecologic organs for benign indications, superimposed on varying genetic predispositions. Alterations in population make-up within countries and changes in pathology reporting may also have influenced these data, and these effects may strengthen in the future. For instance, temporal trends in declining mucinous carcinomas among whites in the US could be due, in part, to improvements in the classification of what were thought to be primary mucinous ovarian cancers as intestinal cancers13.
In countries experiencing a decline in ovarian cancer, increased oral contraceptive use, which may reduce risk by 30–40%9, 24 may partially explain the reduction in incidence15, 25. For instance, the uptake of oral contraceptives in England and Wales in the 1960s coincides with substantial declines in ovarian cancer incidence over time25. Parity has also been shown to reduce the risk of ovarian cancer. Therefore, in countries where parity and/or the number of live births per woman is higher, an inverse association with ovarian cancer risk may be observed26–28. Reductions in the use of menopausal hormone therapy may also contribute to the decline in ovarian cancer incidence in recent years. Of note, in the US, there was a dramatic decrease in ovarian cancer incidence following a substantial reduction in menopausal hormone therapy use in 200229. In the present analysis, several Eastern/Southern European countries experienced an increase in ovarian cancer over time, which is parallel to a reduction in the total fertility rate during the same time period30.
The variation in the distribution of epithelial histologies may be explained by population differences in genetic and environmental risk factors which differentially influence each histologic subtype. With respect to genetic factors, the role of BRCA1 and BRCA2 mutations (and their heritability) as risk factors for serous carcinomas has been established31, 32. In this analysis the difference in serous tumors in Israel compared to the international proportion of serous tumors may be partially explained by the ethnic composition of the Israeli Jewish population. More specifically, approximately 50% of the Jewish population in Israel is of Ashkenazi origin33, and it is known that the prevalence of BRCA1 and BRCA2 mutations is high within this population34–36. Thus, it is possible that the large proportion of Ashkenazi Jews may influence the number of serous tumors observed. It is unlikely that differences in the prevalence of BRCA1 or BRCA2 mutations explain the lower frequency of serous tumors among Asian populations. Rather, emerging evidence suggests that in many Asian populations, the prevalence of BRCA mutations is comparable to, if not the same as European and North American populations37, 38, though research is limited regarding genetic testing in Asian populations.
In addition to genetic factors, risk factors such as endometriosis could influence the distributions by histologic subtype, particularly clear cell and endometrioid carcinomas. In Japan, Singapore, and Thailand, the relatively low proportion of serous tumors was compensated by higher rates of endometrioid, clear cell, and mucinous carcinomas. The consistent increase in the proportion of clear cell carcinomas across all three Asian countries and the increased proportion of endometrioid carcinomas in Thailand and Japan relative to the international distribution of these subtypes may be partially explained by the slightly higher prevalence of endometriosis among women of Asian ethnicity39, 40, possibly resulting from genetic and/or environmental risk factors41–44, as endometriosis is an established risk factor for both clear cell and endometrioid carcinomas45. Further, the importance of endometriosis as a risk factor for both clear cell and endometrioid carcinomas may also shed light on the age-specific incidence of these histologic subtypes, in which the rates of both subtypes plateau around the age of menopause. Although it is not possible to evaluate using the current data, it may be informative to evaluate the distribution of histologic subtype among first and second generation Asian-immigrants to Caucasians in the same country (e.g. Asian-Americans in the US).
For certain countries, differences in incidence may also be partly explained by the duration and/or quality of case ascertainment. In Brazil, the proportion of “other” epithelial cancers were much higher than in other studied populations, suggesting that perhaps ovarian cancer is not increasing, but rather tumor registration is increasing. By contrast, the proportion of “other” epithelial carcinomas in Finland and the UK were lower when compared to other populations, potentially suggesting more precise classification of tumors. This is supported by the temporal trends observed in the UK in which rates of “other” epithelial subtypes decreased over time, which may have been supplemented with increases in serous carcinomas.
The main strength of this analysis was the utilization of CI5 data. The registries that are selected for inclusion have been established for at least 15 years. Additionally, standards with respect to comparably, accuracy, and completeness are applied throughout all volumes, ensuring high-quality data. That being said, this analysis was limited in the assessment of ovarian cancer in Africa, Central/South America, and the Middle East due to the lack of data meeting the specified inclusion criteria. The inclusion of such regions may have shed more light on which risk factors are contributing to the geographic variation in ovarian cancer. There were a few countries for which only regional data was available, and these registries were combined, assuming the aggregation provided a reasonable estimate of the national profile. Lastly, the inability to account for the prevalence of bilateral oophorectomy was a weakness in this study that may have led to an underestimation of the incidence of ovarian cancer46, 47. Given the variability in the frequency and trends of bilateral oophorectomy over time, such an underestimation is possible46. In addition, the reproducibility of histopathologic diagnosis is imperfect, and in recent years, categorization of primary site of origin has shifted; specifically, cancers originally designated as ovarian are increasingly re-classified as fallopian tube primary tumors, and many mucinous carcinomas are now recognized to represent metastases of occult gastrointestinal primary tumors to the ovaries13.
In conclusion, though the incidence of ovarian cancer remained relatively stable globally, there were distinct increases in Eastern/Southern Europe, as well as Asia and decreases in Northern Europe and North America. The majority of ovarian cancers were serous carcinomas, followed by mucinous carcinomas, endometrioid carcinomas, “other” epithelial carcinomas and clear cell carcinomas, while the rate of non-epithelial carcinomas remained very low. Compared to the global distribution of epithelial subtypes, the distribution of these subtypes did not vary significantly for the majority of countries, with the exception of countries in Asia. Given the trends in ovarian cancer over time and the distribution of histologic subtypes, certain reproductive, behavioral, life style, and genetic factors at least partially explain the geographical and temporal differences observed between populations internationally.
Supplementary Material
Novelty and Impact.
In this analysis of ovarian cancer by country and histologic subtype trends in ovarian cancer incidence generally remained stable over time; however, there were increases in Eastern/Southern Europe and Asia, and decreases in Northern Europe and North America. The distribution of epithelial ovarian cancer did not vary by country compared to the international distribution, except in Asia where clear cell and endometrioid carcinomas were relatively higher and serous carcinomas were lower.
Acknowledgments
Financial support: This work was supported in part by the Intramural Research Program of the National Cancer Institute.
Abbreviations
- APC
Annual percent change
- IARC
International Agency for Research on Cancer
- CI5
Cancer Incidence in Five Continents
- UK
United Kingdom
- US
United States
- BRCA1
Breast cancer gene 1
- BRCA2
Breast cancer gene 2
- BMI
body mass index
Footnotes
There are no conflicts of interest for the authors to report
References
- 1.Torre LA, Bray F, Siegel RL, Ferlay J, Lortet-Tieulent J, Jemal A. Global cancer statistics, 2012. CA Cancer J Clin. 2015;65:87–108. doi: 10.3322/caac.21262. [DOI] [PubMed] [Google Scholar]
- 2.Klint A, Tryggvadottir L, Bray F, Gislum M, Hakulinen T, Storm HH, Engholm G. Trends in the survival of patients diagnosed with cancer in female genital organs in the Nordic countries 1964–2003 followed up to the end of 2006. Acta Oncol. 2010;49:632–43. doi: 10.3109/02841861003691945. [DOI] [PubMed] [Google Scholar]
- 3.Sant M, Chirlaque Lopez MD, Agresti R, Sanchez Perez MJ, Holleczek B, Bielska-Lasota M, Dimitrova N, Innos K, Katalinic A, Langseth H, Larranaga N, Rossi S, et al. Survival of women with cancers of breast and genital organs in Europe 1999–2007: results of the EUROCARE-5 study. Eur J Cancer. 2015 doi: 10.1016/j.ejca.2015.07.022. [DOI] [PubMed] [Google Scholar]
- 4.Holschneider CH, Berek JS. Ovarian cancer: epidemiology, biology, and prognostic factors. Semin Surg Oncol. 2000;19:3–10. doi: 10.1002/1098-2388(200007/08)19:1<3::aid-ssu2>3.0.co;2-s. [DOI] [PubMed] [Google Scholar]
- 5.Ferlay JSI, Ervik M, Dikshit R, Eser S, Mathers C, Rebelo M, Parkin DM, Forman D, Bray F. GLOBOCAN 2012 v1.0, Cancer Incidence and Mortality Worldwide: IARC CancerBase No 11 [Internet] Lyon, France: International Agency for Research on Cancer; 2013. [Google Scholar]
- 6.La Vecchia C. Ovarian cancer: epidemiology and risk factors. European journal of cancer prevention: the official journal of the European Cancer Prevention Organisation (ECP) 2016 doi: 10.1097/CEJ.0000000000000217. [DOI] [PubMed] [Google Scholar]
- 7.Gilks CB, Prat J. Ovarian carcinoma pathology and genetics: recent advances. Human pathology. 2009;40:1213–23. doi: 10.1016/j.humpath.2009.04.017. [DOI] [PubMed] [Google Scholar]
- 8.Galic V, Coleman RL, Herzog TJ. Unmet needs in ovarian cancer: dividing histologic subtypes to exploit novel targets and pathways. Curr Cancer Drug Targets. 2013;13:698–707. doi: 10.2174/15680096113139990002. [DOI] [PubMed] [Google Scholar]
- 9.Wentzensen N, Poole EM, Trabert B, White E, Arslan AA, Patel AV, Setiawan VW, Visvanathan K, Weiderpass E, Adami HO, Black A, Bernstein L, et al. Ovarian Cancer Risk Factors by Histologic Subtype: An Analysis From the Ovarian Cancer Cohort Consortium. Journal of clinical oncology: official journal of the American Society of Clinical Oncology. 2016;34:2888–98. doi: 10.1200/JCO.2016.66.8178. [DOI] [PMC free article] [PubMed] [Google Scholar]
- 10.Kaku T, Ogawa S, Kawano Y, Ohishi Y, Kobayashi H, Hirakawa T, Nakano H. Histological classification of ovarian cancer. Medical electron microscopy: official journal of the Clinical Electron Microscopy Society of Japan. 2003;36:9–17. doi: 10.1007/s007950300002. [DOI] [PubMed] [Google Scholar]
- 11.Kurman RJ, C M, Herrington CS, Young RH. WHO Classification of Tumours of Female Reproductive Organs. (4) 2014;6 [Google Scholar]
- 12.Slayton RE. Management of germ cell and stromal tumors of the ovary. Seminars in oncology. 1984;11:299–313. [PubMed] [Google Scholar]
- 13.Kurman RJ, Shih Ie M. Molecular pathogenesis and extraovarian origin of epithelial ovarian cancer–shifting the paradigm. Human pathology. 2011;42:918–31. doi: 10.1016/j.humpath.2011.03.003. [DOI] [PMC free article] [PubMed] [Google Scholar]
- 14.Zbuk K, Anand SS. Declining incidence of breast cancer after decreased use of hormone-replacement therapy: magnitude and time lags in different countries. Journal of Epidemiology and Community Health. 2011 doi: 10.1136/jech.2008.083774. [DOI] [PubMed] [Google Scholar]
- 15.Gnagy S, Ming EE, Devesa SS, Hartge P, Whittemore AS. Declining ovarian cancer rates in U.S. women in relation to parity and oral contraceptive use. Epidemiology (Cambridge, Mass) 2000;11:102–5. doi: 10.1097/00001648-200003000-00004. [DOI] [PubMed] [Google Scholar]
- 16.Malvezzi M, Carioli G, Rodriguez T, Negri E, La Vecchia C. Global trends and predictions in ovarian cancer mortality. Annals of oncology: official journal of the European Society for Medical Oncology. 2016;27:2017–25. doi: 10.1093/annonc/mdw306. [DOI] [PubMed] [Google Scholar]
- 17.Lowe KA, Chia VM, Taylor A, O’Malley C, Kelsh M, Mohamed M, Mowat FS, Goff B. An international assessment of ovarian cancer incidence and mortality. Gynecol Oncol. 2013;130:107–14. doi: 10.1016/j.ygyno.2013.03.026. [DOI] [PubMed] [Google Scholar]
- 18.Sung PL, Chang YH, Chao KC, Chuang CM. Global distribution pattern of histological subtypes of epithelial ovarian cancer: a database analysis and systematic review. Gynecol Oncol. 2014;133:147–54. doi: 10.1016/j.ygyno.2014.02.016. [DOI] [PubMed] [Google Scholar]
- 19.Ferlay J, B F, Steliarova-Foucher E, Forman D. IARC CancerBase No 9. Vol. 2014 Lyon: International Agency for Research on Cancer; 2014. Cancer Incidence in Five Continents, CI5plus. [Google Scholar]
- 20.Forman D, B F, Brewster DH, Gombe Mbalawa C, Kohler B, Piñeros M, Steliarova-Foucher E, Swaminathan R, Ferlay J, editors. Cancer Incidence in Five Continents. X. Lyon: International Agency for Research on Cancer; 2014. [DOI] [PubMed] [Google Scholar]
- 21.Segi M, Fujisaku S, Kurihara M. Geographical observation on cancer mortality by selected sites on the basis of standardised death rate. Gan. 1957;48:219–25. [PubMed] [Google Scholar]
- 22.Doll R, P P, W J. Cancer Incidence in Five Continents: A Technical Report. Springer-Verlag; Berlin: 1966. [Google Scholar]
- 23.Devesa SS, Donaldson J, Fears T. Graphical presentation of trends in rates. American journal of epidemiology. 1995;141:300–4. doi: 10.1093/aje/141.4.300. [DOI] [PubMed] [Google Scholar]
- 24.Beral V, Doll R, Hermon C, Peto R, Reeves G. Ovarian cancer and oral contraceptives: collaborative reanalysis of data from 45 epidemiological studies including 23,257 women with ovarian cancer and 87,303 controls. Lancet (London, England) 2008;371:303–14. doi: 10.1016/S0140-6736(08)60167-1. [DOI] [PubMed] [Google Scholar]
- 25.dos Santos Silva I, Swerdlow AJ. Recent trends in incidence of and mortality from breast, ovarian and endometrial cancers in England and Wales and their relation to changing fertility and oral contraceptive use. British journal of cancer. 1995;72:485–92. doi: 10.1038/bjc.1995.360. [DOI] [PMC free article] [PubMed] [Google Scholar]
- 26.Braem MG, Onland-Moret NC, van den Brandt PA, Goldbohm RA, Peeters PH, Kruitwagen RF, Schouten LJ. Reproductive and hormonal factors in association with ovarian cancer in the Netherlands cohort study. American journal of epidemiology. 2010;172:1181–9. doi: 10.1093/aje/kwq264. [DOI] [PMC free article] [PubMed] [Google Scholar]
- 27.Voigt LF, Harlow BL, Weiss NS. The influence of age at first birth and parity on ovarian cancer risk. American journal of epidemiology. 1986;124:490–1. doi: 10.1093/oxfordjournals.aje.a114419. [DOI] [PubMed] [Google Scholar]
- 28.Cramer DW, Hutchison GB, Welch WR, Scully RE, Ryan KJ. Determinants of ovarian cancer risk. I. Reproductive experiences and family history. Journal of the National Cancer Institute. 1983;71:711–6. [PubMed] [Google Scholar]
- 29.Yang HP, Anderson WF, Rosenberg PS, Trabert B, Gierach GL, Wentzensen N, Cronin KA, Sherman ME. Ovarian cancer incidence trends in relation to changing patterns of menopausal hormone therapy use in the United States. Journal of clinical oncology: official journal of the American Society of Clinical Oncology. 2013;31:2146–51. doi: 10.1200/JCO.2012.45.5758. [DOI] [PMC free article] [PubMed] [Google Scholar]
- 30.Europe the continent with the lowest fertility. Human reproduction update. 2010;16:590–602. doi: 10.1093/humupd/dmq023. [DOI] [PubMed] [Google Scholar]
- 31.Risch HA, McLaughlin JR, Cole DE, Rosen B, Bradley L, Kwan E, Jack E, Vesprini DJ, Kuperstein G, Abrahamson JL, Fan I, Wong B, et al. Prevalence and penetrance of germline BRCA1 and BRCA2 mutations in a population series of 649 women with ovarian cancer. American journal of human genetics. 2001;68:700–10. doi: 10.1086/318787. [DOI] [PMC free article] [PubMed] [Google Scholar]
- 32.Pal T, Permuth-Wey J, Betts JA, Krischer JP, Fiorica J, Arango H, LaPolla J, Hoffman M, Martino MA, Wakeley K, Wilbanks G, Nicosia S, et al. BRCA1 and BRCA2 mutations account for a large proportion of ovarian carcinoma cases. Cancer. 2005;104:2807–16. doi: 10.1002/cncr.21536. [DOI] [PubMed] [Google Scholar]
- 33.Zlotogora J. Genetics and genomic medicine in Israel. Molecular genetics & genomic medicine. 2014;2:85–94. doi: 10.1002/mgg3.73. [DOI] [PMC free article] [PubMed] [Google Scholar]
- 34.Struewing JP, Abeliovich D, Peretz T, Avishai N, Kaback MM, Collins FS, Brody LC. The carrier frequency of the BRCA1 185delAG mutation is approximately 1 percent in Ashkenazi Jewish individuals. Nature genetics. 1995;11:198–200. doi: 10.1038/ng1095-198. [DOI] [PubMed] [Google Scholar]
- 35.Oddoux C, Struewing JP, Clayton CM, Neuhausen S, Brody LC, Kaback M, Haas B, Norton L, Borgen P, Jhanwar S, Goldgar D, Ostrer H, et al. The carrier frequency of the BRCA2 6174delT mutation among Ashkenazi Jewish individuals is approximately 1% Nature genetics. 1996;14:188–90. doi: 10.1038/ng1096-188. [DOI] [PubMed] [Google Scholar]
- 36.Modan B, Hartge P, Hirsh-Yechezkel G, Chetrit A, Lubin F, Beller U, Ben-Baruch G, Fishman A, Menczer J, Struewing JP, Tucker MA, Wacholder S. Parity, oral contraceptives, and the risk of ovarian cancer among carriers and noncarriers of a BRCA1 or BRCA2 mutation. The New England journal of medicine. 2001;345:235–40. doi: 10.1056/NEJM200107263450401. [DOI] [PubMed] [Google Scholar]
- 37.Liede A, Narod SA. Hereditary breast and ovarian cancer in Asia: genetic epidemiology of BRCA1 and BRCA2. Human mutation. 2002;20:413–24. doi: 10.1002/humu.10154. [DOI] [PubMed] [Google Scholar]
- 38.Shanmughapriya S, Nachiappan V, Natarajaseenivasan K. BRCA1 and BRCA2 mutations in the ovarian cancer population across race and ethnicity: special reference to Asia. Oncology. 2013;84:226–32. doi: 10.1159/000346593. [DOI] [PubMed] [Google Scholar]
- 39.Arumugam K, Templeton AA. Endometriosis and race. The Australian & New Zealand journal of obstetrics & gynaecology. 1992;32:164–5. doi: 10.1111/j.1479-828x.1992.tb01932.x. [DOI] [PubMed] [Google Scholar]
- 40.Cramer DW, Missmer SA. The epidemiology of endometriosis. Annals of the New York Academy of Sciences. 2002;955:11–22. doi: 10.1111/j.1749-6632.2002.tb02761.x. discussion 34–6, 396–406. [DOI] [PubMed] [Google Scholar]
- 41.Yan Y, Wu R, Li S, He J. Meta-analysis of association between the TP53 Arg72Pro polymorphism and risk of endometriosis based on case-control studies. European journal of obstetrics, gynecology, and reproductive biology. 2015;189:1–7. doi: 10.1016/j.ejogrb.2015.03.015. [DOI] [PubMed] [Google Scholar]
- 42.Li J, Chen Y, Mo Z, Li L. TP53 Arg72Pro polymorphism (rs1042522) and risk of endometriosis among Asian and Caucasian populations. European journal of obstetrics, gynecology, and reproductive biology. 2015;189:73–8. doi: 10.1016/j.ejogrb.2015.03.026. [DOI] [PubMed] [Google Scholar]
- 43.Sangi-Haghpeykar H, Poindexter AN., 3rd Epidemiology of endometriosis among parous women. Obstetrics and gynecology. 1995;85:983–92. doi: 10.1016/0029-7844(95)00074-2. [DOI] [PubMed] [Google Scholar]
- 44.Missmer SA, Hankinson SE, Spiegelman D, Barbieri RL, Marshall LM, Hunter DJ. Incidence of laparoscopically confirmed endometriosis by demographic, anthropometric, and lifestyle factors. American journal of epidemiology. 2004;160:784–96. doi: 10.1093/aje/kwh275. [DOI] [PubMed] [Google Scholar]
- 45.Worley MJ, Welch WR, Berkowitz RS, Ng SW. Endometriosis-associated ovarian cancer: a review of pathogenesis. International journal of molecular sciences. 2013;14:5367–79. doi: 10.3390/ijms14035367. [DOI] [PMC free article] [PubMed] [Google Scholar]
- 46.Hammer A, Rositch AF, Kahlert J, Gravitt PE, Blaakaer J, Sogaard M. Global epidemiology of hysterectomy: possible impact on gynecological cancer rates. American journal of obstetrics and gynecology. 2015;213:23–9. doi: 10.1016/j.ajog.2015.02.019. [DOI] [PubMed] [Google Scholar]
- 47.Merrill RM. Impact of hysterectomy and bilateral oophorectomy on race-specific rates of corpus, cervical, and ovarian cancers in the United States. Annals of epidemiology. 2006;16:880–7. doi: 10.1016/j.annepidem.2006.06.001. [DOI] [PubMed] [Google Scholar]
Associated Data
This section collects any data citations, data availability statements, or supplementary materials included in this article.