Abstract
The ability to record and to control action potential firing in neuronal circuits of the brain is critical to understand how the brain functions on the cellular and network levels. Recent development of optogenetic proteins allows direct stimulation or inhibition of action potential firing of neurons upon optical illumination. In this paper, we combined a low-noise and high input impedance (or low input capacitance) neural recording amplifier, and a high current laser/LED driver in a monolithic integrated circuit (IC) for simultaneous neural recording and optogenetic neural control. The low input capacitance of the amplifier (9.7 pF) was achieved through adding a dedicated unity gain input stage optimized for high impedance metal electrodes. The input referred noise of the amplifier was measured to be 4.57 µVrms, which is lower than the estimated thermal noise of the metal electrode. Thus, action potentials originating from a single neuron can be recorded with a signal-to-noise ratio of ~6.6. The LED/laser current driver delivers a maximum current of 330 mA to generate adequate light for optogenetic control. We experimentally tested the functionality of the IC with an anesthetized Mongolian gerbil and recorded auditory stimulated action potentials from the inferior colliculus. Furthermore, we showed that spontaneous firing of 5th (trigeminal) nerve fibers was inhibited using the optogenetic protein Halorhodopsin. A noise model was also derived including the equivalent electronic components of the metal electrode and the high current driver to guide the design.
Index Terms: Neural recording, optogenetics, extracellular recording, electrophysiology, in-vivo recording
I. INTRODUCTION
Electrophysiological recordings of action potentials in the brain have been one of the most important research tools for neuroscientists to decipher the function of neuronal circuits [1]–[6]. In addition to recording naturally occurring neuronal activity and to gain further insights into functions of these circuits, many neuroscientists desire to manipulate neuronal activity experimentally. One such method that recently received much attention is the experimental manipulation of neuronal circuits with light (optogenetics) to control complex neuronal functions, including behavior [7]–[12].
Optogenetics is a biomolecular technique in which DNA of light-sensitive ion channels can be introduced into neurons of interest. Light-sensitive ion channels will then be expressed and transported to the cell membrane by the native protein translation mechanisms of the cells. Once introduced into neurons, these light-sensitive ion channels can then be activated by light, and become permeable for either positive (sodium) or negative (chloride), depending on the type of optogenetic protein [9], [12]. For example, the blue-light (peaked at ~480 nm) sensitive Channelrhodopsin (ChR) selectively allows positively charged sodium ions to enter neurons and thereby stimulate the firing of action potentials. In contrast, the orange-light (peaked at ~580 nm) sensitive Halorhodopsin (NpHR) is a chloride pump by which negatively charged chloride ions are pumped into neurons, inhibiting action potential firing. Therefore, by choosing the type of optogenetic protein for transfection and the corresponding wavelength for a light source, action potentials can be selectively excited or inhibited. In addition, cell type specificity within the neuronal target can be achieved by selecting different promotors, or using genetic approaches such as the Cre-Lox recombination [13], [14]. In comparison, controlling neuronal activity via electrical stimulation is much more limited, in that action potentials cannot be inhibited, and the electrical stimulation is not cell type specific [12], [15]–[17]. This kind of flexibility makes optogenetics the technique of choice to control neuronal circuits under various experimental conditions, and enables certain types of studies that used to be extremely difficult if not impossible. This technology also has the potential to be translated into future treatment options for neural disorders in human patients.
In behavioral studies, it is technologically challenging to record electrical activity intracellularly, i.e. from inside neurons, while the animal is awake or moving. Therefore, action potentials are generally recorded by placing an electrode outside but very close to the neuron of interest in the extracellular space for in-vivo or behavioral experiments [6]. The electric current induced in the extracellular space is, however, relatively small, and translates into a voltage recorded by the external electrode typically in the sub-mV range [18], [19]. In addition, the ability to reject signals originating from neighboring neurons is critical [20]–[26], especially for recording from densely packed neurons which have somas typically around 5–15 µm in diameter [25], [27], [28]. To isolate the weak signals generated by these cells, small recording surface (several micrometers in diameter) electrodes are often used to limit the range of detection, in contrast to field potential recording or multi-neuron recording where the recording surface is significantly larger. Electrodes with exposed tips of approximately 100 µm in diameter were estimated to cover a sphere with a radius of 50–350 µm [29]–[32]. Small tipped electrodes, however, have a very high electrical impedance (several mega-ohms). This high electrode impedance in turn acts as a voltage divider with the recording amplifier input impedance, which significantly reduces the signal voltage measurable by the recording amplifier. For this reason, we tailored our amplifier design to achieve a high input impedance, or low input capacitance, for optimized use of high impedance electrodes.
Several studies have been published regarding neural acquisition amplifier designs [18], [33]–[43]. However, most of these studies were focused on the ability to record from multiple electrodes [34], [41]–[43], reduce power consumption [33], [35], [36], [38]–[41], and improve the noise efficiency factor [18], [33], [35], [36], [38], [40]. The role of the amplifier’s input impedance, which is one of the important parameters for extracellular recordings, has not received much attention in these designs. Tailoring the input impedances of the amplifiers allows for selective measurements of local filed potentials, action potentials from multiple neurons, or action potentials from a single neuron [29], [44]. In particular, a high impedance electrode with a small recording surface is necessary to record single neuronal activity and designs of neural amplifiers specially tailored for this application are relatively few.
Several works [45]–[47] attempted to incorporate optogenetic control, with or without some form of recordings. Pashaie et al. designed a close-loop optogenetic brain interface based on micro-ECoG and fluorescence microscopy [45]. Paralikar et al. implemented an implantable 5 mW/channel dual-wavelength optogenetic stimulator, without a neural recording element [46]. Sawadsaringkarn et al. also published a CMOS optoelectronic neural interface based on an image sensor with an on-chip light stimulator [47]. However, the integration of both action-potential recording and optogenetic control in a single monolithic integrated circuit (IC) is still lacking.
We developed a monolithic IC which integrates a low-noise neural amplifier for action potential recording and a high current laser/LED driver for simultaneous optogenetic control to help meet the needs of this new and important trend of using optogenetics in neuroscience. In addition, an electrical noise model for the recording amplifier was derived to guide the amplifier design. In the model, noise sources from both the high impedance metal electrode and the optogenetic control process were included. The performance of the IC was tested with anesthetized Mongolian gerbils from which action potentials were recorded from the inferior colliculus in the midbrain. Additionally, we were able to inhibit spontaneous neural firing of the fifth nerve using optogenetics using an implantable “optrode”, which includes a high input impedance electrode and the optical illumination fiber. Our results indicated that an integrated laser/LED controller can deliver a maximum current of 330 mA, which is adequate to effectively drive a laser to inhibit neural activity in the brainstem. The recording amplifier has a low input capacitance of 9.7 pF optimized for the use of high impedance electrodes for single cell extracellular recording. The input referred noise of the amplifier was measured to be 4.57 µVrms and the recorded action potentials had a signal-to-noise ratio of ~6.6. Therefore, we believe that the use of this multi-functional IC system may facilitate the complexities of using optogenetics with electrophysiology recording for current and future in-vivo and behavioral experiments to test various hypotheses in neuroscience.
II. OPTOGENETICS AND SIGNAL-TO-NOISE ANALYSIS
A. Optogenetics
The two families of optogenetic proteins – ChR and NpHR – have distinctly different optical excitation spectra. ChR and NpHR have maximum absorptions at ~470 nm (blue) and ~580 nm (orange), respectively [7], [10], [48]. This spectral separation of 90 nm allows the two proteins to be separately excited using different colors of light even when the two proteins are co-transfected in the same cell. In in-vivo or behavioral experiments, light is typically delivered to neuronal targets through optical fibers [7]. The excitation light sources can either be a laser or a light-emitting-diode (LED), provided that the optical power at the fiber output is high enough to activate the optogenetic proteins (optical coherency is not important in the application). Typical optical power density required to excite ChR and NpHR is ~10 mW/mm2 and ~50 mW/mm2, respectively [10], [49]. The brain, however, is high optical scattering and therefore optical scattering in the brain significantly reduces the amount of optical power available for optogenetic excitation. Our previous study of optical scattering in brain tissues has characterized the effective scattering coefficients in various brain regions [50]. Optical power required at the fiber tip can be accurately estimated using an iPhone or Android APP based on our measured data [50], [51]. For instance, 100 mW of optical power can effectively inhibit about ~800 µm depth of brainstem using NpHR under ideal conditions. Therefore, current drivers capable of delivering hundreds of mA of electric current are necessary to drive laser or LED sources to produce adequate optical power for successful optogenetic controls. The temporal requirement of the current drivers are comparatively simple. Action potentials typically have a pulse duration of a few milli-second with a rise time of several tenths of a milli-second. For optical stimulation using ChR, optical pulses with a repetition frequency from several to hundreds of hertz is often used. In contrast, optical inhibition with NpHR requires constant illumination to inhibit stochastic firing action potentials [12].
B. Noise model of high input impedance amplifier with optogenetic noise
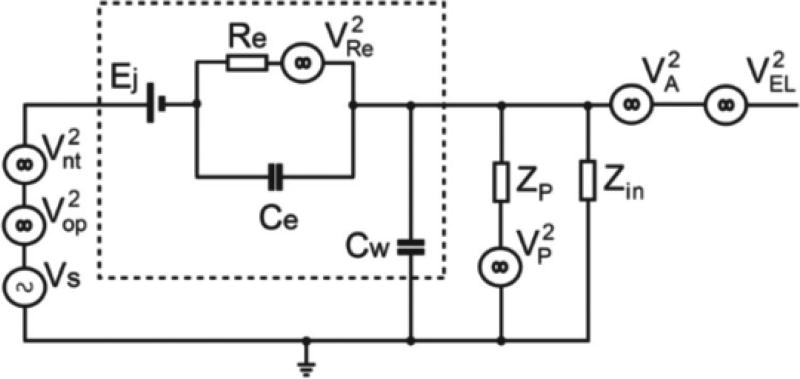
Figure 1 is the proposed noise model to analyze interference of the neural amplifier in which a metal electrode was used to measure action potentials extracellularly with a high current driver for optical illumination included to perform optogenetic controls. The noise model in Fig. 1 was expanded from our previously model in which a glass pipette electrode was used and without noises arisen from optogenetic control [44].
Fig. 1.
The equivalent noise model of an electrophysiological recording amplifier optimized for using a high impedance metal electrode with small exposed tip. The noise model also includes additional noise sources which are associated with high current drivers used for optogenetic control. The dotted line surrounds the equivalent components of the metal electrode. Vs: extracellular action potentials of the measured neuron; : noise generated from the surrounding neurons; : small photoelectric current generated voltage during optical illumination of the metal electrode; Ej: DC half-cell potential; Re: leakage resistance of the electric double layer of the metal-electrolyte junction; Ce: equivalent capacitor for the electric double layer; : thermal noise of Re; Cw: insulating capacitor of the metal electrode; : power-line interference; Zp: equivalent insulating resistor between the powerline and the amplifier. Zin: input impedance of the amplifier; : intrinsic noise of the amplifier; : fluctuation noise during optogenetic current surge.
In the noise model, the tip of the metal electrode is described by four equivalent components: 1) the DC half-cell potential Ej, 2) the electric double layer capacitor Ce, 3) the metal-electrolyte interface leakage resistor Re, and 4) the insulating capacitor Cw. Ej is the voltage potential difference between the two metal-electrolyte junctions of the metal electrode and of the reference electrode [52], [53]. Re is the leakage resistance for charge carriers migrating across the electric double layer, and Ce is the equivalent capacitor for the same electric double layer [6], [52], [54], [55]. Generally, it was determined that both Re and Ce weakly depend on the applied signal frequency f, with a relation of (2πf)−1/2. Re also weakly varies against the amplitude of the measured neural voltage Vs [6], [54]. For simplicity, these two small effects were neglected in our discussion. The value of Re is also inversely proportional to the surface area of the exposed metal tip [6], [54]. As mentioned in the introduction, many neuroscience experiments use metal electrodes with small exposed tips to minimize the detection range to the nearest neuron. The small tip results in a relatively large leakage resistance (Re ~2–3 MΩ) [6]. In addition, for high impedance electrodes, Ce can be approximated to be ~50 pF [6]. The insulation layer covering the metal electrode also forms another capacitor [6], [52], [54], [55]. The insulating capacitance Cw is linearly proportional to the immersion depth of the electrode and is typically approximated to be ~9.3 pF/cm for well-insulated electrodes [6].
In the model, Vs is the voltage of extracellular action potentials generated by a neuron during measurement. This voltage typically has a range between 50 µVpp to 500 µVpp with a rise time of ~0.2 ms and a pulse duration of ~1 ms [6]. accounts for all voltages arising from other neurons surrounding the measured neuron and these voltages are considered to be noise in single cell recordings. This background noise has been well-documented by Refs. [56], [57]. Based on the literature, this background noise has a frequency dependence of 1/fα (where α = 1.1 under normal conditions) and this noise is mainly dominated by frequencies below 300 Hz [56]. In optogenetic control, light delivered by an optical fiber is attached adjacent to the recording metal electrode. Thus light outputting from the optical fiber intended to illuminate the neurons will also unavoidably illuminate the metal electrode. This optical illumination on the metal electrode triggers a photoelectric effect to generate a sudden surge of small current [15], [49], [58], [59]. The voltage generated by this small photoelectric current can be considered an electric artifact of the measured neuronal signal and denoted as in the model. Fortunately, this illumination noise can easily be separated from neural action potentials since the noise aligns well with the onset of the optical illumination. Finally, the dominating noise of the entire model is the thermal noise generated from the leakage resistance Re. Due to the high value of Re, this noise is typically about a few tens of µVpp over the measurement bandwidth.
There are also other experimental noise sources which can play a factor in the model if not carefully eliminated. The 50/60 Hz power line interference can also be described as a noise source . The electrical insulation between the recording amplifier and the laboratory power line can be represented by an equivalent impedance Zp. Caution should be taken in the laboratory to electrically isolate the neural amplifier from the laboratory noise as much as possible (maximizing Zp). For instance, a Faraday cage can be used to shield the amplifier and the experimental setup to minimize signal contamination. is the additional electrical noise caused by the current fluctuation affecting the amplifier when the optogenetic current driver is operating.
Useful IC design guidelines can be drawn from the noise model. To start, several less important noise sources can be removed from the model for simpler analysis. As mentioned, careful implementation of shielding around the experimental setup can reduce power line noise to a minimum. Metal electrodes with small exposed tips are often used to reduce . Post-processing filtering and good IC design practices can be implemented to minimize and . Thus the thermal noise of the electrode remains as the dominant noise of the system. The SNR of the system can then be approximated to be
Derivation details of the above equation can be found in the Supplementary Appendix. Two design guidelines can be subsequently drawn from the above equation: 1) The lower the input capacitance (or the higher the input impedance, where Zin = 1/j2πfCin), the higher an SNR can be obtained, and 2) if the input capacitance Cin is much lower than Ce of the electrode, i.e. , the above equation can be further reduced to
Therefore, the amplifier should have an intrinsic noise of at least lower than the half of the thermal noise to achieve an optimal SNR. For a metal electrode with an 3MΩ impedance, the thermal noise at room temperature (300 K) with a 5 KHz measurement bandwidth is estimated to be . Therefore the amplifier intrinsic noise should be designed to be lower than half of this level.
III. IC DESIGN AND EXPERIMENTAL SETUP
A. IC Design
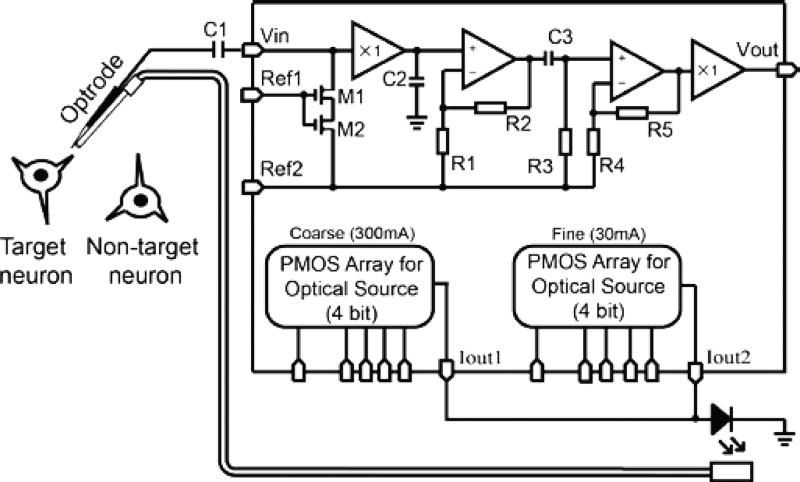
Figure 2 illustrates the schematic diagram of the IC for extracellular single cell recording and simultaneous optogenetic control. The IC was designed and fabricated using the 0.18 µm CMOS processing technology of Global Foundries (Santa Clara, CA). As described by the noise model, the input impedance of the recording amplifier should be designed to be as high as possible and also to have a low intrinsic noise to achieve a good SNR. In conventional neural amplifier designs where high impedance electrodes were not used, a high gain CMOS amplifier serves as a first stage without optimizing the input impedance [60]. Without a high enough input impedance of the amplifier, the high impedance of the metal electrode will share the action potential voltage with the amplifier, leading to a reduced SNR. For this reason, a unity gain buffer was used in our design as the first amplifying stage to especially optimize for a high input impedance (9.7 pF), leaving the amplification to be handled by second and third stage amplifiers. The disadvantage of adding a unity-gain amplifier to achieve higher input impedance is that the design sacrifices some power efficiency due to the additional power needed for the first stage. However the increase in power consumption is negligible in most optogenetic experiments since the current driver consumes a much larger current (hundreds of mA).
Fig. 2.
The Schematic diagram of the IC integrating a high input impedance neural amplifier optimized of using a high impedance metal electrode for single neuron electrophysiology recording and two adjustable high current laser/LED driver for optogenetic stimulation or inhibition.
A capacitor C1 was connected to two MOSFET transistors (M1 and M2), which were used as two adjustable resistors, forming a high-pass filter to reject the DC half-cell potential Ej. The filter avoids the DC half-cell potential acting as a large offset overloading the amplifiers. Ref1 is an external contact point of which the resistance values of M1 and M2 can be adjusted by supplying an external voltage to fine-tune the cutoff frequency of the low-pass filter. The second contact point Ref2 serves as a bias voltage to set the operation point of the all three amplifying stages. The second stage design was based on a low-noise and low-power operational transconductance amplifier and was used to amplify the input signal with a moderate gain [38]. The second stage gain is adjustable by setting the ratio of the two resistors R2 and R1 and was optimally set to have a gain of 26 dB to prevent noise from surrounding neurons (Vnt) and power line interference (Vp) saturating the amplifier. These two noises were subsequently filtered before the signal entering the third amplifier by a high-pass filter formed by C3 and R3. The third amplifier was finally implemented to have an overall gain ~51.5 dB to amplify the neural signal to a voltage level of ~200 mVpp. Another unity gain buffer was used as the final power stage to provide an output current adequate to drive an analog-to-digital converter (ADC) for signal digitization at the output.
Two programmable PMOS arrays were designed to provide a combined maximum current of 330 mA to drive the optogenetic light source. The first and second PMOS arrays can generate maximum currents of 300mA and 30 mA, respectively. Each of the PMOS arrays has a 4-bit digital input for the users to adjust the current outputs. The current resolutions for the first and the second PMOS arrays are 18.75 mA and 1.875 mA, respectively. The first benefit of having a two stage current control is to allow a finer current adjustment for the optical output level. The second benefit is to improve the response time of the optical output. Due to the fact that semiconductor laser diodes or LEDs have a negligible optical output before the driving current reaching a threshold, the temporal response of the optical output can be improved by using the first PMOS array to drive the light source slightly below threshold to maintain a very low optical output, and by stepping the driving current above the threshold using the second PMOS stage, such that the optical power can be rapidly increased.
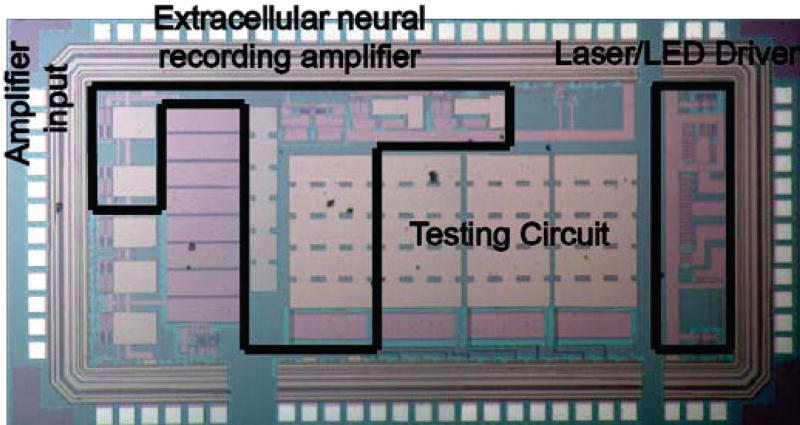
A photograph of the IC is shown in Fig. 3 and the dimensions of the IC are measured to be 2.9 × 1.6 mm including the non-essential testing circuit. The IC chip consists of two regions - an extracellular neural recording amplifier and a programmable laser/LED driver (two PMOS units). The neural recording amplifier and the laser/LED driver were positioned opposite to each other at the two ends of the IC to minimize electrical interference to the recording amplifier when the laser/LED drivers are driving large currents.
Fig. 3.
A photograph of the fabricated IC in the dimension of 2.9 mm × 1.6 mm. The actual neural amplifier and the laser/LED driver unit occupies about half of the space, and the rest of the space is occupied by additional testing circuits.
Simulations of the amplifier performance (frequency response and input referred noise) were conducted using Cadence (an IC design software - Cadence Design Systems, San Jose CA) during the design phase to compare with the experimentally measured results. The frequency response of the amplifier was also experimental measured using a dynamic signal analyzer (35670A, Agilent Technologies, Santa Clara CA) on the fabricated ICs.
The input impedance of our amplifier was measured using the method described in detail in Ref. [44]. In short, a 1 Vpp sinusoidal voltage with a sweeping frequency from 1 to 5000 Hz was connected to a 10 MΩ resistor and the neural amplifier in series. The 10 MΩ resistor and the input capacitor of the neural amplifier forms a low pass filter, and the frequency response of this low pass filter can be measured at the output of the unit gain stage. The 3 dB cutoff frequency of the frequency response curve was then used to calculate the input capacitance of the amplifier.
B. Optrode
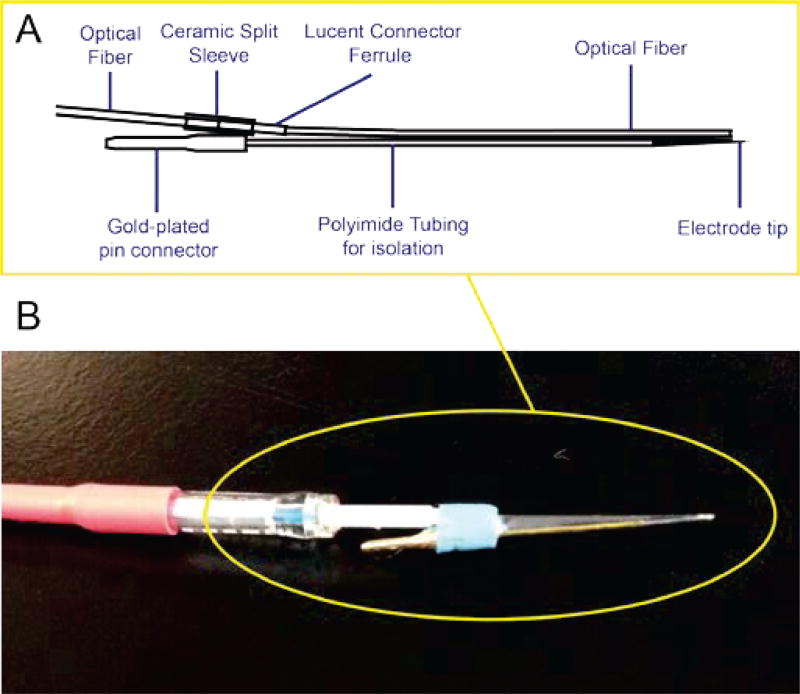
An implantable “optrode” integrating both a metal electrode and an optical fiber for simultaneous electrophysiology recording and optogenetic control was designed and fabricated. The optrode is intended to be used together with our custom IC as a complete package for animal neural experiments. A schematic diagram and the finished optrode are shown in Fig. 2. The metal electrode (WEPT33.0B10, MicroProbes, Gaithersburg MA) was made out of Tungsten and was isolated by a coating of polyimide with an opening of ~5 µm at the tip. Because of the small tip opening, the impedance of the metal electrode is high and was measured to be ~3 MΩ at 1 kHz. A 200 µm core diameter multimode optical fiber (FT200EMT, Thorlabs, Newton NJ) was glued to the side of the Tungsten metal electrode. The tip surface of the optical fiber was carefully polished to minimize optical loss by surface scattering. An 1.25 mm OD multimode ceramic Zirconia ferrule (Precision Fiber Products, Milpitas CA) was used to encapsulate the fiber coupling end. A ceramic split sleeve was then inserted to couple laser light to the optical fiber. In addition, index matching gel (G608N3, Thorlabs, Newton NJ) was scribbled onto the fiber tip during the matching process to improve the coupling efficiency between the fiber and the laser. With this procedure, the optical fiber can achieve a coupling efficiency as high as 90%. To glue the optical fiber to the metal electrode, the metal electrode was placed under a dissecting microscope and the optical fiber was held by a three-axis micromanipulator for precise positioning, and the fiber tip was positioned around 100 µm above the tungsten metal electrode. This is to ensure the neuron under measurement was indeed illuminated by the optical radiation. UV dental cement was then applied to secure all parts of the optrode. The overall light coupling efficiency was above 80% for the final assembled optrode, and the maximum optical power achieved at the output of the fiber was around 796 mW/mm2.
C. Experimental setup for testing the IC
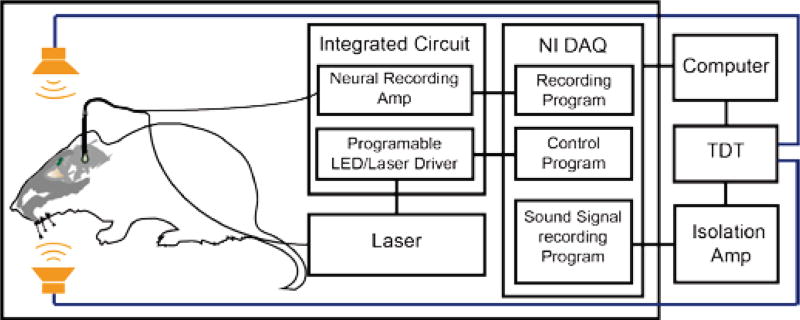
To test the IC chip in simultaneous neural recording and optogenetic control, an in-vivo electrophysiology system with audio stimulation was designed and used for our data collection. Figure 5 is the block diagram of our in-vivo animal auditory neuroscience setup. After the gerbil was positioned securely in the system, an optrode mounted on a micro-manipulator (Inchworm controller 8200, EXFO Burleigh Products, Victor NY) was carefully driven into the brain. The manipulator has a linear resolution of 1 µm to locate the neural target. The tungsten metal electrode was then connected to the neural amplifier of the IC chip for signal amplification. A Faraday cage was carefully constructed around the experimental setup to reduce environmental interference. To reduce interference when large currents were used to drive the two audio speakers as described below, an isolation amplifier (ISO124, Texas Instruments, Dallas TX) was used to further isolate the amplifier to the subsequent electronics. The output from the isolation amplifier was then connected to a data acquisition card (NI USB-6341, National Instruments, Austin TX) for digitalization and the data was subsequently captured by a computer for further analysis. A Butterworth 4th order infinite-impulse-response (IIR) band-pass filter (300 Hz – 5 kHz) was applied to the digitized signal to filter the low-frequency noise originating from the remaining 50/60 Hz power-line interference. The data acquisition card also had several digital outputs which were connected to the laser/LED PMOS current drivers to control the supplying currents for the laser to generate light for optogenetic controls. To minimize brain tissue damage due to continuous optical illumination, the laser/LED driver was programmed to have a maximum duration of less than five seconds. The laser on and off time were also recorded together with the recorded neural voltage by a custom control software written in LabVIEW (National Instrument, Austin TX). Firing rates of the action potentials were calculated using a custom Python program, in which a threshold was set to reject the noise floor to identify action potentials.
Fig. 5.
Experimental setup for simultaneous optogenetic inhibition and electrophysiological recordings from the brainstem of an anesthetized gerbil. The IC was connected to a data acquisition card (NI-DAQ) for signal digitization and laser power control. An isolation amplifier was used to isolate the neural amplifier from environmental noise. An audio signal processor (TDT) was used to generate a tonal signal to drive two speakers placed in the ears of the gerbil for auditory stimulation of the inferior colliculus.
Two multi-field magnetic speakers (MF1, Tucker-Davis Technology, Alachua FL) were placed against both ears of the gerbil. A single frequency tone was generated by an audio signal processor (RX6, Tucker-Davis Technologies, Alachua FL) and played through the two speakers. Details of the audio control can be found in Ref. [44].
IV. ANIMAL PREPARATIONS AND STEREOTACTIC HPNR VIRAL INJECTION
A. Animal preparations and viral injection
All experimental procedures complied with all applicable laws and NIH guidelines and were approved by the University of Colorado IACUC. All experiments were conducted in Mongolian gerbils (Meriones unguiculatus).
Animals were first anesthetized with a mixture of ketamine-xylazine (60mg/kg–5mg/kg), and a maintenance dose (25mg/kg–5mg/kg) was given following complete anesthesia to maintain the anesthetized state. Once the animal was properly anesthetized, the fur over the skull was shaved off and the underlying skin sanitized with a disinfectant. Skin and muscle overlying the skull were removed and a craniotomy was made in the skull at 1.2 mm lateral and 1.2 mm posterior of lambda using a dental drill. A screw was also placed in the skull over the forebrain with a gold connector as a ground source. The coordinates used here allowed us access to both brain regions we recorded from (inferior colliculus and brainstem). Optogenetic NpHR virus (AAV9.h Syn.e NpHR3.0 - eYFP.WPRE.hGH) was injected into the brain. Four injections of 69 nL were made at 3.5 mm deep followed by three injections at 3.0 mm deep for a total virus infection of 483 nL using a Nanoliter injector (World Precisions Instruments, Sarasota, FL). The skin over the skull was then sutured and the animal was given four buprenorphine injections (0.1 mg/kg) over 48 hours to aid in recovery and analgesia. The animal then incubated the virus for 48 days before the experimental measurements.
B. Histology to confirm injection and recording sites
The following procedure was used to confirm that virus and optrode were targeted the desired brain areas. After all electrophysiological and optogenetic experiments were concluded, the animal was given an overdose of pentobarbital (0.03 mL/g) and perfused transcardially with phosphate buffer solution (PBS) and 4% Paraformaldehyde (PFA). Once perfusion was complete, the brain was removed and placed into 4% agar. The brainstem and cerebellum were then sliced coronally in 100 µm sections using a vibratome (Leica VT 1000s, Nussloch, Germany). The sections were then stained with a 1:100 concentration of Neurotrace Nissl stain (ThermoFisher, Waltham MA, 435/455 blue fluorescent Nissl stain) diluted in antibody solution (ABS) [61]. The brain slices were then mounted on slides with Fluoromount-G (Diagnostic BioSystems, Pleasanton CA) and imaged with an Olympus FV1000 (Tokyo, Japan) confocal microscope using the laser lines of 405nm and 488nm to image the Nissl (cell body indicator) and yellow fluorescent protein (YFP), which is the fluorescent indicator for NpHR protein expression.
V. EXPERIMENTAL RESULTS
A. Electrical characterization of the amplifier
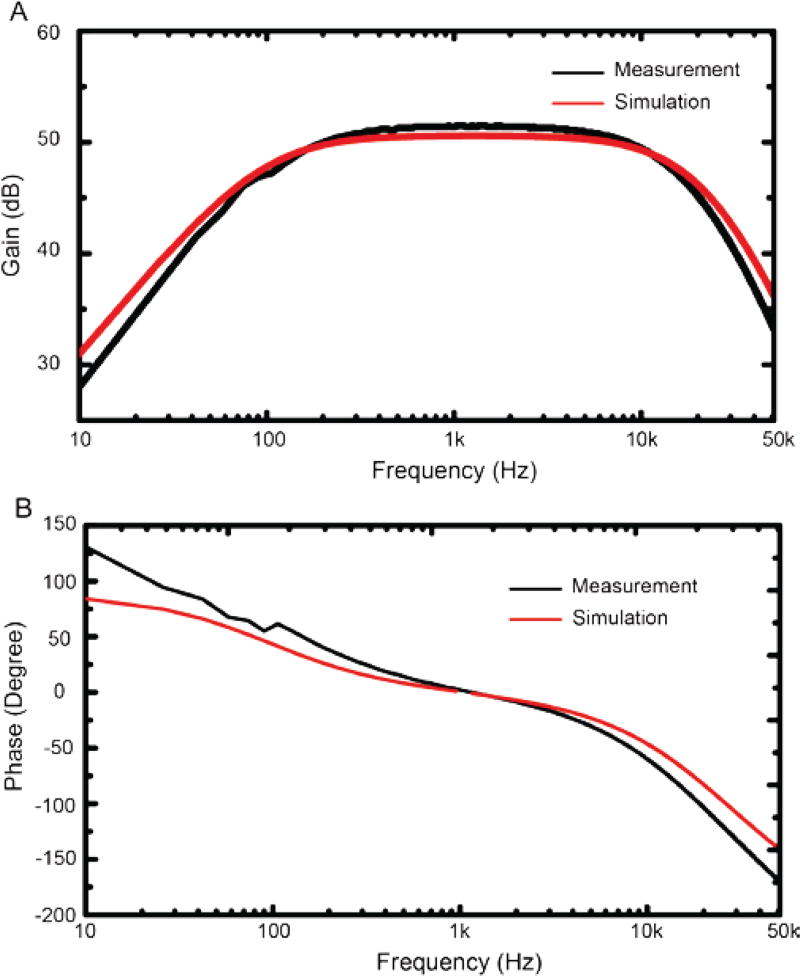
Several measurements on the amplifier of the IC were conducted to characterize the electric performance of the amplifier. The frequency responses of the simulated (red) and experimentally measured (black) results in both amplitude and phase are shown in Figure 6. The amplifier gain was measured to be ~51.5 dB in the pass-band and the 3-dB bandwidth of the amplifier was from 114 Hz to 14.62 kHz. The gain of ~51.5 dB was selected in the design phase to be large enough to measure small neural signals. Typically extracellular neural spikes are in the order of hundreds of micro-volts peak-to-peak, depending on the location of the electrode relative to the neuron, as well as the type of neuron. With this in mind, the design criteria was set to amplify neural voltages as low as 50 µVpp. A 51.5 dB gain will allow amplification of the 50 µVpp to 18.35 mVpp, which is ~60 times bigger than the binning resolution (0.3 mV) of a typical 16-bit analog-to-digital converter. As shown in Fig. 6, there is only a small discrepancy between the experimentally measured and the simulated frequency responses and this discrepancy is likely due to the expected manufacturing variations. To ensure that the manufacturing variations will not turn into performance instability, we performed a Monte Carlo simulation during the design phase to vary all the design parameters to ensure these small changes in the manufacturing process do not alter the overall performance of the amplifier.
Fig. 6.
Experimentally measured (black) and simulated (red) frequency response of the gain (A) and phase (B) of the high input impedance neural amplifier.
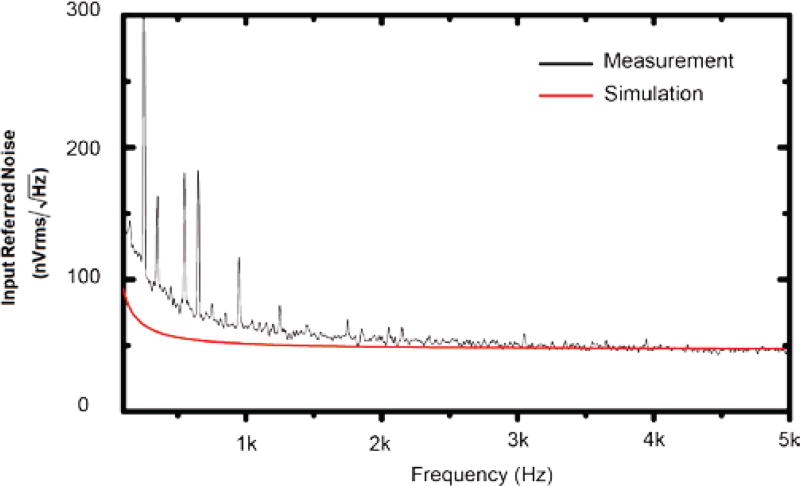
The experimentally measured (black) and the simulated (red) input referred noises of the neural amplifier are shown in Fig. 7. The noise was integrated between 300 to 5000 Hz, which covers the main frequencies of action potentials, for both simulated and experimentally measured noise were found to be 3.56 µVrms and 4.57 µVrms, respectively. The measured noise is 28% higher than the simulated noise and this difference is caused by the higher estimated resistances of the two input transistors M1 and M2 in the simulation. At this noise level, a minimum signal-to-noise ratio (SNR) of 2 can still be achieved for a 50 µVpp neural spike. The input capacitance of the amplifier was measured to be 9.7 pF.
Fig. 7.
Experimentally measured (black) and simulated (red) input referred noise of the high input impedance neural amplifier.
B. Animal testing of single cell extracellular recording and optogenetic inhibition
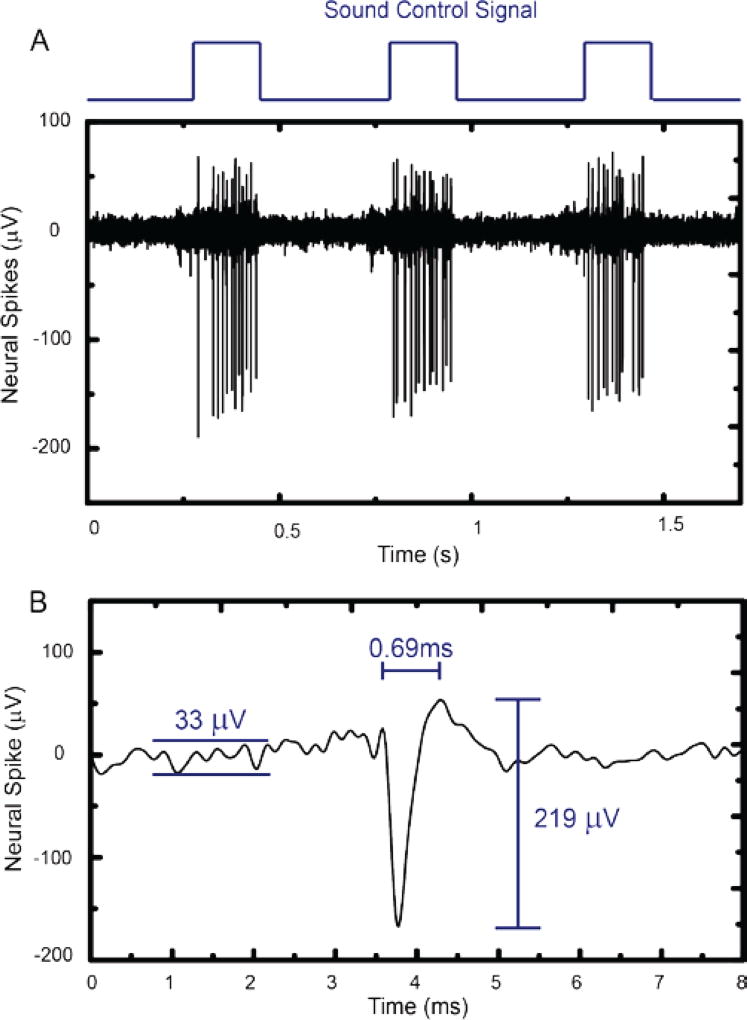
To test the performance of the high input impedance neural amplifier under experimental conditions, in-vivo extracellular neural measurements were performed to record action potentials of an anesthetized gerbil. Figure 8(a) plots a train of extracellularly recorded action potentials that was obtained when the electrode was placed in the inferior colliculus, an - auditory signal processing brain area. Tones with a sound frequency of 4520 Hz and an ON duration of 200 ms and an OFF duration of 300 ms were presented to the ears of the gerbil via earphones. Since the inferior colliculus is part of the auditory signal processing circuit in the brain [62], [63], neurons within the inferior colliculus sensitive to the sound frequency played to the ears will only fire action potentials when the sound stimulus is played [64]–[66]. Our recordings of neural activity shown in Fig. 8(a) reflect the occurrence of the neural spikes that correlated well with the sound stimulation. Neural spiking (measured spiking rate = 61.7 Hz) only occurred during the epoch when the sound stimulus was played. Fig. 8(b) shows a zoomed in plot of a typical extracellular action potential measured in this experiment. The action potential has a 219 µVpp amplitude and a 0.69 ms duration. The background noise during the non-firing period was estimated to be 33 µVpp. Thus, the SNR of the measured neural spike is ~6.6, which is sufficient for in-vivo neural experiments.
Fig. 8.
A) In-vivo recorded neural spikes in inferior colliculus from an anesthetized gerbil using the high input impedance amplifier. B) The zoom-in view of one of the neural spikes of A showing the measured peak-to-peak amplitude (219 µV), the pulse duration (0.69 ms) and the peak-to-peak noise level (33 µVpp).
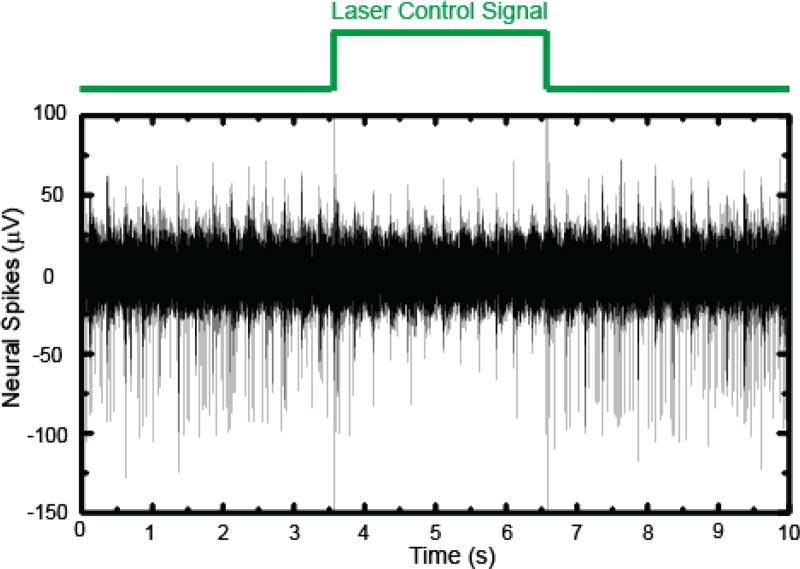
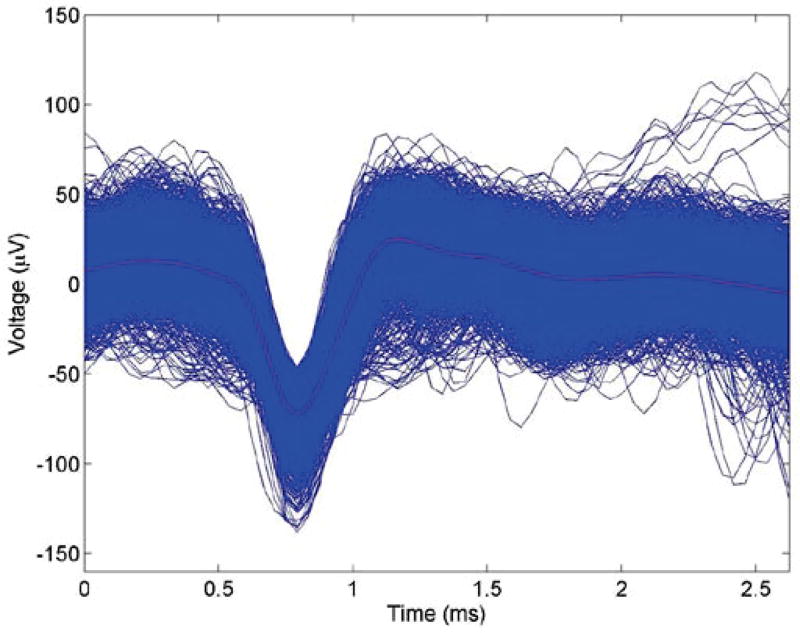
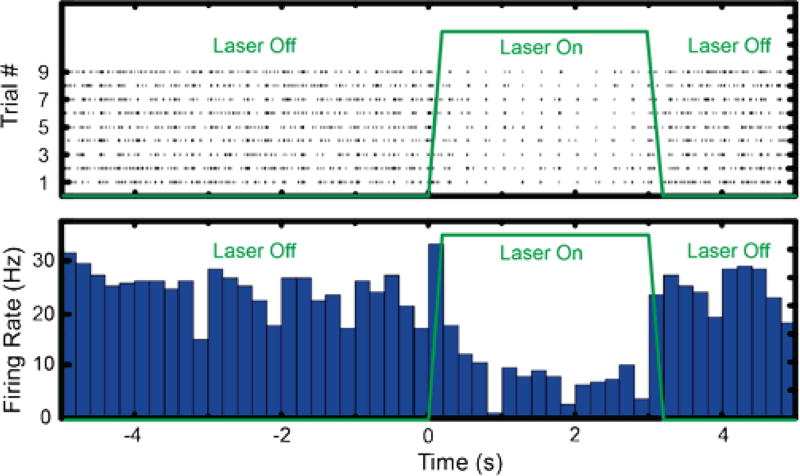
The IC has the capability of simultaneously recording extracellular action potentials and at the same time delivering light to the optrode and thereby manipulating neural activity with optogenetics. We demonstrated this unique functionality by inhibiting action potentials in neurons of the fifth nerve in the brainstem. In this experiment, the brain stem of the gerbil was injected with NpHR virus, and the animal recovered from the surgery and incubate the virus for several weeks. An optrode was later positioned in the same area for optogenetic manipulation. The animal was anesthetized, and neural firing was confirmed through the output of the IC. Then optical illuminations of 3 second durations were delivered through the optical fiber of the optrode to the brainstem to activate optogenetic proteins and thereby inhibit action potential firing. Figure 9 shows a 10 second recording of neural responses in the brainstem recording site, with a three second “laser on” silencing epoch. The amplitude and firing rate of neural spiking were observed to be significantly reduced during the laser illumination epoch, and action potential firing was recovered after optical illumination was ceased. From the raw recording trace shown in figure 9, action potentials fired by a single neuron were extracted with a custom python software. Figure 10 shows 2098 spikes (blue) fired by a single unit that was isolated from the recording trace, stacked on top of each other. The average wave form is plotted in black. All spikes have a very similar shape, which follows a typical extracellularly recorded action potential. This indicates that all the recorded action potentials originated from the same neuron. The 10 second recording with intermittent light stimulation protocol was repeated nine times and all nine trials showed similar silencing and recovering responses during and after optical illumination. Fig. 11(a) is a raster plot showing action potentials firing during the 10 second recording period for all 9 trials, and t = 0 and t = 3 s were aligned to the time when the laser is turned on and off respectively. Figure 11(b) is the calculated average firing rate per 100 ms time bin. Before the optical illumination at t < 0, the average firing rate was calculated to be 25.4 Hz. After optical illumination to inhibit the neuronal firing, the average firing rate dropped to 15.6 Hz in the first second and was stable at 7.5 Hz between 1<t<3 s; thus the inhibition rate is 3.4. After the optical illumination stopped after t > 3 s, the firing rate recovered to 24.8 Hz immediately. All nine trials showed the same inhibitory response of action potentials, as represented by the raster plot in Fig. 11.
Fig. 9.
Spontaneous action potential inhibition by optogenetic proteins in the 5th nerve of the brainstem during optical illumination of an anesthetized gerbil using our IC. Spontaneous action potential firing was significantly reduced during the three second epoch of optical illumination (green trace).
Fig. 10.
All the 2098 recorded spikes (blue) in Figure 9 were stacked together temporally. The calculated average spike (red) was also shown for comparison. The similar shape of the spikes indicates that the recorded spikes were originated from the same neuron.
Fig. 11.
(A) Raster plot showing the temporal locations of action potential firing over nine optogenetic inhibition trials. (B) The calculated average firing rate showing significant reduction of the firing rate during optical illumination.
C. Histology confirmed the anatomical location of the recording site
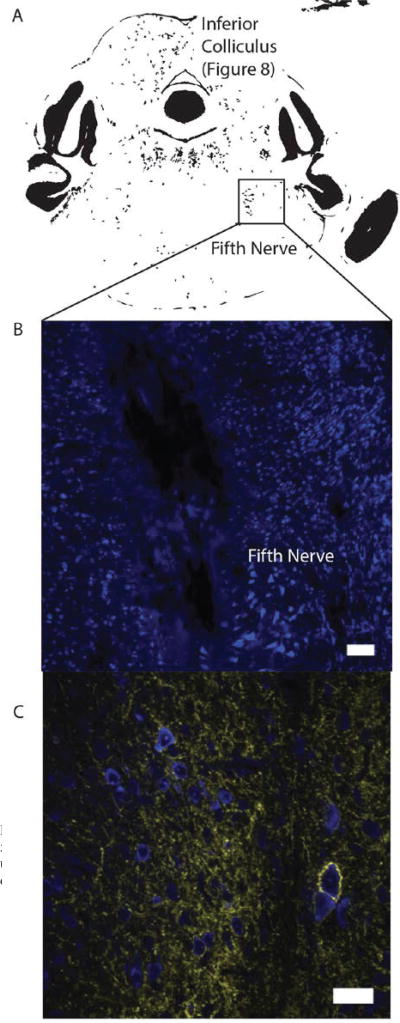
After conclusion of the electrophysiological and optogenetic experiments, each gerbils was sacrificed and transcardially perfused with paraformaldehyde. The brain was extracted and sliced with a vibratome. The brain slices containing the inferior colliculus and brainstem were imaged under a confocal microscope to confirm the optogenetic expression and the optrode placement. Figure 12 shows the viral expression in the recording site. There is high NpHR expression near the recording site as indicated by yellow fluorescence. This indicates that the action potential inhibition was likely caused by the NpHR. The recording site for this experiment was confirmed with the help of a gerbil brain atlas [67] to be the fifth nerve of the brainstem.
Fig. 12.
(A) A gerbil brain atlas showing recording sites for the measurements of Figs 8 and 9 for optogenetic inhibition. (B) Post-mortem histological image of Nissl staining (blue) surrounding the recording site (white bar = 100 µm) (C) Histological image of the same brain slice of (B) showing both Nissl (blue) and Halorhodopsin (yellow, yellow fluorescent protein-YFP). There was extensive Halorhodopsin expression near the recording site as indicated by YFP expression. (white bar = 25 µm).
VI. DISCUSSION
In this paper, we present the design of a single monolithic IC which consists of a high-impedance and low-noise neural amplifier for extracellular in-vivo recording and an adjustable current driver for simultaneous optogenetic stimulation or inhibition. In addition, we have demonstrated the capability of the IC by simultaneously recording and optogenetically inhibiting neurons in the gerbil brainstem. Specifically, spontaneous neural spiking of the fifth nerve in the brainstem of anesthetized gerbils was successfully recorded in-vivo and at the same time inhibited 3–4 fold by optical illumination. Simulations and experimental measurements were also performed to confirm that the neural amplifier has a good signal-to-noise ratio (SNR ~ 6.6) adequate for extracellular in-vivo neural recording. The high current LED/laser driver can produce a maximum current of 330 mA capable of driving a 50 mW 532 nm laser for optogenetic neural inhibition.
It is technically more challenging to inhibit than to excite action potentials because of the higher optical intensity required for optogenetic inhibition (~50 mW/mm2 vs ~10 mW/mm2). Therefore, action potentials stimulation should in principle be possible if not technically easier using the same IC, changing the illumination laser source to ~480 nm wavelength and injecting ChR virus to the animals - although we did not explicitly demonstrate this in the present study.
The noise performance of our amplifier design is on par with other state-of-art neural amplifier designs (the input referred noise in one particular design is 4.13 µVrms [34]). Comparatively, the measured input referred noise of our design is , which is very close to those of the others. The input referred noise of our design is also much lower than the estimated thermal noise of the 3 MΩ metal electrodes over a 5 kHz bandwidth. In addition, our amplifier has a low input capacitance optimized for extracellular neural single cell recordings, in contrast to other designs which are optimized for measuring the local field potential or multiple cell firing. The input capacitance of the amplifier is measured to be 9.3 pF, which is much lower than the typical electric double layer capacitor of a metal electrode (Ce ~ 50 pF) [6]. These two parameters satisfy the two requirements in the noise model analysis that 1) Cin ≪ Ce, and 2) . Therefore, the measured ~33 µVpp noise can be attributed to mostly dominating by the thermal noise of the metal electrode, which is the fundamental limiting factor of noise in the electrophysiological recording.
The main goal of the current design is to demonstrate the possibility of combining neural recording and optogenetic control in a single IC; therefore, only a single recording amplifier and a single current control unit were integrated in the current design. Current trends in neuroscience research, however, may require the use of multi-channel recording and optogenetic control to record neural circuits at several different brain regions to test various hypotheses of brain signal processing. In light of this, we are currently working on expanding and improving on our current design to incorporate multi-channel capability in both recording and optogenetic controls. This type of effort requires good circuit design skills, understanding of electrode designs, light delivery, brain surgery techniques, and mechanistic mounting of the system to successfully design an entire instrumentation package.
To the best of our knowledge, there are no previous attempts in the literature where neural recording is combined with optogenetic control in a single monolithic IC. This combination may allow new experimental designs to answer neuroscience problems previously difficult to answer, or to allow new treatments of neural disorders in the future. For instance, abnormal neural firing just before the onset epileptic seizures can be detected and countered via an optogenetic intervention [68]–[70]. In addition, we are currently working to add a wireless data communication model, a miniaturized LED light source, and a small and light-weight battery to our current design to create a “backpack” for small rodents. This “wearable” device will allow neuroscientists to conduct electrophysiology recording on animals for long-duration behavioral studies, and also allow manipulation of the neural circuits in real-time.
VII. CONCLUSION
In this paper, we have designed, fabricated and tested a single monolithic IC to perform simultaneous optogenetic neural inhibition and extracellular electrophysiological recording on a gerbil in-vivo. A low input capacitance (9.7 pF) amplifier particularly tailored for the use of high-impedance electrodes to conduct single neuron extracellular recording was integrated with programmable high current drivers for optogenetic stimulation or inhibition on the same IC chip. A noise model was derived including electronic interferences generated during optogenetic control. The noise model was then used to guide the IC design process to obtain parameters for optimal signal-to-noise ratio. The performance of the IC chip was demonstrated on an anesthetized gerbil expressed with inhibitory optogenetic protein (Halorhodopsin). Spontaneous action potentials from the fifth nerve of the brainstem were recorded by the amplifier and were subsequently inhibited by laser illumination. This IC allows conducting neuroscience research and neural engineering applications in an entire new direction and can potentially be used in treatments for human mental diseases in the future.
Supplementary Material
Fig. 4.
(a) A schematic diagram of the optrode showing the high impedance metal electrode and the optical fiber for optogenetic illumination. (b) A photograph of the optrode.
Acknowledgments
The authors would like to thank Drs. Anna Dondzillo and Otto Albrecht for providing technical guidance for the in-vivo optogenetic experiments.
This work was supported by the Science and Technology Development Fund of Macau (FDCT) under Grants 024/2009/A1, 087/2012/A3, and 047/2013/A2; The Research Committee of the University of Macau under Grants MYRG076(Y1-L2)-FST12-MPU, MYRG2014-00010-AMSV, MYRG079(Y1-L2)-FST12-VMI, MYRG103(Y1-L3)-FST13-VMI, and MRG014/MPU/2014/FST; The National Institutes of Health (NIH) NIDDK grant 1K25DK095232-01A1; and NIH/NIDCD Grant R01 DC011582. We acknowledge the Optogenetics and Neural Engineering Core at the University of Colorado supported in part by NIH/NINDS P30NS048154. Imaging experiments were performed in the University of Colorado Anschutz Medical Campus Advanced Light Microscopy Core supported in part by NIH/NCRR Colorado CTSI Grant Number UL1TR001082.
Contributor Information
Chang Hao Chen, State Key Laboratory of Analog and Mixed-Signal VLSI University of Macau, Macau, China; Department of Electrical and Computer Engineering, Faculty of Science and Technology, University of Macau, Macau, China.
Elizabeth A. McCullagh, Department of Physiology and Biophysics, University of Colorado School of Medicine, Aurora, Colorado, United States of America
Sio Hang Pun, State Key Laboratory of Analog and Mixed-Signal VLSI University of Macau, Macau, China.
Peng Un Mak, Department of Electrical and Computer Engineering, Faculty of Science and Technology, University of Macau, Macau, China.
Mang I Vai, State Key Laboratory of Analog and Mixed-Signal VLSI University of Macau, Macau, China; Department of Electrical and Computer Engineering, Faculty of Science and Technology, University of Macau, Macau, China.
Pui In Mak, State Key Laboratory of Analog and Mixed-Signal VLSI University of Macau, Macau, China; Department of Electrical and Computer Engineering, Faculty of Science and Technology, University of Macau, Macau, China.
Achim Klug, Department of Physiology and Biophysics, University of Colorado School of Medicine, Aurora, Colorado, United States of America.
Tim C. Lei, State Key Laboratory of Analog and Mixed-Signal VLSI University of Macau, Macau, China; Department of Electrical Engineering, University of Colorado Denver, Colorado, United States of America.
References
- 1.Cuevas J. Electrophysiological Recording Techniques. Reference Module in Biomedical Research. 2014 [Google Scholar]
- 2.Suter KJ, Smith BN, Dudek FE. Electrophysiological recording from brain slices. Methods. 1999;18(2):86–90. doi: 10.1006/meth.1999.0761. [DOI] [PubMed] [Google Scholar]
- 3.Williams M. Electrophysiological Techniques. Curr. Protoc. Pharmacol. 2007:10–12. [Google Scholar]
- 4.Wickenden AD. Overview of electrophysiological techniques. Curr. Protoc. Pharmacol. 2014;(SUPPL.64) doi: 10.1002/0471141755.ph1101s64. [DOI] [PubMed] [Google Scholar]
- 5.Bretschneider F, de Weille Jan R. Introduction to Electrophysiological Methods and Instrumentation. 2006 [Google Scholar]
- 6.Humphrey DR, Schmidt EM. Extracellular Single-Unit Recording Methods. In: Boulton AA, Baker GB, Vanderwolf CH, editors. Neurophysiological Techniques. Vol. 15. 1990. pp. 1–64. [Google Scholar]
- 7.Zhang F, Aravanis AM, Adamantidis A, de Lecea L, Deisseroth K. Circuit-breakers: optical technologies for probing neural signals and systems. Nat. Rev. Neurosci. 2007;8(8):577–581. doi: 10.1038/nrn2192. [DOI] [PubMed] [Google Scholar]
- 8.Grosenick L, Marshel JH, Deisseroth K. Closed-loop and activity-guided optogenetic control. Neuron. 2015;86(1):106–139. doi: 10.1016/j.neuron.2015.03.034. [DOI] [PMC free article] [PubMed] [Google Scholar]
- 9.Tye KM, Deisseroth K. Optogenetic investigation of neural circuits underlying brain disease in animal models. Nat. Rev. Neurosci. 2012;13(4):251–266. doi: 10.1038/nrn3171. [DOI] [PMC free article] [PubMed] [Google Scholar]
- 10.Chow BY, Han X, Dobry AS, Qian X, Chuong AS, Li M, Henninger Ma, Belfort GM, Lin Y, Monahan PE, Boyden ES. High-performance genetically targetable optical neural silencing by light-driven proton pumps. Nature. 2010;463(7277):98–102. doi: 10.1038/nature08652. [DOI] [PMC free article] [PubMed] [Google Scholar]
- 11.Deisseroth K. Optogenetics - Method of the Year. Nat. Methods. 2010:1–4. [Google Scholar]
- 12.Deisseroth K. Optogenetics. Nat. Methods. 2011;8(1):26–29. doi: 10.1038/nmeth.f.324. [DOI] [PMC free article] [PubMed] [Google Scholar]
- 13.Madisen L, Mao T, Koch H, Zhuo J, Berenyi A, Fujisawa S, Hsu Y-WA, Garcia AJ, Gu X, Zanella S, Kidney J, Gu H, Mao Y, Hooks BM, Boyden ES, Buzsáki G, Ramirez JM, Jones AR, Svoboda K, Han X, Turner EE, Zeng H. A toolbox of Cre-dependent optogenetic transgenic mice for light-induced activation and silencing. Nat. Neurosci. 2012;15(5):793–802. doi: 10.1038/nn.3078. [DOI] [PMC free article] [PubMed] [Google Scholar]
- 14.Gradinaru V, Zhang F, Ramakrishnan C, Mattis J, Prakash R, Diester I, Goshen I, Thompson KR, Deisseroth K. Molecular and Cellular Approaches for Diversifying and Extending Optogenetics. Cell. 2010;141(1):154–165. doi: 10.1016/j.cell.2010.02.037. [DOI] [PMC free article] [PubMed] [Google Scholar]
- 15.Cardin Ja, Carlén M, Meletis K, Knoblich U, Zhang F, Deisseroth K, Tsai L-H, Moore CI. Targeted optogenetic stimulation and recording of neurons in vivo using cell-type-specific expression of Channelrhodopsin-2. Nat. Protoc. 2010;5(2):247–254. doi: 10.1038/nprot.2009.228. [DOI] [PMC free article] [PubMed] [Google Scholar]
- 16.Zhao S, Ting JT, Atallah HE, Qiu L, Tan J, Gloss B, Augustine GJ, Deisseroth K, Luo M, Graybiel AM, Feng G. Cell type–specific channelrhodopsin-2 transgenic mice for optogenetic dissection of neural circuitry function. Nat. Methods. 2011;8(9):745–752. doi: 10.1038/nmeth.1668. [DOI] [PMC free article] [PubMed] [Google Scholar]
- 17.Kohara K, Pignatelli M, Rivest AJ, Jung H-Y, Kitamura T, Suh J, Frank D, Kajikawa K, Mise N, Obata Y, Wickersham IR, Tonegawa S. Cell type-specific genetic and optogenetic tools reveal hippocampal CA2 circuits. Nat. Neurosci. 2014;17(2):269–79. doi: 10.1038/nn.3614. [DOI] [PMC free article] [PubMed] [Google Scholar]
- 18.Budai D. Ultralow-noise headstage and main amplifiers for extracellular spike recording. Acta Biol. Szeged. 2004;48(1–4):13–17. [Google Scholar]
- 19.Millar J, Barnett TG. A low-noise optically isolated preamplifier for use with extracellular microelectrodes. J. Neurosci. Methods. 1994;51(2):119–122. doi: 10.1016/0165-0270(94)90001-9. [DOI] [PubMed] [Google Scholar]
- 20.Fried I, Rutishauser U, Cerf M, Kreiman G. Single Neuron Studies of the Human Brain: Probing Cognition. MIT Press; 2014. [Google Scholar]
- 21.Lenz Fa, Dostrovsky JO, Tasker RR, Yamashiro K, Kwan HC, Murphy JT. Single-unit analysis of the human ventral thalamic nuclear group: somatosensory responses. J. Neurophysiol. 1988;59(2):299–316. doi: 10.1152/jn.1988.59.2.299. [DOI] [PubMed] [Google Scholar]
- 22.Jasper H, Bertrand G. Thalamic units involved in somatic sensation and voluntary and involuntary movements in man. The thalamus. 1966 [Google Scholar]
- 23.Hubel D. Tungsten microelectrode for recording from single units. Science (80-.) 1957 doi: 10.1126/science.125.3247.549. [DOI] [PubMed] [Google Scholar]
- 24.Moore AK, Wehr M. A Guide to In vivo Single-unit Recording from Optogenetically Identified Cortical Inhibitory Interneurons. J. Vis. Exp. 2014;(93):1–9. doi: 10.3791/51757. [DOI] [PMC free article] [PubMed] [Google Scholar]
- 25.Guitchounts G, Markowitz JE, Liberti WA, Gardner TJ. A carbon-fiber electrode array for long-term neural recording. J. Neural Eng. 2013;10(4):046016. doi: 10.1088/1741-2560/10/4/046016. [DOI] [PMC free article] [PubMed] [Google Scholar]
- 26.Thompson LT, Best PJ. Long-term stability of the place-field activity of single units recorded from the dorsal hippocampus of freely behaving rats. Brain Res. 1990;509(2):299–308. doi: 10.1016/0006-8993(90)90555-p. [DOI] [PubMed] [Google Scholar]
- 27.Mooney R, Prather JF. The HVC microcircuit: the synaptic basis for interactions between song motor and vocal plasticity pathways. J. Neurosci. 2005;25(8):1952–1964. doi: 10.1523/JNEUROSCI.3726-04.2005. [DOI] [PMC free article] [PubMed] [Google Scholar]
- 28.Scott BB, Gardner T, Ji N, Fee MS, Lois C. Wandering Neuronal Migration in the Postnatal Vertebrate Forebrain. J. Neurosci. 2012;32(4):1436–1446. doi: 10.1523/JNEUROSCI.2145-11.2012. [DOI] [PMC free article] [PubMed] [Google Scholar]
- 29.Brette R, Destexhe A. Handbook of Neural Activity Measurement. Cambridge University Press; 2012. [Google Scholar]
- 30.Grover FS, Buchwald JS. Correlation of cell size with amplitude of background fast activity in specific brain nuclei. J. Neurophysiol. 1970 Jan.33(1):160–71. doi: 10.1152/jn.1970.33.1.160. [DOI] [PubMed] [Google Scholar]
- 31.Nicholson C, Llinas R. Field potentials in the alligator cerebellum and theory of their relationship to Purkinje cell dendritic spikes. J. Neurophysiol. 1971 Jul.34(4):509–31. doi: 10.1152/jn.1971.34.4.509. [DOI] [PubMed] [Google Scholar]
- 32.Legatt AD, Arezzo J, Vaughan HG. Averaged multiple unit activity as an estimate of phasic changes in local neuronal activity: effects of volume-conducted potentials. J. Neurosci. Methods. 1980 Apr.2(2):203–17. doi: 10.1016/0165-0270(80)90061-8. [DOI] [PubMed] [Google Scholar]
- 33.Majidzadeh V, Schmid A, Leblebici Y. Energy efficient low-noise neural recording amplifier with enhanced noise efficiency factor. IEEE Trans. Biomed. Circuits Syst. 2011;5(3):262–271. doi: 10.1109/TBCAS.2010.2078815. [DOI] [PubMed] [Google Scholar]
- 34.Ng KA, Xu YP. A multi-channel neural-recording amplifier system with 90dB CMRR employing CMOS-inverter-based OTAs with CMFB through supply rails in 65nm CMOS. Digest of Technical Papers - IEEE International Solid-State Circuits Conference. 2015;58:206–207. [Google Scholar]
- 35.Wattanapanitch W, Fee M, Sarpeshkar R. An energy-efficient micropower neural recording amplifier. IEEE Trans. Biomed. Circuits Syst. 2007;1(2):136–147. doi: 10.1109/TBCAS.2007.907868. [DOI] [PubMed] [Google Scholar]
- 36.Zhang F, Holleman J, Otis BP. Design of ultra-low power biopotential amplifiers for biosignal acquisition applications. IEEE Trans. Biomed. Circuits Syst. 2012;6(4):344–355. doi: 10.1109/TBCAS.2011.2177089. [DOI] [PubMed] [Google Scholar]
- 37.Olsson RH, Gulari MN, Wise KD. A fully-integrated bandpass amplifier for extracellular neural recording. International IEEE/EMBS Conference on Neural Engineering, NER. 2003;2003-Janua:165–168. [Google Scholar]
- 38.Harrison RR, Charles C. A low-power low-noise CMOS amplifier for neural recording applications. IEEE J. Solid-State Circuits. 2003;38(6):958–965. [Google Scholar]
- 39.Gosselin B, Sawan M, Chapman CA. A low-power integrated bioamplifier with active low-frequency suppression. IEEE Trans. Biomed. Circuits Syst. 2007;1(3):184–192. doi: 10.1109/TBCAS.2007.914490. [DOI] [PubMed] [Google Scholar]
- 40.Yin M, Ghovanloo M. A Low-Noise Preamplifier with Adjustable Gain and Bandwidth for Biopotential Recording Applications. 2007 IEEE Int. Symp. Circuits Syst. 2007:321–324. [Google Scholar]
- 41.Harrison RR, Watkins PT, Kier RJ, Lovejoy RO, Black DJ, Greger B, Solzbacher F. A low-power integrated circuit for a wireless 100-electrode neural recording system. IEEE J. Solid-State Circuits. 2007;42(1):123–133. [Google Scholar]
- 42.Fan D, Rich D, Holtzman T, Ruther P, Dalley JW, Lopez A, Rossi MA, Barter JW, Salas-Meza D, Herwik S, Holzhammer T, Morizio J, Yin HH. A wireless multi-channel recording system for freely behaving mice and rats. PLoS One. 2011;6(7) doi: 10.1371/journal.pone.0022033. [DOI] [PMC free article] [PubMed] [Google Scholar]
- 43.Yin M, Lee SB, Ghovanloo M. In vivo testing of a low noise 32-channel wireless neural recording system. Proceedings of the 31st Annual International Conference of the IEEE Engineering in Medicine and Biology Society: Engineering the Future of Biomedicine, EMBC 2009. 2009;2009:1608–1611. doi: 10.1109/IEMBS.2009.5333227. [DOI] [PMC free article] [PubMed] [Google Scholar]
- 44.Chen CH, Pun SH, Mak PU, Vai MI, Klug A, Lei TC. Circuit Models and Experimental Noise Measurements of Micropipette Amplifiers for Extracellular Neural Recordings from Live Animals. Biomed Res. Int. 2014;2014 doi: 10.1155/2014/135026. [DOI] [PMC free article] [PubMed] [Google Scholar]
- 45.Pashaie R, Baumgartner R, Richner TJ, Brodnick SK, Azimipour M, Eliceiri KW, Williams JC. Closed-Loop Optogenetic Brain Interface. IEEE Trans. Biomed. Eng. 2015 Oct.62(10):2327–37. doi: 10.1109/TBME.2015.2436817. [DOI] [PubMed] [Google Scholar]
- 46.Paralikar K, Cong P, Santa W, Dinsmoor D, Hocken B, Munns G, Giftakis J, Denison T. An implantable 5mW/channel dual-wavelength optogenetic stimulator for therapeutic neuromodulation research. Digest of Technical Papers - IEEE International Solid-State Circuits Conference. 2010;53:238–239. [Google Scholar]
- 47.Sawadsaringkarn Y, Kimura H, Maezawa Y, Nakajima A, Kobayashi T, Sasagawa K, Noda T, Tokuda T, Ohta J. CMOS On-Chip Optoelectronic Neural Interface Device with Integrated Light Source for Optogenetics. Journal of Physics: Conference Series. 2012;352:012004. [Google Scholar]
- 48.Zhang F, Wang L-P, Brauner M, Liewald JF, Kay K, Watzke N, Wood PG, Bamberg E, Nagel G, Gottschalk A, Deisseroth K. Multimodal fast optical interrogation of neural circuitry. Nature. 2007;446(7136):633–9. doi: 10.1038/nature05744. [DOI] [PubMed] [Google Scholar]
- 49.Han X, Qian X, Bernstein JG, Zhou H-H, Franzesi GT, Stern P, Bronson RT, Graybiel AM, Desimone R, Boyden ES. Millisecond-timescale optical control of neural dynamics in the nonhuman primate brain. Neuron. 2009;62(2):191–8. doi: 10.1016/j.neuron.2009.03.011. [DOI] [PMC free article] [PubMed] [Google Scholar]
- 50.Al-Juboori SI, Dondzillo A, Stubblefield EA, Felsen G, Lei TC, Klug A. Light Scattering Properties Vary across Different Regions of the Adult Mouse Brain. PLoS One. 2013;8(7) doi: 10.1371/journal.pone.0067626. [DOI] [PMC free article] [PubMed] [Google Scholar]
- 51.Popneuron. Optogenetics Apps. 2013 http://www.optogeneticsa pp.com/
- 52.Geddes L, Baker L. Principles of applied biomedical instrumentation. 1975 [Google Scholar]
- 53.Geddes LA. Historical evolution of circuit models for the electrode-electrolyte interface. Ann. Biomed. Eng. Jan.25(1):1–14. doi: 10.1007/BF02738534. [DOI] [PubMed] [Google Scholar]
- 54.Robinson D. The electrical properties of metal microelectrodes. Proc. IEEE. 1968 [Google Scholar]
- 55.Geddes LA. Historical evolution of circuit models for the electrode-electrolyte interface. Ann. Biomed. Eng. Jan.25(1):1–14. doi: 10.1007/BF02738534. [DOI] [PubMed] [Google Scholar]
- 56.Davidsen J, Schuster HG. Simple model for 1/f(alpha) noise. Phys. Rev. E. Stat. Nonlin. Soft Matter Phys. 2002;65(2):026120. doi: 10.1103/PhysRevE.65.026120. [DOI] [PubMed] [Google Scholar]
- 57.Martinez J, Pedreira C, Ison MJ, Quian Quiroga R. Realistic simulation of extracellular recordings. J. Neurosci. Methods. 2009 Nov.184(2):285–293. doi: 10.1016/j.jneumeth.2009.08.017. [DOI] [PubMed] [Google Scholar]
- 58.Cardin JA, Carlén M, Meletis K, Knoblich U, Zhang F, Deisseroth K, Tsai L-H, Moore CI. Driving fast-spiking cells induces gamma rhythm and controls sensory responses. Nature. 2009;459(7247):663–667. doi: 10.1038/nature08002. [DOI] [PMC free article] [PubMed] [Google Scholar]
- 59.Ayling OGS, Harrison TC, Boyd JD, Goroshkov A, Murphy TH. Automated light-based mapping of motor cortex by photoactivation of channelrhodopsin-2 transgenic mice. Nat. Methods. 2009;6(3):219–224. doi: 10.1038/nmeth.1303. [DOI] [PubMed] [Google Scholar]
- 60.Ng KA, Xu YP. A compact, low input capacitance neural recording amplifier. IEEE Trans. Biomed. Circuits Syst. 2013;7(5):610–620. doi: 10.1109/TBCAS.2013.2280066. [DOI] [PubMed] [Google Scholar]
- 61.Albrecht O, Dondzillo A, Mayer F, Thompson JA, Klug A. Inhibitory projections from the ventral nucleus of the trapezoid body to the medial nucleus of the trapezoid body in the mouse. Front. Neural Circuits. 2014 Jan.8:83. doi: 10.3389/fncir.2014.00083. [DOI] [PMC free article] [PubMed] [Google Scholar]
- 62.Oliver D, Huerta M. Inferior and Superior Colliculi. Mamm. Audit. Pathw. 2013 [Google Scholar]
- 63.Irvine D. Physiology of the auditory brainstem. Mamm. Audit. Pathw. Neurophysiol. 1992 [Google Scholar]
- 64.Pollak GK, Marsh DS, Bodenhamer R, Souther A. A single-unit analysis of inferior colliculus in unanesthetized bats: response patterns and spike-count functions generated by constant-frequency and frequency-modulated sounds. J. Neurophysiol. 1978 May;41(3):677–91. doi: 10.1152/jn.1978.41.3.677. [DOI] [PubMed] [Google Scholar]
- 65.Hind JE, Goldberg JM, Greenwood DD, Rose JE. Some discharge characteristics of single neurons in the inferior colliculus of the cat. II. Timing of the discharges and observations on binaural stimulation. J. Neurophysiol. 1963 Mar.26:321–41. doi: 10.1152/jn.1963.26.2.321. [DOI] [PubMed] [Google Scholar]
- 66.Aitkin LM, Fryman S, Blake DW, Webster WR. Responses of neurones in the rabbit inferior colliculus. I. Frequency-specificity and topographic arrangement. Brain Res. 1972 Nov.47(1):77–90. doi: 10.1016/0006-8993(72)90253-3. [DOI] [PubMed] [Google Scholar]
- 67.Loskota WJ, Lomax P, Verity MA. stereotaxic atlas of the Mongolian gerbil brain (Meriones unguiculatus) 1974 1928- [Google Scholar]
- 68.Bui AD, Alexander A, Soltesz I. Seizing Control: From Current Treatments to Optogenetic Interventions in Epilepsy. Neuroscientist. 2015 Dec. doi: 10.1177/1073858415619600. [DOI] [PMC free article] [PubMed] [Google Scholar]
- 69.Soper C, Wicker E, Kulick CV, N’Gouemo P, Forcelli PA. Optogenetic activation of superior colliculus neurons suppresses seizures originating in diverse brain networks. Neurobiol. Dis. 2016 Mar.87:102–15. doi: 10.1016/j.nbd.2015.12.012. [DOI] [PMC free article] [PubMed] [Google Scholar]
- 70.Han Yechao, Ma Feiqiang, Li Hongbao, Wang Yueming, Xu Kedi. Optogenetic control of thalamus as a tool for interrupting penicillin induced seizures. Conf. Proc. … Annu. Int. Conf. IEEE Eng. Med. Biol. Soc. IEEE Eng. Med. Biol. Soc. Annu. Conf. 2015 Aug.2015:6606–9. doi: 10.1109/EMBC.2015.7319907. [DOI] [PubMed] [Google Scholar]
Associated Data
This section collects any data citations, data availability statements, or supplementary materials included in this article.


