Abstract
Purpose
The purpose of this study was to evaluate mechanisms controlling secretory IgA (SIgA) production, thereby ensuring maintenance of ocular surface health.
Methods
To determine whether the presence of specific gut commensal species regulates SIgA levels and IgA transcripts in the eye-associated lymphoid tissues (EALT), specific-pathogen-free (SPF) Swiss Webster (SW) mice were treated with antibiotic cocktails, germ-free (GF) SW mice were reconstituted with diverse commensal gut microbiota, or monocolonized with gut-specific commensals. Proteomic profiling and quantitative real-time polymerase chain reaction (qRT-PCR) were used to quantify SIgA and IgA levels. 16S rDNA sequencing was carried out to characterize commensal microbiota.
Results
Commensal presence regulated ocular surface SIgA levels and mRNA IgA transcripts in EALT. Oral antibiotic cocktail intake significantly reduced gut commensal presence, while maintaining ocular surface commensal levels reduced SIgA and IgA transcripts in EALT. Analysis of gut microbial communities revealed that SPF SW mice carried abundant Bacteroides organisms when compared to SPF C57BL6/N mice, with B. acidifaciens being the most prominent species in SPF SW mice. Monocolonization of GF SW mice with B. acidifaciens, a strict gut anaerobe, resulted in significant increase of IgA transcripts in the EALT, implying generation of B-cell memory.
Conclusions
These data illustrated a “gut-eye” axis of immune regulation. Exposure of the host to gut commensal species may serve as a priming signal to generate B-cell repertoires at sites different from the gut, such as EALT, thereby ensuring broad protection.
Keywords: microbiota, SIgA, ocular surface proteome, 16S metagenomics
Distinct microbiota communities exist in the gut, lungs, skin, and at the ocular surfaces.1–8 Many studies have examined how resident commensal presence frames immune responses at different locations; however, much remains to be discovered about how these communities affect immunity at a distance.9,10 Toward this end, a recent study by de Paiva and colleagues11 has shown that when gut microbiota is perturbed by antibiotic treatments, ocular responses to desiccating stress are significantly influenced in a mouse model of Sjögren's syndrome. The trend is reversed in untreated controls, suggesting that gut microbiota perturbations can alter immunity at mucosal surfaces. Additional evidence of the impact of the gut microbiota on ocular immunity has come from the work of Nakamura and colleagues12 who observe that oral administration of antibiotics in a murine experimental autoimmune uveitis model improves uveitis scores, suggesting that there may be protective and uveitis-inducing populations of bacteria in the gut. These data have been expanded by the observation that retina-specific autoreactive T cells are developed in the gut and subsequently home to the retina, causing uveitis.13 Cumulatively, these studies advocate that maintenance of specific bacterial ecosystems in the gut affects ocular disease susceptibility. However, despite these initial studies, there is no knowledge about which specific commensal species or ecosystems of commensals influence ocular immunity. The latter question is what we began to tackle with this work.
With mounting evidence to suggest that gut microbiome perturbations are a causative factor in disease, the question of the contribution of an ocular microbiome to disease pathology also requires further examination. A study of changes in ocular microbiome constituents after infection with Chlamydia trachomatis, by Zhou and colleagues,14 reveals that age, environment, and exposure to disease are factors in altering the ocular microbiome. Dong and colleagues15 define a core ocular microbiome, using culturing and 16S sequencing methods. They note that the microbiome is made up of five phyla with 59 bacterial genera, of which 12 genera make up a “core” conjunctival microbiome in healthy subjects. Dong et al.,15 Willcox,16 and Huang et al.17 have recapitulated the observation that the ocular surface hosts a stable, paucibacterial microbiome (with potential transient members) relative to the surrounding skin and buccal mucosa. Of note, Dong et al.,15 specifically note two orders of magnitude fewer bacteria in the ocular microbiome than Huang et al.17 It has been speculated that the sparse bacterial population may be due to innate antimicrobial peptides, lysozyme, and other factors, such as mechanical clearance by blinking. Cumulatively, these studies provide the foundation to question which immune mechanisms ensure scarcity of the ocular microbiome.
Allansmith et al.18 have observed that germ-free (GF) rats have 5- to 8-fold lower IgA and IgM plasma cells in their lacrimal glands (LGs) than normal controls, before introduction into a conventional housing environment laden with normal antigens. A 4-week exposure to a normal housing environment is sufficient to raise secretory IgA (SIgA) levels in tears to those of normal rats.18 However, no direct correlation has been established in the study between microbial commensal communities and their niche occupancy in affecting ocular SIgA levels. Nonetheless, the data have pioneered the suggestion that commensals modulate SIgA at the ocular surfaces. In addition, we recently have reported a significant decrease in ocular SIgA in GF mice when compared to SPF SW harboring commensals.19 These studies prompted us to evaluate how and which commensal bacteria regulated SIgA presence at the ocular surfaces. We hypothesized that ocular immune homeostasis is predicated on host exposure to specific commensal organisms via the gut, resulting in a B-cell–mediated immune response, leading to local immune homeostasis. Further, we hypothesized that memory B cells created in response to initial exposure migrate throughout the body and take up residence in the LGs, subsequently responding to commensal-mediated challenges to prevent pathogenic bacteria from causing disease.
Here, we characterized baseline mouse strain differences in LG IgA expression by quantitative real time PCR (qRT-PCR), IgA ELISA, and quantitative liquid chromatography-tandem mass spectrometry (LC-MS/MS) analysis in mice that underwent microbiota reconstitutions to demonstrate that mouse strain genetics and gut microbiome influence levels of SIgA. Mechanistically, we demonstrated that IL-1β is essential for the expression of SIgA in eye-associated lymphoid tissues (EALT) and, consequently, at the ocular surfaces. We also showed that gut colonization with an obligate anaerobe, Bacteroides acidifaciens, has measurable and significant impact on levels of IgA transcripts in LGs, thereby providing experimental evidence for the existence of a “gut-eye” axis.
Materials and Methods
Ethics Statement
All animal experiments were performed according to the National Institutes of Health guidelines for housing and care of laboratory animals. All the experiments complied with institutional regulations after protocol review and approval by the Brigham and Women's Hospital Institutional Animal Care and Use Committee (BWH IACUC) Committee and were consistent with the ARVO Statement for the Use of Animals in Ophthalmic and Vision Research.
Mice
GF SW mice were purchased from the Gnotobiotic Core Facility (BWH). Age- and sex-matched SPF SW mice and SPF C57BL/6N were purchased from Taconic Farms (Germantown, NY, USA). Experiments were carried out with 8- to 10-week-old mice.
Eyewash Collection and Sample Preparation for LC-MS/MS Analysis
Eyewashes were collected from anesthetized mice as in the study of Kugadas et al.19 Ten microliters of PBS were applied to the ocular surface and pipetted 10 times without touching the ocular surface or skin. Each eye was washed twice (4 × 10 μL washes 20 μL per eye) and pooled together in one aliquot. Eyewashes from four to six mice were pooled. Eyewash protein content was quantified by BCA (bicinchoninic acid assay) Assay (Pierce; Rockford, IL, USA) and was stored at −20°C before usage. Twenty micrograms from the eyewashes was subjected to in-solution trypsin digestion. Briefly, 1/3 sample volume of 8 M urea containing 40 mM HEPES was added to each sample and sonicated in a rotating water bath at 4°C for 15 minutes (30 seconds on, 30 seconds off). The samples were then reduced with 10 mM dithiothreitol, alkylated with 55 mM iodoacetamide, followed by LysC and trypsin digestion overnight. The total sample volume was loaded onto C18 STAGE-tips (EmporeTM, IVA-Analysentechnik, Meerbusch, Germany) for purification.20 MS analysis was performed by using a Q Exactive HF quadrupole orbitrap mass spectrometer coupled on-line to a nanoflow UHPLC instrument (Easy nLC; Thermo Fisher Scientific, Waltham, MA, USA). Eluted peptides were separated over a 120-minute gradient on a reverse phase 50-cm-long C18 column (75-μm inner diameter, ReproSil-Pur C18-AQ 1.8-μm beads; Dr. Maisch GmbH, Ammerbuch-Entringen, Germany).
LC-MS/MS Data Analysis
Mass spectra were processed by using the MaxQuant computational platform version 1.5.5.5.21 The spectra were searched by the Andromeda search engine against the Mus musculus Uniprot sequence databases (acquired April 27, 2016). Quantification in MaxQuant was performed by using the label-free quantification (LFQ) algorithm,22 and “match between runs” was selected.
Depletion of Gut Microbiota by Oral Antibiotics
Four-week-old SPF SW mice were treated with an antibiotic cocktail in the drinking water as previously described.19,23,24
Gut Microbiome Profiling by 16S rDNA Sequencing
DNA was extracted from the fecal pellets with QIAamp DNA Stool Mini Kit (catalog No. 51504; Hilden, Germany). Quality of the DNA was checked by Agilent 2100 Bioanalyzer (Agilent, Santa Clara, CA, USA). Libraries were created by targeting the V4 region of the 16S rRNA gene, using qPCR according to the protocol available at www.earthmicrobiome.org/protocols-and-standards/16s/. Purified and size-selected libraries were subjected to pair end 2 × 150-bp cycle run on Illumina MiSeq (Zymo Research Corp., Irvine, CA, USA). The sequencing and analysis were performed by SeqMatic (Fremont, CA, USA). Illumina BaseSpace's 16S metagenomic application was used to analyze the FASTQ data. All reads obtained from pair end 2 × 150-bp cycle runs on Illumina MiSeq passed the quality check. Green genes database was used to classify reads with species level sensitivity. The Ribosomal Database Project (RD)-naïve Bayesian algorithm was used for classification. Illumina BaseSpace's 16S metagenomic application that used the sequences generated from pair end sequencing (longer reads compared to single end) did not require any upfront operational taxonomic unit clustering for the taxonomic classification. On average 97.5% of the reads were classified at least at a genus level. The unclassified reads constituted 2.4% with the standard deviation of 1.21%.
Monocolonization With Bacteroides acidifaciens
Five-week-old female GF-SW mice (n = 5) were orally gavaged with 108 B. acidifaciens organisms. Fecal pellets and eyewashes were collected on days 0, 7, 14, and 21. On day 21 post colonization, RNA was extracted from LGs, small intestine, and colon.
IL-1β Blocking
SPF SW mice were treated with 100 μg anti–IL-1β antibody (clone B122, No. BE0246; BioXCell, West Lebanon, NH, USA) or isotype control (Armenian Hamster IgG BioXCell, No. BE0091) IP. After 24 hours, mice were euthanized and cervical lymph nodes (CLNs), LGs, serum, and eyewashes were collected for analysis.
Tissue and Stool Sample Preparation
Tissue samples were mechanically homogenized in Trizol (Thermo Fisher) before processing for RNA by using the Direct-zol RNA mini Prep (Catalog No: R2050; USA) according to manufacturer's guidelines. Stool samples were homogenized in PBS and centrifuged at 10,000g for 5 minutes at 4°C. Supernatants were collected, protein quantified by Bradford assay, and stored at −80°C supplemented with protease inhibitors (Roche, Indianapolis, IN, USA).
Quantitative RT-PCR
One-step RT-PCR was performed by using the Power SYBR Green RNA to Ct 1-Step Kit (Applied Biosystems, Foster City, CA, USA) in CFX Connect Real Time PCR Detection System (BioRad, Hercules, CA, USA). Relative fold changes in the mRNA expression levels were calculated according to Livak and Schmittgen.25 The following primers were used to quantify transcripts in the tissue samples: immunoglobulin A (IgA) F: 5′CCTAGTGTTTGAGCCCCTAA3′ and IgAR: 5′GGAAGTGCAGGGATACTTTG3′; glyceraldehyde 3-phosphate dehydrogenase (GAPDH)_F: 5′GATTCCACCCATGGCAAATTC3′ and GAPDH_R: 5′TGGGATTTCCATTGATGACAAG3′.
IgA ELISA
SIgA was quantified by using Mouse IgA ELISA Ready-SET-Go (eBioscience, Vienna, Austria) per manufacturer's instructions.
Statistical and Bioinformatics Analysis
Bioinformatics analysis of the LC-MS/MS data was performed in the Perseus software environment version 1.5.5.5.26 Data were filtered for common contaminants, log2 transformed; only those proteins which were present in duplicate within at least one sample set were used for further statistical analysis (valid-value filter of 2 in at least one group), and missing values were imputed from a normal distribution. Two-sample Student's t-tests were performed to identify proteins with a significant differential expression (P value < 0.05) in SPF C57BL6/N and SW-derived samples, using a 5% permutation-based false discovery rate (FDR) filter.
Normally distributed data were analyzed by Student's t-test or 1-way ANOVA analysis followed by Dunnett's multiple comparison (ANOVA). P < 0.05 was considered significant. GraphPad (PRISM; San Diego, CA, USA) was used to analyze and plot the results.
Results
Ocular SIgA Levels Differ in Genetically Distinct Strains of Mice
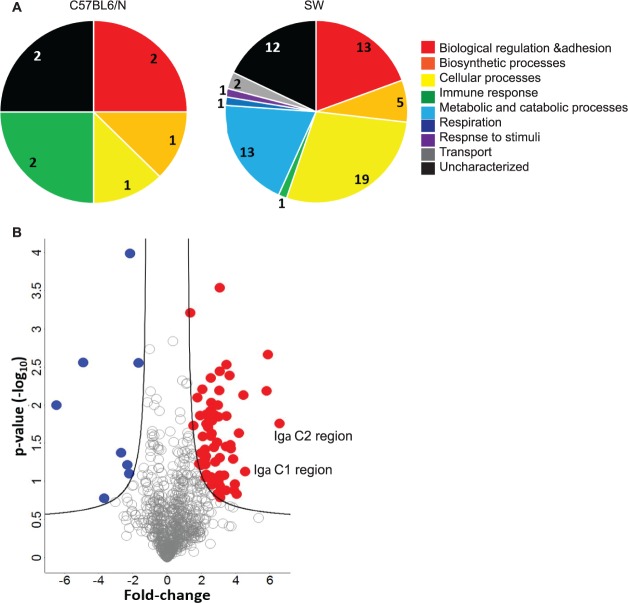
We compared the ocular surface proteomes of SPF SW and SPF C57BL/6N mice by using quantitative mass spectrometry–based proteomics. Following stringent filtering, in which each protein must be identified in duplicate in at least one sample set, and imputation of missing values from a normal distribution, 793 unique proteins were identified in SPF SW and SPF C57BL/6N mice and used for the subsequent analyses (Supplementary Table S1). We next used a Student's t-test (P value < 0.05) adjusted for multiple hypothesis testing (FDR < 0.05) to identify 75 proteins with significant changes in protein abundance between the different genetic backgrounds (Supplementary Table S1). A significant increase in abundance was observed for 67 proteins in the SPF SW samples as compared to 8 proteins in the SPF C57BL/6N (Fig. 1). A functional overview of the significantly different proteins, based on gene ontology biological processes classification, highlights the diversity of proteins detected in both genetic backgrounds (Fig. 1). Specifically, proteins associated with cellular, metabolic, and catabolic processes, as well as respiration, response to stimulus, and transport, showed an increase in representation in the SPF SW mice when compared to the SPF C57BL/6N. Among the SPF SW significant outliers, SIgA showed a significant increase in abundance when compared to the abundance of SIgA in the ocular surface washes of SPF C57BL/6N mice.
Figure 1.
Quantitative LC-MS/MS analysis reveals distinct ocular surface proteomic signatures in SPF SW and SPF C57BL/6N mice. (A) Functional analysis of ocular surface proteomes in SPF C57BL/6N and SPF SW mice, based on relative representation of biological processes. (B) Volcano plot differentially expressed ocular surface proteins in SPF SW and SPF C57BL/6N mice. Proteins with significant change in relative abundances in SPF SW mice are shown in red, while those in the SPF C57BL6/N mice are depicted in blue (see Supplementary Table S1 for protein ID).
To further support the LC-MS/MS data, qPCR analysis of EALT, including LGs and CLNs derived from SPF SW and SPF C57BL/6N mice, was performed. Levels of IgA transcripts in SPF SW mice were significantly higher than in C57BL/6N mice with a 6.25- (P < 0.0001) and 142-fold (P = 0.001) increase of IgA transcripts in the CLNs and LGs, respectively (Fig. 2). Taken together, these data demonstrated that different mouse strains have distinct relative basal abundance of SIgA, which is likely due either to strain-specific genetic differences or distinct commensal species.
Figure 2.
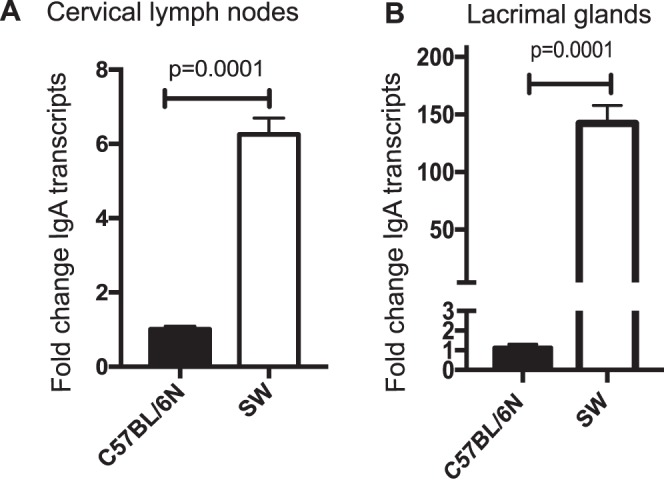
IgA transcript levels differ in genetically distinct strains of mice. CLNs (A) and LGs (B) were harvested from 8- to 10-week-old SPF SW and SPF C57BL/6N mice, processed for total RNA, and analyzed for IgA gene expression with qPCR. Expression was determined as n-fold change induction as compared with the GAPDH housekeeping gene. The significance of differences, based on a Student's t-test, relative to an SPF C57BL/6N control was plotted. Data are representative of two separate experiments including four to seven mice per group. The data demonstrate elevated levels of IgA transcripts in SPF SW EALT.
Microbiota Promotes Generation of Ocular SIgA Levels
To evaluate the relative contribution of commensal presence on ocular SIgA, we treated SPF SW mice with an antibiotic cocktail in the drinking water, shown to significantly reduce gut bacterial commensal presence, while preserving microbiota at other sites such as the skin and conjunctiva.19 Upon completion of treatment, LGs were harvested and IgA transcript levels were quantified. It was noted that antibiotic (ABX)–treated mice had significantly lower levels of LG IgA transcripts than untreated controls (P = 0.0011), illustrating the impact of gut microbiota on the abundance of IgA transcripts (Fig. 3A).
Figure 3.
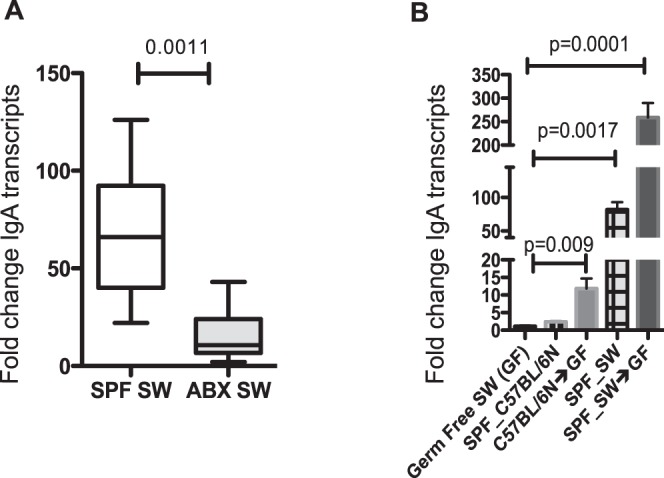
Gut commensal bacteria influence LG IgA transcription. (A) LG tissue was recovered from SPF SW (n = 7) and ABX-treated SPF SW (n = 7) mice and analyzed for IgA gene expression. Data were plotted as median values with range, and P values were determined by the Mann-Whitney test. (B) GF SW mice were reconstituted with SPF C57BL/6N or SPF SW gut homogenate. LGs were extracted and analyzed for IgA gene expression. Expression was determined as n-fold change induction as compared with the GAPDH housekeeping gene. Data were analyzed by 1-way ANOVA followed by Dunnett's comparisons. Five mice per group were analyzed. Data show that the GF SW mice reconstituted with SPF SW gut commensals induce higher levels of LG IgA transcripts than GF SW mice reconstituted with SPF C57BL/6N gut commensals.
To determine if gut commensal ecosystems can reconstitute IgA transcript levels in the LGs, GF SW mice were orally gavaged with fecal homogenate derived from either SPF C57BL/6N or SPF SW mice. Donor type selection was based on the significant differences in the detected SIgA levels. One-way ANOVA analysis of IgA qPCR of LG tissues showed significant fold increases of 11.8 (P = 0.0017) and 259 (P = 0.001) in GF SW mice gavaged with SPF C57BL/6N gut commensals and GF SW mice gavaged with SPF SW gut commensals, respectively (Fig. 3B).
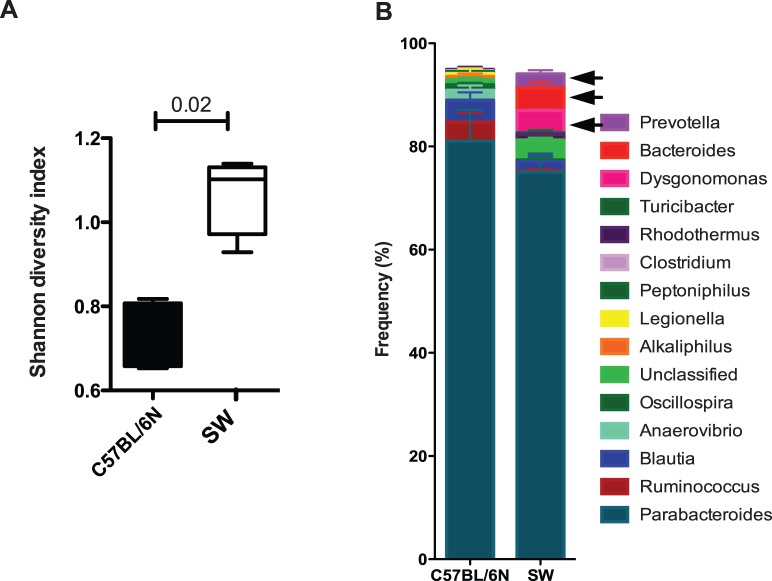
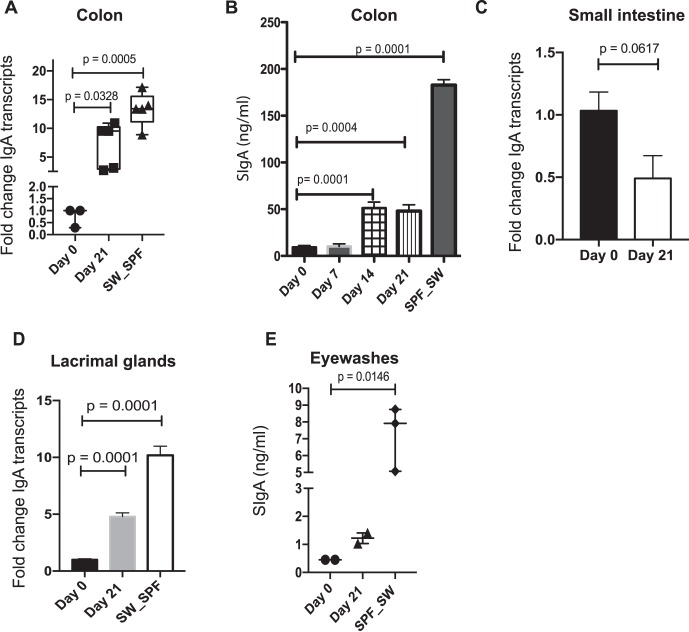
To confirm the expectation that the gut commensals of SPF SW and SPF C57BL6/N mice were diverse, 16S ribosomal sequencing analysis was undertaken. This characterization demonstrated that SPF SW mice harbored increased diversity of gut commensals when compared to the SPF C57BL6/N mice (Fig. 4A). Bacteroides was the most prominent genus in SW mice (Fig. 4B). We chose to evaluate the impact of the obligate anaerobe B. acidifaciens, an abundant gut commensal identified in SPF SW mice, on inducing IgA transcripts in the gut and EALT. Upon monocoloization, a 9.5-fold increase in IgA transcripts (P = 0.0328, 1-way ANOVA with Dunnett's comparisons test; Fig. 5) was noted in the colons at 21 days relative to day 0. Interestingly, LG IgA mRNA transcript levels at 21 days also increased 4.8-fold (P = 0.0001, 1-way ANOVA with Dunnett's comparison) relative to day 0. Gut SIgA protein levels increased after 14 days (51 ng/mL, P = 0.0001, 1-way ANOVA with Dunnett's multiple comparisons test) than that of day 14 (48 ng/mL, P = 0.0002, 1-way ANOVA with Dunnett's multiple comparisons test), implying reconstitution of the gut compartment. Analysis of transcript levels in the LGs showed that monocolonization with B. acidifaciens significantly increased IgA transcript levels (Fig. 5). However, analysis of pooled eyewash samples did not yield a significant increase in SIgA protein relative to GF controls at day 21 after colonization (1.2 ng/mL, P > 0.05) (Fig. 5). Taken together, these data confirm that B. acidifaciens is instrumental in stimulating the production of IgA transcripts in EALT and SIgA in the colon. Monocolonization with B. acidifaciens, a strain that does not inhabit ocular mucosal sites, upregulated IgA transcript levels in LGs but did not affect surface SIgA, indicative of the need for additional stimulation.
Figure 4.
SPF SW mice show richer commensal gut composition than SPF C57BL/6N mice. (A) 16S sequencing analysis of gut commensal communities of SPF SW (n = 3) and SPF C57BL/6N (n = 3) mice show significant differences in the abundance of specific commensal genera by Shannon index of diversity. (B) Plotted data represent 95% of recovered 16S rDNA sequences per genotype. Data are presented as mean percentage frequencies for each genus. P values were generated by using Student's t-test and the Bonferroni correction for multiple comparisons was applied, P < 0.02. Note that Bacteroides spp., Prevotella spp., and Dysgonomonas spp. were detected in SPF SW mice but were less prominent in SPF C57BL/6N mice.
Figure 5.
IgA increases at multiple mucosal sites after recolonization of GF SW mice with Bacteroides acidifaciens. GF SW mice (n = 5–7) were orally gavaged with (1 × 10⁸ CFU/mL) B. acidifaciens and kept in GF housing for 21 days. (A) Significance of changes in the colon IgA gene transcripts over time was determined by 1-way ANOVA followed by Dunn's comparison test. (B) Stool samples were assayed for SIgA by ELISA. Significance of changes in gut SIgA over time was determined by 1-way ANOVA followed by Dunnett's comparison test. (C) Changes in IgA transcript levels in the small-intestine samples. Significance was determined by Student's t-test. (D) Significance of changes in LG IgA transcripts over time was determined by 1-way ANOVA followed by Dunnett's comparison test. (E) Pooled eyewash samples were collected from mice and analyzed for IgA by ELISA. Significance of changes in eyewash SIgA over time was determined by 1-way ANOVA followed by Dunn's comparison test. Cumulatively, the data show that gut reconstitution of GF SW mice with B. acidifaciens induced a robust gut and ocular IgA transcription.
Microbiota-Induced IL-1β Promotes SIgA Levels
IL-1β ELISA on serum from GF and SPF SW mice showed that the GF SW mice had approximately 50% less baseline serum IL-1β (7.5 pg/mL GF versus 15.5 pg/mL SPF SW, P < 0.0045, Student's t-test) when compared to the SPF SW control (Fig. 6). To determine if systemic IL-1β was a significant factor in the modulation of IgA transcription in EALT, IL-1β–blocking antibody was administered to SPF SW mice. Quantitative PCR analysis of the CLNs and LGs for IgA transcripts showed significantly lower levels of IgA than for isotype controls (CLNs: 1.6-fold reduction, P = 0.0329; LGs: 2-fold reduction, P = 0.0002, Student's t-test) (Fig. 6). Further analysis of eyewashes for SIgA confirmed the LG IgA data (control IgA concentration: 0.92 ng/mL, IL-1β block concentration: 0.15 ng/mL, P = 0.0454, Student's t-test), suggesting that IL-1β is required for maintaining LG IgA mRNA transcript and surface protein levels in SPF SW mice. Taken together, these data suggest that IL-1β is a crucial component in regulating B-cell IgA production in LGs.
Figure 6.
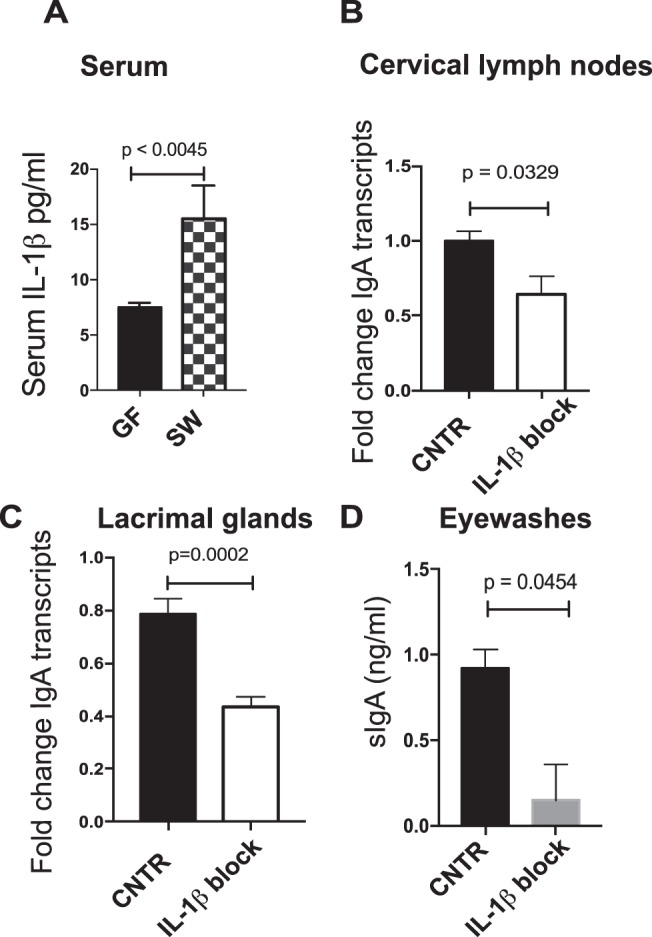
Systemic IL-1β blockade modulates IgA production in the LG. (A) ELISA for serum IL-1β levels in GF SW and SPF SW mice. Significance was determined by a Student's t-test. Cervical lymph nodes (B) and LGs (C) were harvested from SPF SW mice after systemic IL-1β antibody treatment and analyzed for IgA gene expression by using qRT-PCR. Significance was determined by a Student's t-test. Control mice received isotype control treatment. (D) Pooled eyewash samples were collected 24 hours after administration of an IL-1β blockade and were assayed for SIgA by ELISA. Significance was determined by a Student's t-test. Cumulatively, data show that ocular SIgA concentration at steady state depends on IL-1β signaling.
Discussion
Here, we provided experimental evidence that ocular SIgA is influenced by the genetic background and microbiota. Mass spectrometry analysis of SPF C57BL/6N and SPF SW mice demonstrated lower abundance of surface SIgA in C57BL/6N mice than in SPF SW mice (Fig. 1). Consistently, a comparison of IgA transcripts in EALT by qRT-PCR confirmed the higher levels of IgA transcripts in the SPF SW mice. Further, we found a correlation between gut commensal diversity and SIgA levels, indicative of a mechanism. The SPF SW mice presented with richer gut commensal diversity than the SPF C57BL/6N mice and this correlated with elevated levels of IgA transcripts and SIgA.
Our findings are reminiscent of, but extend, the recent observations that BALB/c mice have a richer microbial diversity and higher IgA expression than C57BL/6J mice in the gut. Fecal transplant studies27 indicate that C57BL/6J mice are genetically predisposed to having less diverse microbiome. Fransen et al.27 have demonstrated a correlation between commensal diversity and SIgA levels in colon. However, SIgA levels at distant mucosal sites were not evaluated. Further, since subsequent experiments have demonstrated niche dependence for the generation of SIgA,28 we questioned whether LG IgA transcript levels, and potentially ocular surface SIgA, changed depending on gut microbiota.
We observed that when GF SW mice were engrafted with SPF SW– or SPF C57BL/6N–derived microbiota, the rise in relative IgA transcripts was more prominent in the SPF SW–engrafted recipients (Fig. 3). These data support the conclusion that gut commensal diversity correlates with IgA transcript levels, as GF SW engrafted with SPF C57BL/6N–derived microbiota had significantly lower transcript levels and lower diversity.
As expected, 16S bacterial metagenomic profiling demonstrated different gut commensal diversity in the two genotypes of mice, with the Bacteroides genus being more prominent in the SPF SW mice (Fig. 3). Among the identified commensal species in the SPF SW mice, B. acidifaciens was highly abundant in SPF SW mice. B. acidifaciens is a gut commensal and an obligate anaerobe, which has been linked to colon IgA production.28 When GF SW mice were monocolonized with B. acidifaciens, qRT-PCR analysis for colon IgA transcripts demonstrated a significant rise in the IgA transcripts, which translated into elevated SIgA (Fig. 5). No increases in the small-intestine IgA transcripts were noted in agreement with data by Yanagibashi et al.28 These data illustrate a significant role of B. acidifaciens in promoting SIgA synthesis. Of note, not all commensal species that belong to the Bacteroides genus induce SIgA expression in the gut. Recent monocolonization experiments have revealed that colonization with B. fragilis promotes SIgA, whereas B. ovatus does not, while B. uniformis inhibits SIgA, illustrating commensal-specific responses, rather than genus-specific responses in the gut.29
Interestingly, analysis of LG IgA transcripts at day 21 showed a significant increase in IgA transcript levels when compared to GF controls. Moreover, since the analysis of eyewash protein levels did not yield a significant increase of SIgA in the monocolonized mice when compared to GF SW control, we concluded that a secondary priming signal from the ocular surface may be required for IgA secretion. Consistently, the monocolonized mice did not present recoverable commensal species form the ocular surface upon swabbing (data not shown).
Our observations suggest a model where naïve B cells are exposed to commensal-derived signals in the gut, class-switch, and initiate IgA production in the colonic compartment. Thereafter, a subset of effector or memory cells may traffic from the colon and enter the LGs. The idea of potential trafficking of B cells from the gut to the LGs is intriguing and is supported by the observation that B cells traffic between mesenteric lymph nodes and LGs. Oral administration of a di-nitrophenylated type III pneumococcal vaccine results in consistent SIgA secretion in tears as a response to continued GI vaccine administration, hinting at the possibility of “continuous but variable” populations of IgA-secreting cells flowing in and out of the LGs.
Our data also suggest that generation of SIgA is IL-1β dependent in SW mice. IL-1β–induced expression of lymphotoxin α and β induced nitric oxide synthase and maintained populations of retinoic acid–related orphan receptor γ t-positive innate lymphoid cells (ROR-γt+I ILCs), which are known contributors to IgA class switching. Consistently, IL-1β knockout mice showed a breakdown in IgA-mediated gut immune homeostasis and a significant decline in Bacteroides genus.30,31 Cumulatively, data suggest a contribution for IL-1β signaling in regulating IgA production, a finding that has significant implications for ocular immune homeostasis in health and disease.
Supplementary Material
Acknowledgments
The authors thank L. Comstock, PhD (Department of Medicine, Brigham and Women's Hospital, Boston, MA, USA) for kindly providing the Bacteroides acidifaciens isolate.
Supported by National Institutes of Health/National Eye Institute Grant R01EY022054 (MG).
Disclosure: A. Kugadas, None; Q. Wright, None; J. Geddes-McAlister, None; M. Gadjeva, None
References
- 1. . D'Argenio V, Salvatore F. . The role of the gut microbiome in the healthy adult status. Clin Chim Acta. 2015; 451: 97– 102. [DOI] [PubMed] [Google Scholar]
- 2. . Scharschmidt TC, Vasquez KS, Pauli ML,et al. . Commensal microbes and hair follicle morphogenesis coordinately drive Treg migration into neonatal skin. Cell Host Microbe. 2017; 21: 467– 477.e5. [DOI] [PMC free article] [PubMed] [Google Scholar]
- 3. . Naik S, Bouladoux N, Wilhelm C,et al. . Compartmentalized control of skin immunity by resident commensals. Science. 2012; 337: 1115– 1119. [DOI] [PMC free article] [PubMed] [Google Scholar]
- 4. . Foulongne V, Sauvage V, Hebert C,et al. . Human skin microbiota: high diversity of DNA viruses identified on the human skin by high throughput sequencing. PLoS One. 2012; 7: e38499. [DOI] [PMC free article] [PubMed] [Google Scholar]
- 5. . Grice EA, Kong HH, Conlan S,et al. . Topographical and temporal diversity of the human skin microbiome. Science. 2009; 324: 1190– 1192. [DOI] [PMC free article] [PubMed] [Google Scholar]
- 6. . Avila M, Ojcius DM, Yilmaz O. . The oral microbiota: living with a permanent guest: DNA and cell biology. 2009; 28: 405– 411. [DOI] [PMC free article] [PubMed] [Google Scholar]
- 7. . Farage M, Maibach H. . Lifetime changes in the vulva and vagina. Arch Gynecol Obstet. 2006; 273: 195– 202. [DOI] [PubMed] [Google Scholar]
- 8. . Beck JM, Young VB, Huffnagle GB. . The microbiome of the lung. Transl Res. 2012; 160: 258– 266. [DOI] [PMC free article] [PubMed] [Google Scholar]
- 9. . Belkaid Y, Naik S. . Compartmentalized and systemic control of tissue immunity by commensals. Nat Immunol. 2013; 14: 646– 653. [DOI] [PMC free article] [PubMed] [Google Scholar]
- 10. . Costello EK, Lauber CL, Hamady M, Fierer N, Gordon JI, Knight R. . Bacterial community variation in human body habitats across space and time. Science. 2009; 326: 1694– 1697. [DOI] [PMC free article] [PubMed] [Google Scholar]
- 11. . de Paiva CS, Jones DB, Stern ME,et al. . Altered mucosal microbiome diversity and disease severity in Sjogren syndrome. Sci Rep. 2016; 6: 23561. [DOI] [PMC free article] [PubMed] [Google Scholar]
- 12. . Nakamura YK, Metea C, Karstens L,et al. . Gut microbial alterations associated with protection from autoimmune uveitis. Invest Ophthalmol Vis Sci. 2016; 57: 3747– 3758. [DOI] [PMC free article] [PubMed] [Google Scholar]
- 13. . Horai R, Zarate-Blades CR, Dillenburg-Pilla P,et al. . Microbiota-dependent activation of an autoreactive T cell receptor provokes autoimmunity in an immunologically privileged site. Immunity. 2015; 43: 343– 353. [DOI] [PMC free article] [PubMed] [Google Scholar]
- 14. . Zhou Y, Holland MJ, Makalo P,et al. . The conjunctival microbiome in health and trachomatous disease: a case control study. Genome Med. 2014; 6: 99. [DOI] [PMC free article] [PubMed] [Google Scholar]
- 15. . Dong Q, Brulc JM, Iovieno A,et al. . Diversity of bacteria at healthy human conjunctiva. Invest Ophthalmol Vis Sci. 2011; 52: 5408– 5413. [DOI] [PMC free article] [PubMed] [Google Scholar]
- 16. . Willcox MD. . Characterization of the normal microbiota of the ocular surface. Exp Eye Res. 2013; 117: 99– 105. [DOI] [PubMed] [Google Scholar]
- 17. . Huang Y, Yang B, Li W. . Defining the normal core microbiome of conjunctival microbial communities. Clin Microbiol Infect. 2016; 22: 643.e7– e12. [DOI] [PubMed] [Google Scholar]
- 18. . Allansmith MR, Gudmundsson OG, Hann LE,et al. . The immune response of the lacrimal gland to antigenic exposure. Curr Eye Res. 1987; 6: 921– 927. [DOI] [PubMed] [Google Scholar]
- 19. . Kugadas A, Christiansen SH, Sankaranarayanan S,et al. . Impact of microbiota on resistance to ocular Pseudomonas aeruginosa-induced keratitis. PLoS Pathog. 2016; 12: e1005855. [DOI] [PMC free article] [PubMed] [Google Scholar]
- 20. . Rappsilber J, Mann M, Ishihama Y. . Protocol for micro-purification, enrichment, pre-fractionation and storage of peptides for proteomics using StageTips. Nat Protoc. 2007; 2: 1896– 1906. [DOI] [PubMed] [Google Scholar]
- 21. . Cox J, Mann M. . MaxQuant enables high peptide identification rates, individualized p.p.b.-range mass accuracies and proteome-wide protein quantification. Nat Biotechnol. 2008; 26: 1367– 1372. [DOI] [PubMed] [Google Scholar]
- 22. . Cox J, Hein MY, Luber CA, Paron I, Nagaraj N, Mann M. . Accurate proteome-wide label-free quantification by delayed normalization and maximal peptide ratio extraction, termed MaxLFQ. Mol Cell Proteomics. 2014; 13: 2513– 2526. [DOI] [PMC free article] [PubMed] [Google Scholar]
- 23. . Rosser EC, Oleinika K, Tonon S,et al. . Regulatory B cells are induced by gut microbiota-driven interleukin-1beta and interleukin-6 production. Nat Med. 2014; 20: 1334– 1339. [DOI] [PubMed] [Google Scholar]
- 24. . Zhang D, Chen G, Manwani D,et al. . Neutrophil ageing is regulated by the microbiome. Nature. 2015; 525: 528– 532. [DOI] [PMC free article] [PubMed] [Google Scholar]
- 25. . Livak KJ, Schmittgen TD. . Analysis of relative gene expression data using real-time quantitative PCR and the 2(-Delta Delta C(T)) Method. Methods. 2001; 25: 402– 408. [DOI] [PubMed] [Google Scholar]
- 26. . Tyanova S, Temu T, Sinitcyn P,et al. . The Perseus computational platform for comprehensive analysis of (prote)omics data. Nat Methods. 2016; 13: 731– 740. [DOI] [PubMed] [Google Scholar]
- 27. . Fransen F, Zagato E, Mazzini E,et al. . BALB/c and C57BL/6 mice differ in polyreactive IgA abundance, which impacts the generation of antigen-specific IgA and microbiota diversity. Immunity. 2015; 43: 527– 540. [DOI] [PubMed] [Google Scholar]
- 28. . Yanagibashi T, Hosono A, Oyama A,et al. . IgA production in the large intestine is modulated by a different mechanism than in the small intestine: Bacteroides acidifaciens promotes IgA production in the large intestine by inducing germinal center formation and increasing the number of IgA+ B cells. Immunobiology. 2013; 218: 645– 651. [DOI] [PubMed] [Google Scholar]
- 29. . Lin W, Jin L, Chen H,et al. . B cell subsets and dysfunction of regulatory B cells in IgG4-related diseases and primary Sjogren's syndrome: the similarities and differences. Arthritis Res Ther. 2014; 16: R118. [DOI] [PMC free article] [PubMed] [Google Scholar]
- 30. . Jung Y, Wen T, Mingler MK,et al. . IL-1beta in eosinophil-mediated small intestinal homeostasis and IgA production. Mucosal Immunol. 2015; 8: 930– 942. [DOI] [PMC free article] [PubMed] [Google Scholar]
- 31. . Sartor RB, Mazmanian SK. . Intestinal microbes in inflammatory bowel diseases. Am J Gastroenterol Suppl. 2012; 1: 15– 21. [Google Scholar]
Associated Data
This section collects any data citations, data availability statements, or supplementary materials included in this article.


