Abstract
Adiponectin receptors (ADIPORs) are integral membrane proteins controlling glucose and lipid metabolism by mediating, at least in part, a cellular ceramidase activity1 which catalyzes the hydrolysis of ceramide to produce sphingosine and a free fatty acid (FFA). The recent crystal structures of the two receptor subtypes, ADIPOR1 and ADIPOR2, showed a similar overall seven transmembrane (7TM) architecture with large unoccupied cavities as well as the presence of a zinc binding site within the 7TM domain2. However, the molecular mechanisms of ADIPORs function are not known. Here, we determined crystal structures of ADIPOR2 bound to a FFA molecule and demonstrate that ADIPOR2 possesses an intrinsic basal ceramidase activity enhanced by adiponectin. We then identify a ceramide docking pose and propose a possible mechanism for the ADIPOR2 hydrolytic activity using computational approaches. In molecular dynamics simulations, the side chains of residues coordinating the zinc quickly rearrange to promote the nucleophilic attack of a zinc-bound hydroxide ion onto the ceramide amide carbonyl. Furthermore, we present a revised ADIPOR1 crystal structure exhibiting a 7TM architecture clearly distinct from ADIPOR2. In this structure no FFA is observed and the ceramide binding pocket as well as the putative zinc catalytic site are exposed to the inner membrane leaflet. Because we found that ADIPOR1 also possesses an intrinsic ceramidase activity, we suspect that the two distinct structures may represent key steps of the ADIPORs enzymatic activity. The ceramidase activity is low, however, and further studies will be required to fully characterize ADIPORs enzymatic parameters and their substrate specificity. The new insights into ADIPOR function will enable the structure-based design of potent modulators of these clinically relevant enzymes.
Adiponectin is a hormone secreted mainly from adipocytes3 that stimulates glucose utilization4 and fatty-acid oxidation5. Its plasma level has been reported to be reduced in obese humans6. In an obese rhesus monkey model, the reduction of adiponectin plasma level was associated with insulin resistance and type 2 diabetes7 while replenishment of adiponectin was shown to ameliorate insulin resistance and glucose intolerance in mice8. The key roles of adiponectin in regulating energy homeostasis and glucose metabolism are mediated by two integral membrane proteins, named ADIPOR1 and ADIPOR29. Recently, the pleiotropic actions of adiponectin were linked to the ceramide signaling pathway as ADIPOR1 and ADIPOR2 activation was shown to lower ceramide levels via the activation of a ceramidase activity measured in crude cell lysates1.
The crystal structures of human ADIPOR1 and ADIPOR2 were recently described2 and confirmed the anticipated seven transmembrane architecture of these receptors that belong to the progesterone and adipoQ receptor (PAQR) family10. Those structures also highlighted the presence of a zinc binding site within the 7TM domain close to the intracellular surface. In an effort to analyze the function of ADIPORs we used the in meso crystallization method to solve two novel crystal structures of ADIPOR2 in complex with a single chain Fv (scFv) fragment of an anti-ADIPOR monoclonal antibody at 2.4 and 3 Å resolution. Crystals were grown without or with ceramide-doped lipidic cubic phase, respectively. In addition, we present two revised structures for ADIPOR1 and ADIPOR2 based on previously published entries (3WXV and 3WXW). Together with computational studies the four structures shed light on the structural basis for the enzymatic activity of adiponectin receptors determined herein using purified receptor preparations.
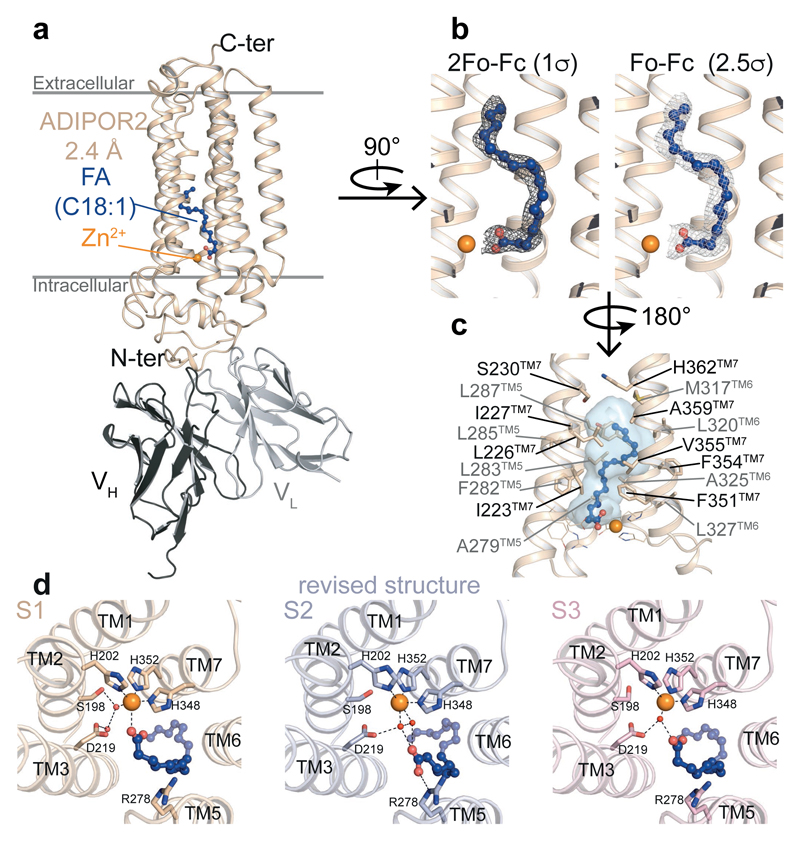
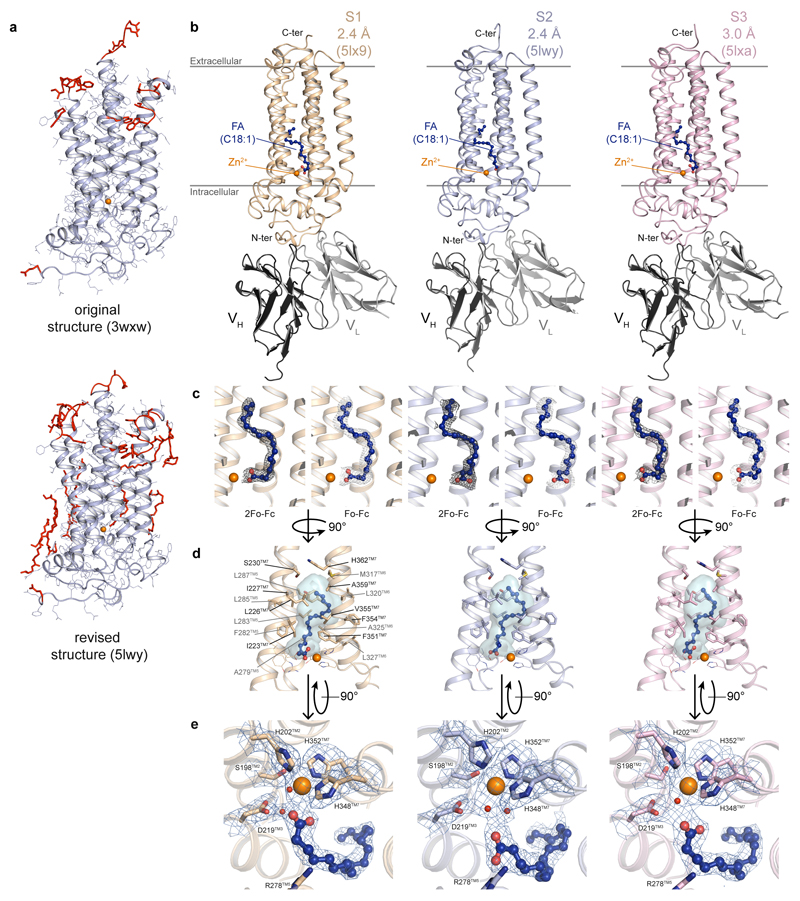
Besides the 7TM architecture and the position of the zinc binding site, the new ADIPOR2 crystal structures revealed the presence of a free fatty acid (FFA) within a large internal cavity (Fig. 1, Extended Data Fig. 1). In the published ADIPOR2 structure (pdb entry 3WXW) no FFA was modeled due to a poor quality of the electron density map2. Several rounds of refinement of the deposited data led to a significant improvement of the overall map quality with improved statistics (Supplementary Information Table 1) and confirmed the presence of a FFA in a position similar to the two other structures presented herein (Extended Data Fig. 1). We have modeled an oleic acid (C18:1) within the density map (Fig. 1b and Extended Data Fig. 1) as it is the main unsaturated fatty acid found in the Sf9 insect cells expression system with 48.0%, and is present in a greater amount than the major saturated fatty acid stearic acid (C18:0, 17.9%)11. The aliphatic chain binding pocket is identical for the three structures and is formed by hydrophobic residues from the TM5, TM6 and TM7 (Fig. 1c, Extended Data Fig. 1). By contrast, the three ADIPOR2 structures showed distinct binding poses at the level of the carboxylic acid moiety of the FFA (Fig. 1d). In one of the structures (named S1), the zinc ion is directly coordinated by the carboxylic acid, while in the revised R2 structure (named S2) and the 3 Å structure (named S3) this group is positioned away from the zinc and forms distinct polar contacts (Fig. 1d, Extended Data Fig. 1).
Figure 1. Crystal structure of ADIPOR2-scFv bound to a fatty acid.
(a) Overall view of ADIPOR2-scFv crystal structure at 2.4 Å from within the membrane plane. Oleic acid (FA C18:1) is shown as balls and sticks. (b) 2Fo-Fc (dark grey) and Fo-Fc (light grey) density maps used to position oleic acid. (c) Hydrophobic binding pocket of the oleic acid within ADIPOR2 displayed as transparent blue surface. Side chains of residues forming the pocket are shown as sticks. (d) Arrangement of polar residues and tentatively assigned water molecules, represented as red spheres, around the carboxylic acid moiety and the zinc ion in ADIPOR2 crystal structures viewed from the intracellular side. The black dashed lines indicate polar contacts. In all panels, the zinc ion is represented as an orange sphere.
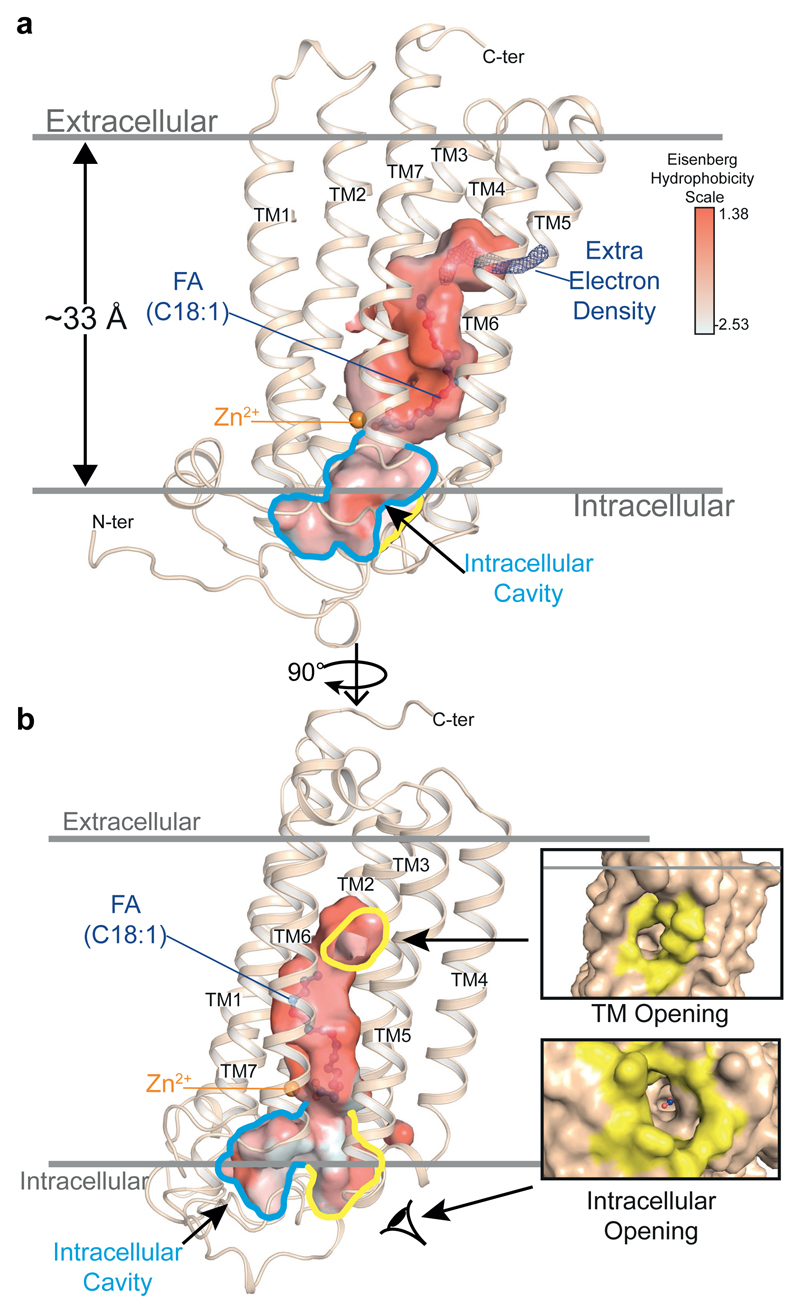
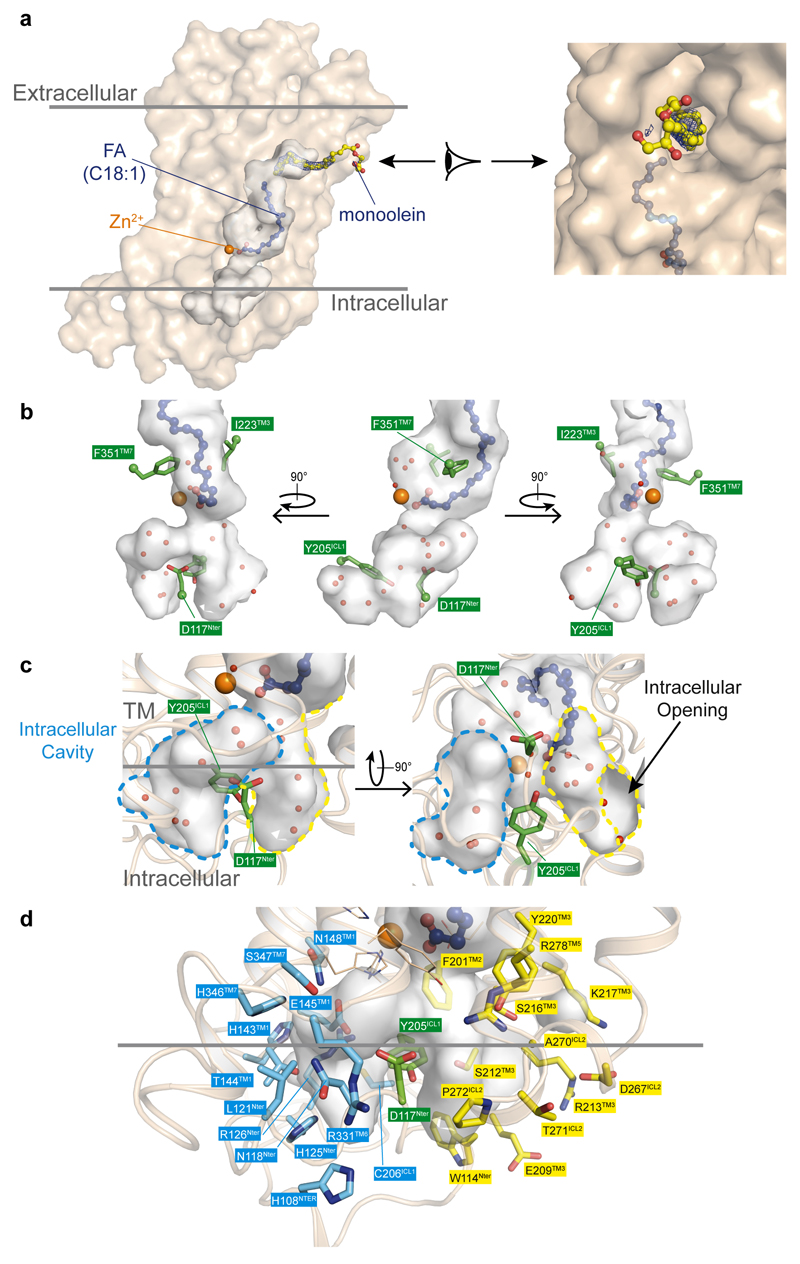
Remarkably, an uninterrupted cavity is going through the entire receptor from the domain exposed to the upper lipid bilayer to the domain exposed to the cytoplasm (Fig. 2a). A tunnel enters within the top half of the receptor between TM5 and TM6 and links the upper lipid bilayer to the FFA binding pocket (Fig. 2b, Extended Data Fig. 2). Some electron density is present in this domain (Fig. 2b) indicating that this large opening might play a key role in modulating the entrance or exit of molecules within the receptor. In the intracellular side of the ADIPOR2, the cavity splits into two tunnels right below the zinc binding domain one of which is largely exposed to the cytoplasm (Fig. 2b, Extended Data Fig. 2).
Figure 2. A continuous cavity in the ADIPOR2 structure.
The large internal cavity is shown as surface (cavity mode 1) and coloured according to the Eisenberg hydrophobicity classification. (a) The extra electron density (2Fo-Fc contoured at 1σ) is shown in dark blue. The intracellular cavity extruding towards the N-terminus domain/TM1/TM2 is contoured in blue. (b) Highlighted in yellow are the two openings accessible to solvent (TM opening/Intracellular opening, shown in insets as surface views). The zinc ion and oleic acid are represented and coloured as in Fig. 1.
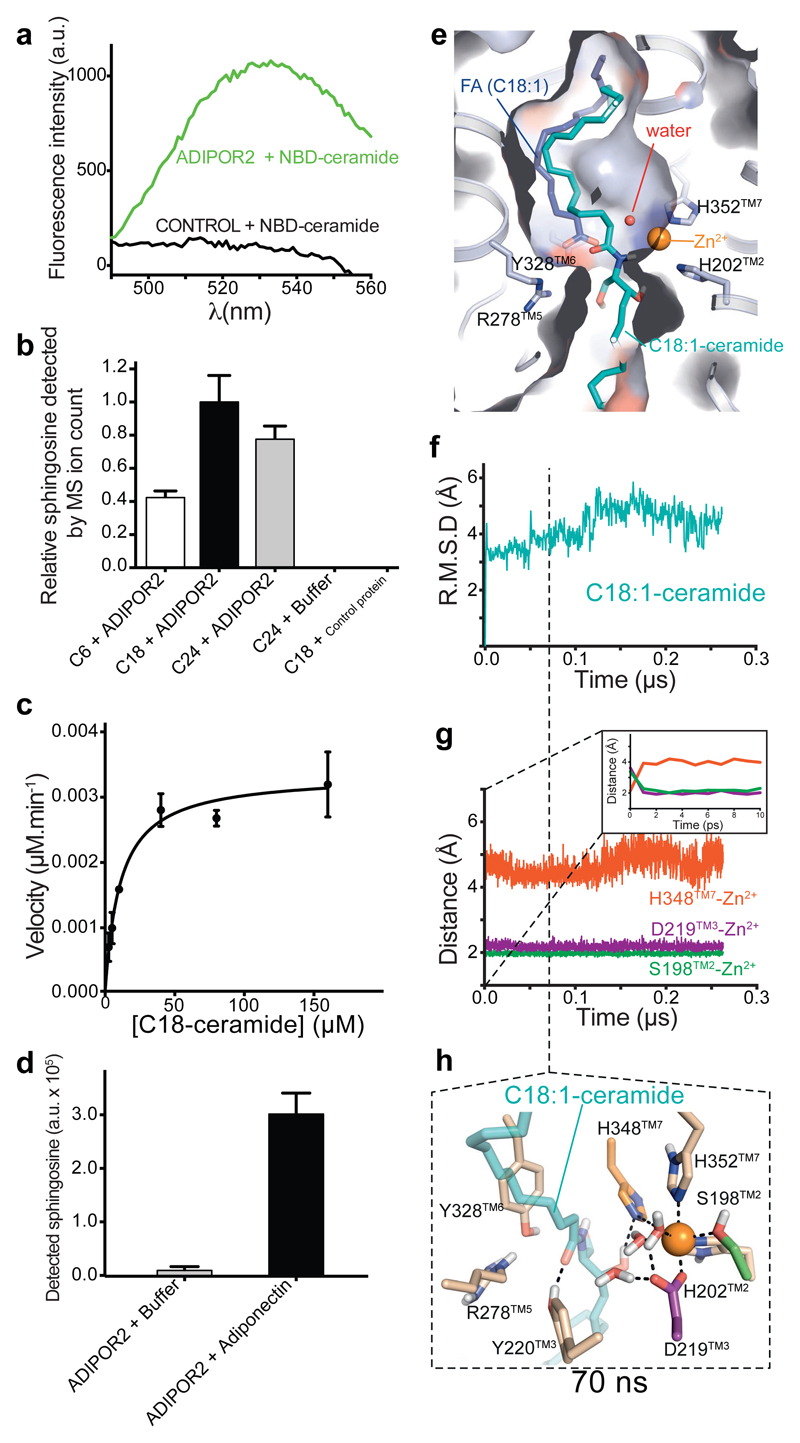
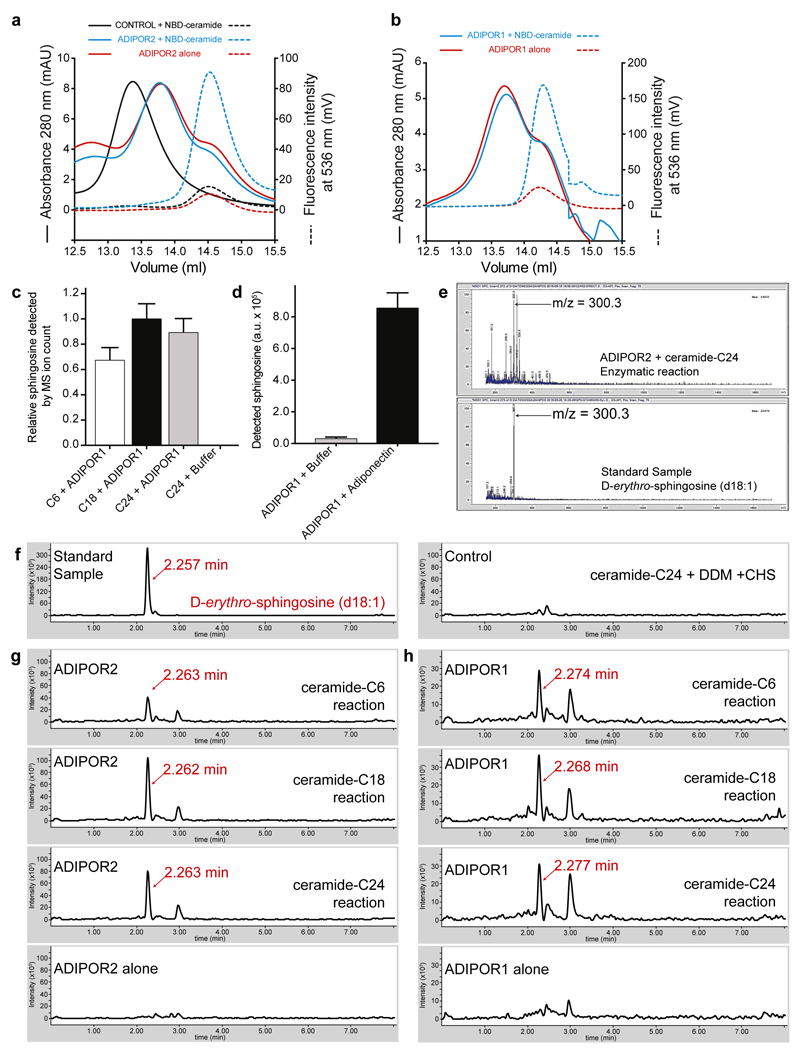
The structural features of ADIPOR2 with a large internal cavity and a FFA coordinating the zinc, a metal ion known to catalyze the hydrolytic activity of human neutral ceramidases12 strongly suggest that ADIPOR2 may possess an intrinsic ceramidase activity. Importantly, a functional link between fungal PAQRs and ceramidase activity was clearly established recently 13. Moreover, mutations of residues belonging to the catalytic core impair ADIPOR2 function1,2, in particular with the inhibition of a ceramidase activity measured from crude cell lysates1. Here we definitively demonstrate an intrinsic receptor enzymatic activity by showing that purified ADIPOR2 (i) binds to a fluorescent C18 ceramide in detergent micelles using fluorescent spectroscopy and fluorescent size exclusion chromatography (FSEC) analyses (Fig. 3a, Extended Data Fig. 3) and (ii) converts C18 ceramide into FFA and sphingosine using ultra-performance liquid-chromatography-mass spectrometry (UPLC-MS) analysis (Fig. 3b, Extended Data Fig. 3). We determined a KM value of 15.6 μM and a kcat of 0.49 x 10⁻³ s-1 from Michaelis Menten kinetic analyses (Fig. 3c) (s.e.m of 1.2 and 0.17 x 10⁻³ respectively). While this activity is arguably slow for an enzyme working on a physiological substrate, it is now well established that enzymatic activity of intramembrane proteins such as intramembrane proteases can be a very slow process 14. For example, the activity of the γ-secretase for the physiological substrate Amyloid Precursor Protein C-Terminal Fragment β was reported with a kcat of 1.2 x 10⁻³ s-1 15. Besides, ADIPORs display distant homology with alkaline ceramidases13,16 which are also integral membrane protein with putative seven transmembrane domains. Unfortunately, the activity (kcat) of purified alkaline ceramidase (ACER) is not known as all the published experiments were performed with microsomes, a crude preparation of reticulum endoplasmic membrane. We however estimated the kcat of ACER to be in the same order of magnitude than the kcat determined for ADIPOR (see Supplementary Information). Interestingly, we found that ADIPOR2 can also hydrolyze shorter (C6-ceramide) and longer (C24-ceramide) substrates but to a lesser extent (Fig. 3b). Together with the presence of C18 FFA in the structures, this data suggests that ADIPOR2 may have a preference for C18 ceramide substrate. Nevertheless, because of the low catalytic activity of ADIPORs, another lipid amidase activity cannot be ruled out. Finally, we also provide evidence that the ceramidase activity is greatly increased (twenty fold) upon adiponectin treatment of ADIPOR2 preparations (Fig. 3d). Considering the central role played by ADIPOR-mediated ceramidase activity in the biological effects of adiponectin in vivo in mice models1,17, it is likely that the physiological effect of adiponectin arises, at least in part, from the intrinsic ADIPOR ceramidase activity.
Figure 3. Biochemical and computational analyses of ceramide hydrolysis.
(a) Fluorescent spectra revealing the binding of NBD-C18 ceramide to ADIPOR2 (green line), compared to a control GPCR (black line). (b) ADIPOR2 ceramidase specific activity with ceramide substrates presenting different lengths (from C6 to C24 ceramides). Relative sphingosine values are represented as the mean ± SD of three independent measurements. (c) Representative Michaelis Menten analysis of ADIPOR2 ceramidase activity (n of 3). Initial velocity values (μM.min-1) are represented as the mean ± SD of three measurements. (d) Adiponectin increases twenty fold the basal ADIPOR2 ceramidase activity. Detected sphingosine values are represented as the mean ± SD of three independent measurements. (e) Surface view of the C18:1 ceramide top scoring docking pose in comparison with the FFA (S2 experimental structure). Calculated RMSD (f) and minimum distances between indicated residues and zinc (g) during MDS performed with the C18:1 ceramide. Inset in (g) highlights changes happening at very short time during MDS. (h) Snapshot of the active site extracted at 70 ns.
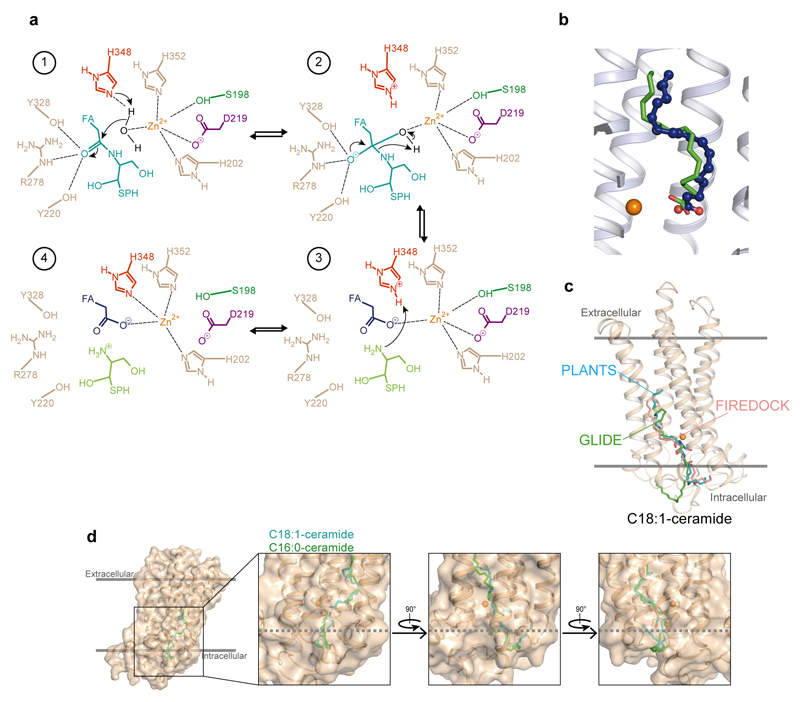
We then used computational studies to better understand the ADIPOR2 enzymatic activity. First, computational docking predicted an energetically favorable binding mode of C18:1 and C16:0 ceramide positioning the FFA moiety within the receptor cavity similar to the crystal structures and the sphingosine part into the cavity exposed to the cytoplasm described above (Fig. 3e and Extended data Fig. 4 and 5).
Interestingly, the substrate amide carbonyl contacts R278TM5 and Y328TM6 side chains (Fig. 3e), which are typical carbonyl polarizing and oxyanion stabilizing residues in zinc-dependent hydrolases18. In addition, the amide carbon is exposed to nucleophilic attack by the zinc-bound water molecules observed in the crystal structure (Fig. 3e). To gain insights into the hydrolytic mechanism, we used all-atom molecular dynamics simulations (MDS) and investigated the behavior of the receptor before and after cleavage of ceramide molecules using several docking positions as starting points (Supplementary Information Table 2). We discuss below the simulation results that are the most consistent with the experimentally-observed enzymatic activity.
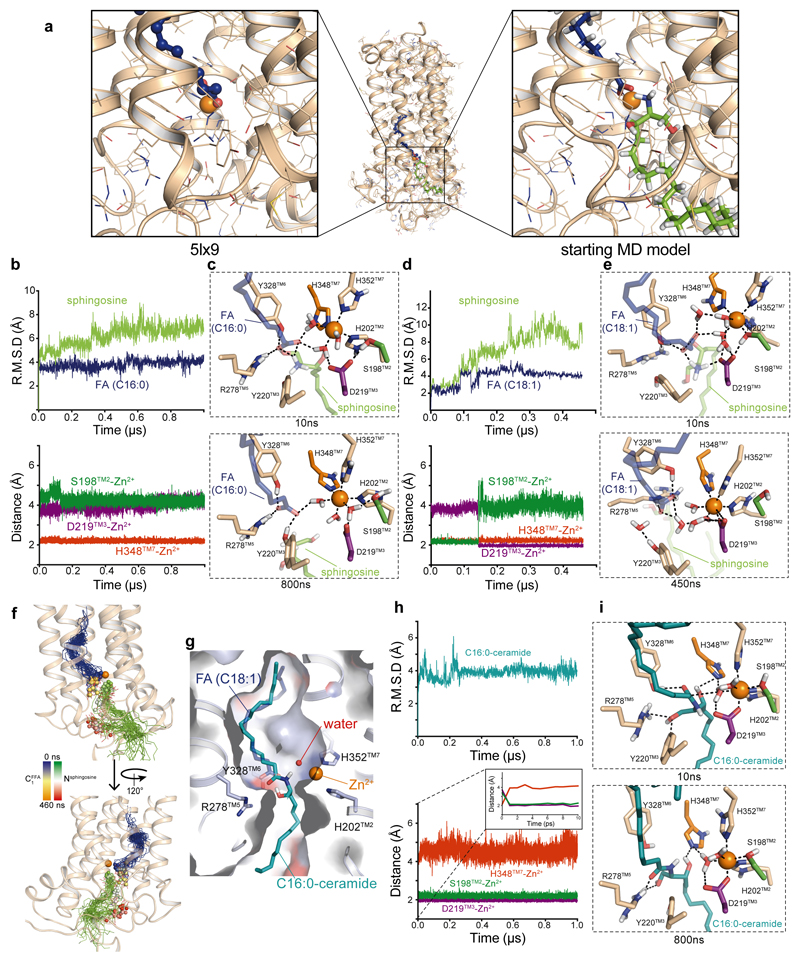
In the presence of C18:1 ceramide, while the binding pose remained stable for the time of simulation (Fig. 3f), we observed a fast rearrangement of the zinc binding site leading to the direct coordination of the S198TM2 hydroxyl and D219TM3 carboxyl to the zinc (Fig. 3g, inset). Concomitantly, H348TM7 moves away from the zinc to interact with a water molecule coordinating the zinc and with the secondary alcohol of the sphingosine moiety (Fig. 3g and h). Of note, further supporting the proposed mechanism, we observed the same results in independent MDS performed with the C16:0 ceramide (Extended data Fig. 4, Supplementary Information Table 2).
The structural and computational data thus suggest a mechanism in which H348TM7 acts as a general acid/base to mediate the transfer of protons to promote the nucleophilic attack of a zinc bound hydroxide ion onto the amide carbonyl and the amide bond cleavage (Extended Data Fig. 5). Nevertheless, the alternative mechanism involving TM3 as a general/acid base (reviewed in 18) cannot be excluded from our study. In the ADIPOR2 simulations performed with oleate and sphingosine, while the FFA remains close to its crystallographically observed position, the sphingosine drifts away from the zinc binding site and towards the cytoplasm within a few hundred nanoseconds, providing a potential release mechanism (Extended Data Fig. 4). This observation could explain its absence from the experimental structures.
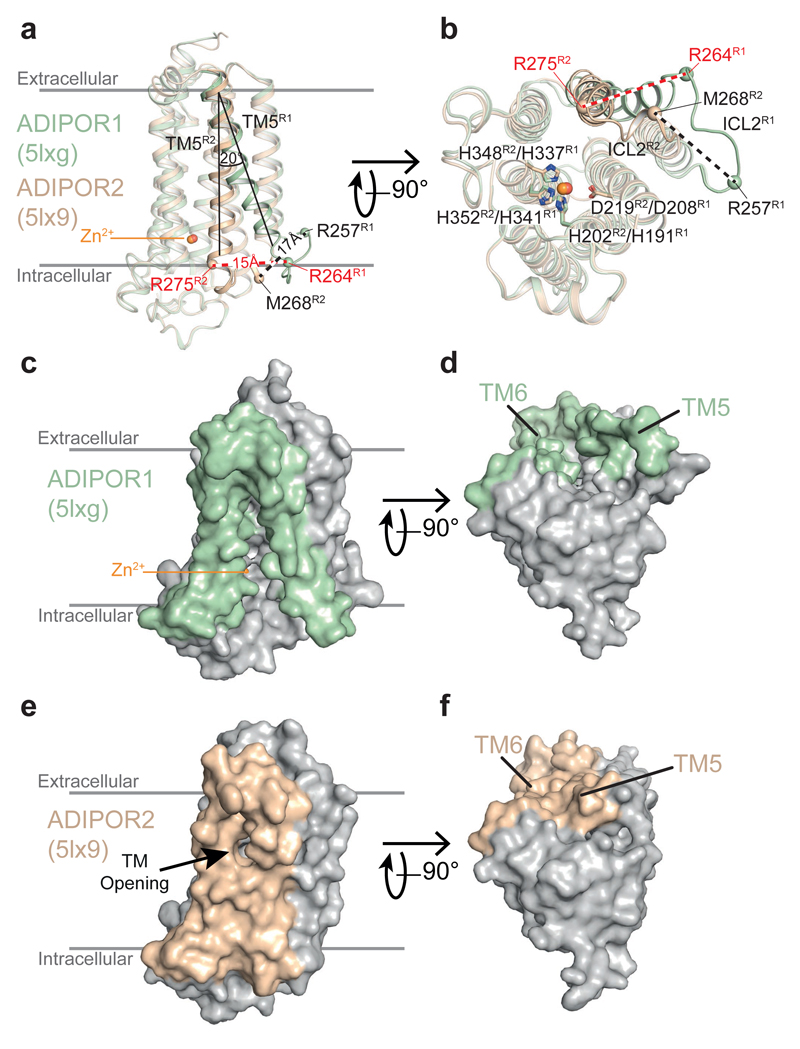
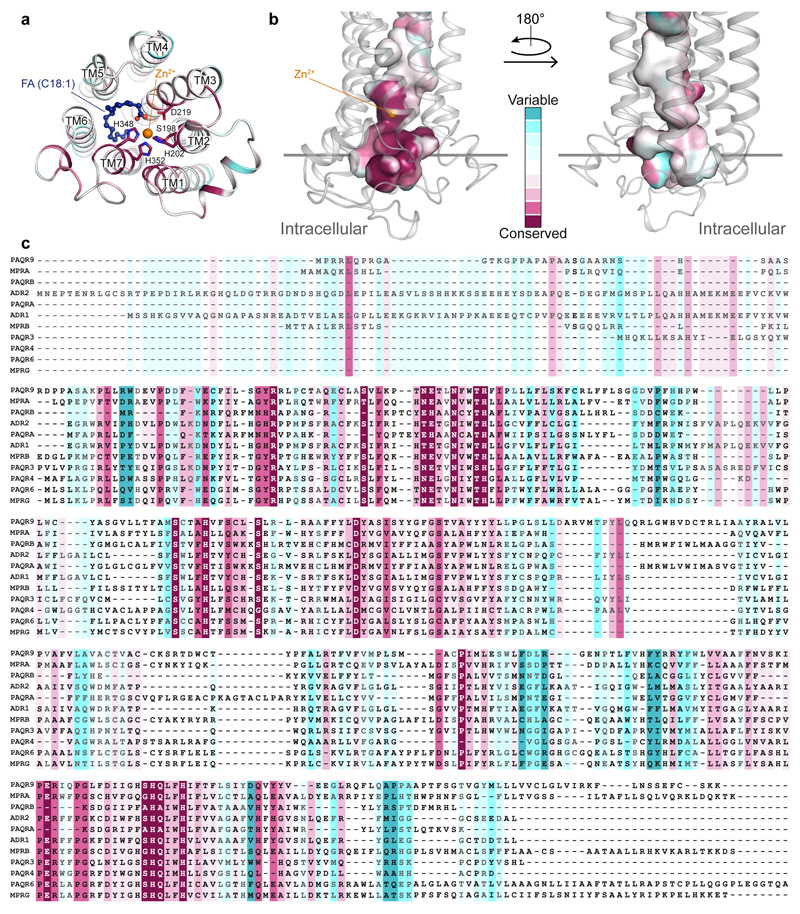
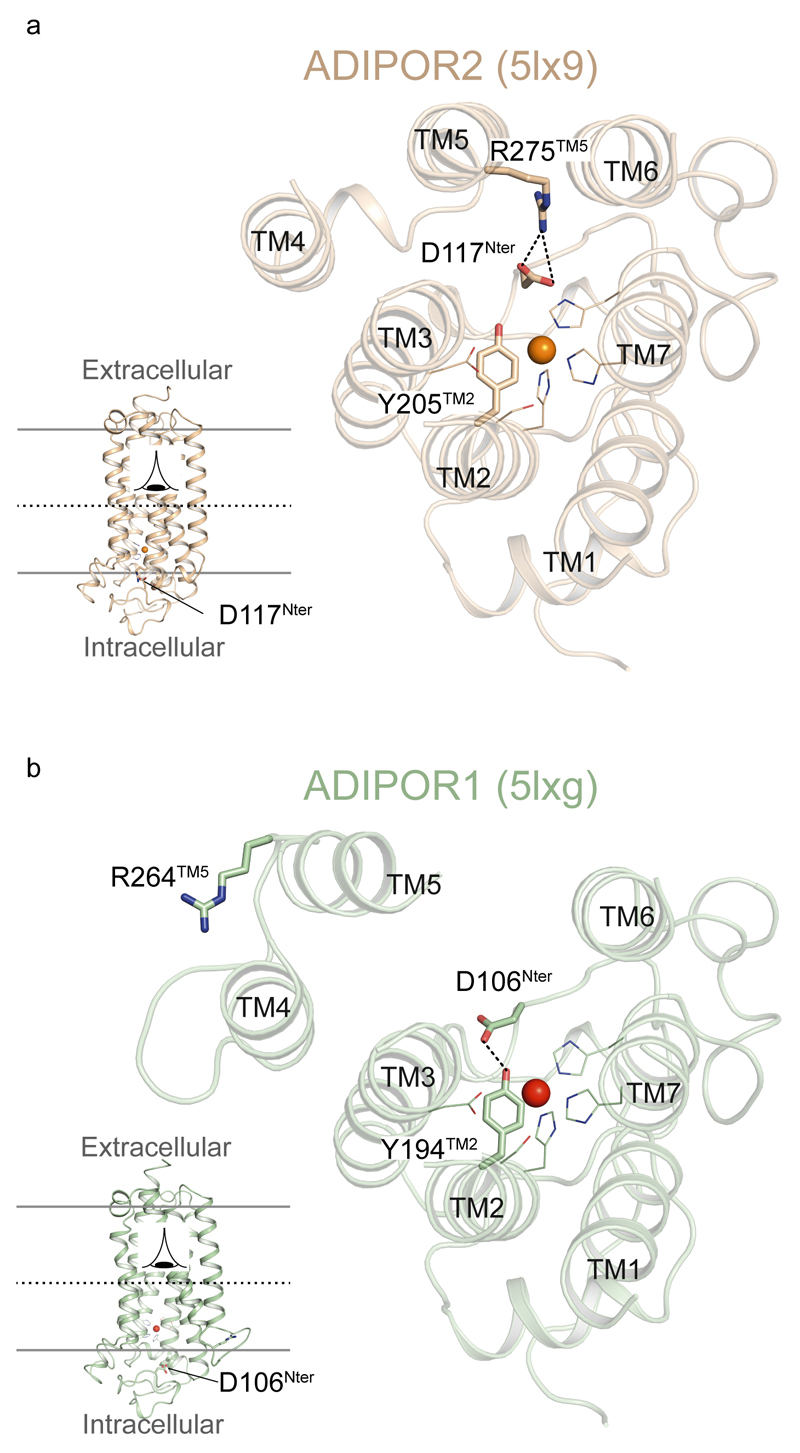
The residues implicated in the ADIPOR2 enzymatic activity are strictly conserved in the entire PAQR family (Extended Data Fig. 6). Mutations in the zinc binding domain of ADIPOR2 (H202RTM2) and ADIPOR1 (H191RTM2) inhibited equally well the ceramidase activity measured from crude cell lysates1. In agreement with these observations, we found that ADIPOR1 also possesses an adiponectin-sensitive intrinsic ceramidase activity (Extended Data Fig. 3). We thus carefully inspected the available structural data (pdb entry 3WXV), in particular to look for potential FFA electron density in the receptor. We obtained a revised ADIPOR1 structure (Fig. 4a) with a clear improvement in the statistics after the re-analysis of the published data (SI table 1 and Extended Data Fig. 7). Compared to the ADIPOR2 structures, this revised ADIPOR1 structure does not contain any FFA and presents large rearrangements of TM5 and intracellular loop 2 (icl2) (Fig. 4a). The zinc coordination sphere is however similar in both structures (Fig. 4b). The largest structural difference is seen at the level of the α-carbon of M268 TM5 (ADIPOR2)-R257 TM5 (ADIPOR1) residues with a 17 Å shift (Fig. 4a and b). As a result of this icl2 architecture, in comparing the ADIPOR1 and ADIPOR2 structures, the ADIPOR1 TM5 is positioned away from the 7TM hydrophobic core with a 15 Å translation of the intracellular part of TM5 (R275 TM5R2 to R264 TM5R1) (Fig 4a and b). The icl2 amino acids that are different between ADIPOR1 and ADIPOR2 make specific packing contacts in the ADIPOR1 crystal (Extended Data Fig. 7). Whether these contacts are playing a critical role in the stabilization of ADIPOR1 open conformation is not clear from the structural data alone. Interestingly, a polar interaction between the R275TM5 and D117 N-term of ADIPOR2 is broken in the open ADIPOR1 structure with the corresponding R264 TM5 shifted away and the D106N-term side chain repositioned to interact with the hydroxyl group of Y194TM2 (Extended Data Fig. 8).
Figure 4. Comparison of ADIPOR1 and ADIPOR2 crystal structures.
ADIPOR1 and ADIPOR2 are superimposed and shown as light green and dark yellow, respectively, with views from the membrane (a) and the intracellular side (b). TM5 in ADIPOR1 structure is tilted by 20 degrees as indicated by the angle between the two black lines. The distances between α-carbons (spheres) are shown as dashed lines. The molecular surface of ADIPOR1 viewed from the membrane (c) and intracellular side (d) highlighting the accessibility of the zinc catalytic core in stark contrast to ADIPOR2 (e,f). The positions of TM5 and TM6 in ADIPOR1 and ADIPOR2 are highlighted in light green and dark yellow, respectively.
Strikingly, the ADIPOR1 open conformation renders the putative catalytic site and substrate binding domain exposed to the cytoplasm and fully accessible to the inner membrane leaflet, in stark contrast to the ADIPOR2 buried cavity described above (Fig. 4c-f). A dynamic equilibrium between the open and closed structures may regulate the binding of the ceramide substrate and the release of the products. Hence, we suspect that both ADIPOR1 and ADIPOR2 can oscillate between open and closed conformations during the enzymatic process. However, further studies will be required to demonstrate such an hypothesis.
In this study we solved two novel structures of ADIPOR2 and re-analyzed diffraction data to present revised ADIPOR2 and ADIPOR1 structures. The four crystal structures together with biochemical and computational studies provide unprecedented insights into these 7TM receptor function demonstrating a direct ceramidase activity and possible conformational changes associated with this process. Because the observed ceramidase activity is low, amidase activity for other natural lipids cannot be ruled out at this stage. Whether ADIPORs prefer ceramides or are more non-specific amidases that can act on ceramides remains open at this stage. Also, the mechanism by which adiponectin modifies the enzymatic activity remains to be explored. Further studies will be required to characterize this novel enzymatic activity of ADIPORs in full.
Methods
Expression and purification of ADIPOR
The N-terminally truncated construct of human AdipoR2 (residues 100–386) and ADIPOR1 (residues 89–375) bearing an amino-terminal Flag epitope tag was expressed in Sf9 insect cells (Life technologies) using the pFastBac baculovirus system (ThermoFisher) according to manufacturer’s instructions. Insect cells were grown in suspension in EX-CELL® 420 medium (Sigma) to a density of 4 × 10⁶ cells per ml and infected with baculovirus encoding ADIPOR. Cells were harvested by centrifugation 48 h post-infection and stored at −80 °C until purification. After thawing the frozen cell pellet, cells were lysed by osmotic shock in 10 mM Tris-HCl pH 7.5, 1 mM EDTA buffer containing 2 mg ml−1 iodoacetamide and protease inhibitors. Lysed cells were centrifuged and the receptor extracted using a glass dounce tissue grinder in a solubilization buffer containing 20 mM HEPES (pH 7.5), 100 mM NaCl, 1 % (w/v) n-dodecyl-β-D-maltoside (DDM, Anatrace), 0.1 % (w/v) cholesteryl-hemi-succinate (CHS, Sigma), 2 mg ml−1 iodoacetamide and protease inhibitors. The extraction mixture was stirred for 1 h at 4 °C. The cleared supernatant was adjusted to the final concentration of 20 mM HEPES (pH 7.4), 300 mM NaCl, 0.5 % (w/v) DDM and 0.05% CHS and loaded by gravity flow onto anti-Flag M2 antibody resin (Sigma). The resin was then washed in buffer 1 containing 20 mM HEPES (pH 7.4), 200 mM NaCl, 0.025 % (w/v) DDM, and 0.0001 % (w/v) CHS and the bound receptor was eluted in the same buffer supplemented with 0.4 mg ml−1 Flag peptide. Purity and monodispersity of the receptor were evaluated by SDS–PAGE and analytical SEC.
Expression and purification of the single chain variable fragment (scFv) fragment of the anti-ADIPOR antibody
The synthetic genes encoding variable regions VH and VL of the previously described anti-ADIPOR antibody19 were synthesized (Eurofins Genomics) and cloned into Drosophila melanogaster S2 expression vector for scFv 20. Drosophila S2 cells (Life technologies) were transfected as reported previously21, amplified, and scFv expression was induced with 4 μM CdCl2 at a density of ~10x 106 cells per ml for 6-8 days for large-scale production. The protein was purified from the supernatant by affinity chromatography using a Strep-Tactin resin (IBA) according to manufacturer’s instructions followed by SEC on a Superdex200 column (GE Healthcare). Pure monomeric scFv was concentrated to ~10 mg.ml-1.
Expression and purification of the full-length adiponectin
The synthetic gene encoding the full-length human adiponectin was cloned into Drosophila melanogaster S2 expression vector pT350 22. Drosophila S2 cells were transfected, amplified, and the protein expression was induced as described above for the scFv. The purification protocol included a Strep-Tactin affinity column followed by SEC on a Superdex200 column (GE Healthcare) in 20 mM Hepes pH 7.5, 150 mM NaCl and 1 mM CaCl2. The full-length adiponectin eluted as several peaks corresponding to different oligomeric forms and the high-molecular weight species were selected for the functional studies.
Purification and crystallization of the ADIPOR2-scFv complex
After elution from the anti-Flag M2 antibody resin ADIPOR2 was mixed with the purified scFv at 1:1.5 molar ratio and incubated at 4 °C for 30 min. The ADIPOR2-scFv complex was loaded by gravity flow onto a Strep-Tactin affinity resin, washed in buffer 1 and eluted in the same buffer supplemented with 5 mM d-Desthiobiotin. The eluted complex was further purified by SEC on a Superdex 200 Increase 10/300 column in buffer 1. Fractions containing the complex were collected and concentrated to 15 mg.ml-1. Purity and monodispersity of crystallographic samples was evaluated by SDS–PAGE and analytical SEC.
Crystallization and data collection
Crystallization of ADIPOR2-scFv complex was performed using the in meso method23. Concentrated ADIPOR2-scFv complex was reconstituted into 10:1 monoolein:cholesterol (Sigma) or 17.5:1.7:1 monoolein:cholesterol:ceramide from brain (Avanti) at a ratio of 1:1.5 receptor:lipid by weight. Reconstitution was done using the coupled two-syringe method23. The resulting mesophase was dispensed onto a glass plate in 50-nl drops and overlaid with 700 nl precipitant solution using a Gryphon LCP robot (Art Robbins Instruments). Crystals grew in precipitant solution consisting of 30–45% PEG 400, 0.1 M HEPES pH 7.0, 50-100 mM potassium citrate and 10 μM of AdipoRon (Sigma). Crystals were observed after one day and grew to full size (~100x50x25 μm) after 5 days. Crystals were harvested from the lipidic mesophase using mesh grid loops and directly flash-frozen in liquid nitrogen.
Diffraction data were collected at the European Synchrotron Radiation Facility (ESRF) beamline ID30B at 100K at the wavelength of 0.976 using a beam size of 10-50 μm. Because the crystals were radiation-sensitive, wedges of 5-20 degrees were collected from multiple crystals. For ADIPOR2 grown in monoolein:cholesterol phase, a complete data set was obtained by merging the partial data sets from five crystals while for ADIPOR2 grown in the phase supplemented with ceramide a complete data set was a result of combining data from six crystals.
Structure determination and refinement
The data from multiple crystals was simultaneously processed by XDS24 as implemented in the program xia225. The integrated data were further used in the program BLEND26 for a cluster analysis procedure in order to find the optimal merging combinations. Subsequently, for the best combinations scaling and merging were carried out using the CCP4 programs POINTLESS and AIMLESS27. This procedure resulted in high overall Rmerge values for the datasets mainly due to weak and highly anisotropic diffraction data (see anisotropy directions in Extended Data Table 1). Concerns over the high Rmerge values were raised during the review process, which led us to reprocess the data with more conservative resolution cutoffs. Lower resolution cutoffs resulted in a slight decrease in the quality of the electron density maps, while the models refined against each respective datasets were essentially the same. Data collection and refinement statistics are available for these additional analyses in the supplementary information (Supplementary Information table 3) and the corresponding mtz files are available upon request. The structures of ADIPOR2-scFv complexes were determined by molecular replacement using the previously determined crystal structure of ADIPOR2-Fv (PDB accession number (3WXW) as a search model in PHASER28. The structural models, along with the revised models of ADIPOR1 and ADIPOR2 based on the deposited entries 3WXV and 3WXW, were iteratively built in Coot29 alternating with cycles of refinement using AutoBuster30. All the structures were refined applying translation libration screw-motion (TLS) parameters generated within AutoBuster. Free fatty acids were omitted in the initial building cycles until refinement of the models were finished to obtain high-quality unbiased difference maps for building of the lipids. MolProbity was used to assess the quality of the structures31 and indicated that >96.5% of residues were within favored Ramachandran regions. No residues were identified as Ramachandran outliers. The data collection and refinement statistics are summarized in Extended Data Table 1. Data processing, refinement, and analysis software were compiled and supported by the SBGrid Consortium32.
Fluorescent size exclusion chromatography (FSEC), fluorescence spectroscopy and ultra performance liquid chromatography- mass spectrometry (UPLC-MS) analyses
To analyze whether purified ADIPOR2 was able to bind a ceramide substrate in detergent micelles we used a fluorescently labeled C18:0 ceramide molecule containing the environment-sensitive nitrobenzoxadiazole (NBD) fluorophore attached to the sphingosine moiety of the ceramide. As free NBD ceramide is poorly fluorescent in detergent micelles, we were able to follow the NBD ceramide binding to the receptor by monitoring the increase in NBD fluorescence. The NBD-C18 ceramide was incubated with ADIPOR2 or with an unrelated GPCR in the exact same conditions and NBD fluorescence was monitored by fluorescent spectroscopy and FSEC. Purified receptor preparations (20 μM) were incubated with 1.5 equivalent of NBD 18:0 ceramide (Avanti) for 1hr at 25°C and injected on a Superdex200 column connected to an Äkta pure (GE Healthcare) and to a fluorescent detector (Jasco FP-4025) with an excitation and emission wavelengths set at 470 nm and 536 nm, respectively. For the fluorescence spectroscopy analysis, the same samples were diluted fifty times and the emission spectra were recorded from 480 to 560 nm wavelength with an excitation wavelength set at 470 nm using a Fluoromax-4 (Horiba Scientific).
Of note, we observed two main peaks in the SEC absorbance traces that could correspond to at least two receptor populations but only the one corresponding to the smaller peak on the right is in complex with the NBD-ceramide suggesting that part of the protein is either not functional or in a conformation which cannot accommodate the substrate. Besides, we are not able to discriminate between NBD-ceramide and NBD-sphingosine neither in the FSEC experiment nor in the fluorescence spectroscopy analysis. In both cases the original NBD-ceramide did bind to the ADIPORs.
As can be seen in all the control FSEC traces at 536 nm (receptor alone or GPCR control), there was a small fluorescent background signal which originated from the free DDM micelles flowing through the measurement cell resulting in artifactual light scattering. Of note this artifactual signal is approximately ten fold lower than the observed fluorescence signal of NBD bound to ADIPORs.
The presented data are representative of two experiments performed with two independent receptor preparations.
ADIPOR enzymatic activity was probed using UPLC-MS analyses. Purified receptor preparations (20 μM) were incubated with 1.1 equivalent of ceramide-C6 (d18:1/6:0), ceramide-C18 (d18:1/18:0), or ceramide-C24 (d18:1/24:0) for 3hrs at 25°C. To measure the effect of adiponectin, SEC purified preparations (0.3 μM) were incubated with ceramide-C18 (20 μM) and with adiponectin (10 μM) for 3 hrs at 25°C. The reactions were stopped by addition of methanol (30 % final).
UPLC-MS analysis to evaluate the production of sphingosine (m/z=300.3) was done using an AGILENT 6120 UPLC-MS system (Santa Clara, USA) consisting of an SQD (single quadrupole detector) mass spectrometer equipped with an electrospray ionization interface and a photodiode array detector. The samples were separated on a Zorbax Eclipse Plus C18 column (particle size 1.8μm, 2.1 × 50 mm) using a UPLC pump at a flow rate of 0.8 mL/min with a ternary solvent system of MeOH-H2O-HCOOH, where eluent A was water (99.9% H2O: 0.1% HCOOH, v/v), and eluent B was methanol (99.9% MeOH: 0.1% HCOOH, v/v). The column was first equilibrated using a mixture of 95% mobile phase A and 5% mobile phase B, and then 10 μL of the sample (139 pmol of ceramide substrate, and 139 pmol of corresponding protein) was injected. This was followed by a ramp gradient over 2 minutes to 95% phase B and 5% phase A, which remained until 7 minutes, followed by a ramp gradient back down to 95% solvent A and 5% solvent B for 1 minute, and column equilibration with the same mixture for 1 minutes. The resolved samples were detected using diode array detector (DAD) and ESI-MS (via the standard ESI source). The detection was performed in full scan mode.
The D-erythro-sphingosine (d18:1), ceramide-C6 (d18:1/6:0), ceramide-C18 (d18:1/18:0), and ceramide-C24 (d18:1/24:0) used in this study were synthesized according to previous methods developed in Christoph Arenz's laboratory 33.
The presented data for enzymatic activity are representative of three experiments performed with ADIPOR1 and ADIPOR2 receptor preparations. Importantly, we performed enzymatic assays using the SEC purified material. In this case, we were able to determine that the population co-eluting with the NBD compound represents approximately 20 % of the total protein collected for the enzymatic assay using the calculation of the area under the curve from the SEC traces. The turnover of ADIPOR2 described in the text was estimated using this assumption.
For the Michaelis Menten analyses, SEC purified ADIPOR2 (0.28 μM) was incubated for twenty minutes at 25°C with increasing amount of C18 ceramide substrate (2.5, 5, 10, 40, 80, 160 μM). The reactions were stopped and analyzed as described above. The experiments were performed in triplicates and reproduced three times with three different ADIPOR2 preparations. Data were fitted to the Michaelis Menten equation using Prism. The ceramidase activity was quantitated by peak area comparison with sphingosine standards. In each conditions, hydrolyzed substrate represented less than 1% of the total substrate concentration. The ceramidase activity was in the linear range with time and protein concentration. Of note, the linear range with time was lost for longer period of incubation, reflecting the effect of receptor denaturation overtime at 25°C in detergent micelles.
Docking calculations
Computational docking of N-Oleoyl-D-sphingosine (d18:1/18:1) and N-palmitoyl-D-sphingosine (d18:1/16:0) was mainly performed with the program Protein-Ligand ANT System (version 1.2) using as a receptor our 2.4 Å structure in which all non-protein atoms except zinc were removed. During the calculation, the ligand was fully flexible and all protein atoms and zinc were treated as rigid. PLANTS combines an ant colony optimization algorithm with an empirical scoring function and a clustering algorithm for the prediction and scoring of binding poses in a protein structure34. 10 poses corresponding to the 10 best clusters of solutions according to the chemplp scoring function were extracted from each run. The most accurate speed setting of 1 was used for the calculations, resulting in more than 1000 iterations of the ant colony optimization algorithm and about 107 scoring function evaluations per run. The binding pocket of ADIPOR2 was defined by all residues within a 15 Å radius around the zinc atom. All other options of PLANTS were left at their default settings. The top scoring pose was selected and used as input for molecular dynamics simulations (MDS).
We additionally performed blind docking of the C18 ceramide using the freely available online molecular docking and refinement webservers Patchdock/Firedock35,36, as well as the Swissdock web server37.
Finally, we performed additional docking calculations using Glide. In this case, the C18 ceramide coordinates were energy minimized with Ligprep in the Schrödinger suite at pH 7.0 with the OPLS_2005 force field38. The standard conversion procedure with full hydrogen optimization and charge generation was applied with the Protein Preparation workflow to the protein and Zn+2 ion. These processed coordinates were used for the subsequent grid generation and ligand-docking procedures. The Glide Grid39 (Schrödinger suite) was built using an inner box (centroids of residues 328, 351, 220) of 30× 30×30 Å3 and an outer box (within which all the ligand atoms must be contained) that extended 18 Å in each direction from the inner one. Default values were used for all other parameters. For docking, Glide 39,40 (Schrödinger suite) was used with input partial charges and extra precision (XP) settings.
System preparation and Molecular dynamics simulations
Four main protein-ligand systems were subjected to MDS. Briefly, the first two systems were composed of the top scoring poses of ceramide-C16 (d18:1/16:0) and ceramide-C18 (d18:1/18:1) docked into the 2.4 Å structure using PLANTS. In the third and fourth systems, the ceramides were replaced by the free fatty acids (oleate or palmitate) and sphingosine in order to simulate the behavior of the receptor following the cleavage of the ceramide molecule. The coordinates for the sphingosine were taken from the docked ceramide-C18 (d18:1/18:1) in which the oleate moiety was deleted and replaced by two hydrogen atoms bonded to the sphingosine nitrogen, and starting coordinates for the oleate/palmitate molecules were obtained from the structure in which the carboxylic acid is away from the zinc. In all cases, 12 crystallographic water molecules located in the vicinity of the zinc binding pocket and that did not sterically clash with the ligands were included in the MDS setup. Additional systems were subjected to MDS and simulation details are summarized in the Supplementary Information Table 2.
Each of the resulting ADIPOR2 complexes was then aligned to the orientations of proteins in membranes (OPM)41, entry for ADIPOR2 (3WXW), using PyMOL Molecular Graphics System (Schrödinger, LLC). The ADIPOR2 complexes containing ceramide-C18 (d18:1/18:1) or oleate and sphingosine were inserted into a hydrated, equilibrated bilayer composed of 200 molecules of 2-Oleoyl-1-palmitoyl-sn-glycero-3-phosphocholine (POPC) using the CHARMM-GUI membrane builder42,43. 49 potassium and 54 chloride ions were added to neutralize the system, reaching a final concentration of approximately 150 mM. Alternatively, the ADIPOR2 complexes containing ceramide-C16 (d18:1/16:0) or palmitate and sphingosine were inserted into a hydrated, equilibrated bilayer composed of 100 molecules of palmitoyloleoylphosphatidylcholine (POPC), 84 molecules of ceramide-C16 (d18:1/16:0) and 20 molecules of cholesterol, and 41 potassium and 46 chloride ions were added to neutralize the system. Topologies and parameters for ceramide-C16 (d18:1/16:0) and ceramide-C18 (d18:1/18:1) and oleate/palmitate were available in the additive all-atom CHARMM lipid force field44,45 and sphingosine was parameterized automatically using the CHARMM ParamChem web server, version 1.0.046. The automatic parameterization of sphingosine by analogy did not yield any high penalty values and thus the parameters were not further optimized prior to MDS.
Molecular dynamics calculations were performed in GROMACS 5.1 using the CHARMM36 force field and the CHARMM TIP3P water model (http://www.gromacs.org). The input systems were subjected to energy minimization, equilibration and production simulation using the GROMACS input scripts generated by CHARMM-GUI43. Briefly, the system was energy minimized using 5000 steps of steepest descent, followed by 375 ps of equilibration. NVT (constant particle number, volume, and temperature) and NPT (constant particle number, pressure, and temperature) equilibrations were followed by NPT production runs for all systems. The van der Waals interactions were smoothly switched off at 10–12 Å by a force-switching function47, whereas the long-range electrostatic interactions were calculated using the particle mesh Ewald method48. The temperature and pressure were held at 310.15 K and 1 bar, respectively. The assembled systems were equilibrated by the well-established protocol in Membrane Builder, in which various restraints were applied to the protein, lipids and water molecules, and the restraint forces were gradually reduced during this process. During production simulations an NPT ensemble was used with semi-isotropic pressure coupling via the Parrinello-Rahman barostat method49 while the Nose-Hoover thermostat was used to maintain a temperature of 310.15 K50,51. A leapfrog integration scheme was used, and all bonds were constrained allowing for a time-step of 2 ps to be used during NPT equilibration and production MDS. For the C18:1 systems, we performed three independent production runs of ~200-450 ns each and for the C16:0 systems, we ran two single trajectories of 1 μs. Additional details are available in the Supplementary Information Table 2. Production runs were subsequently analyzed using GROMACS tools to yield root mean square deviations (R.M.S.D.) and atomic distances.
Extended Data
Extended Data Figure 1. Comparison of the three ADIPOR2 structures.
(a) Comparison of the original (top) and revised (bottom) ADIPOR2 crystal structures. The modified sections and the additional molecules modeled in the revised structures are highlighted in red. (b) Overall view of ADIPOR2-scFv crystal structures from within the membrane plane. The heavy and light chain variable region (VH and VL) are colored in dark and light grey, respectively. Oleic acid (FA C18:1) is shown as sticks with C atoms displayed as spheres and coloured according to element: carbon, blue; oxygen, red. (c) 2Fo-Fc (dark grey) and Fo-Fc (light grey) density maps used to position oleic acid contoured at 1σ and 2.5σ, respectively. The density provided sufficient features to reliably position a free fatty acid in all structures. However, we could not make a clear distinction between an oleate (C18:1) and a stearate (C18:0) but decided to model an oleate because it is present in greater amount than stearate in insect cells and statistics were marginally better. (d) Hydrophobic binding pocket of the oleic acid within ADIPOR2 displayed as transparent blue surface. Residues forming the pocket are shown as sticks. (e) 2Fo-Fc electron density around the zinc binding site contoured at 1σ in S1, S2 and S3 crystal structures viewed from the intracellular side. The electron density reveals distinct positions of the carboxylic acid moiety and of the tentatively assigned water molecules resulting in the different apparent coordination geometries of the zinc ion. S1, S2 and S3 crystal structures are shown as cartoons and coloured in dark yellow, light blue and pink, respectively. The zinc ion is represented as an orange sphere. Residues participating in zinc coordination and carboxylic acid moiety are shown as sticks with oxygen and nitrogen atoms coloured in red and dark blue, respectively. Oleic acid is shown as sticks with C atoms displayed as spheres and coloured according to element: carbon, blue; oxygen, red. Water molecules are shown as red spheres.
Extended Data Figure 2. Features of the ADIPOR2 continuous cavity.
(a) Extra electron density (2Fo-Fc at 1σ) in the tunnel between TM5 and TM6 assigned to monoolein (rac-Glycerol 1-monooleate) as it is the most concentrated component in the crystallization sample and most likely binds this region with its oleate C18:1 moiety. We cannot rule out that the density originates from another molecule containing a long aliphatic chain. In both cases, the extra density suggests that this opening may play a role in ADIPOR2 function. Occupancy of the glycerol moiety and of the first four carbons from the ester group were however set to 0 during further refinement in absence of a significant electron density as indicated by the 2Fo-Fc map contoured at 1σ. Monoolein and oleic acid are shown as sticks with C atoms displayed as spheres and coloured according to element: carbon, yellow and blue, respectively for monoolein and oleic acid; oxygen, red. Tentatively assigned water molecules (red spheres) in an extra pocket close to the zinc site (b), and in the intracellular cavity and the intracellular opening (c). The extra pocket close to the zinc site is separated from the FFA molecule by F351TM7 and I223TM3 and is filled with water molecules. This cavity might be a reservoir of water molecules for the hydrolytic activity but such an hypothesis remains to be demonstrated. The intracellular pocket is split into the intracellular cavity (blue broken line) and the intracellular opening (yellow broken line) by residues D117Nter and Y205ICL1. Computational studies suggest that the sphingosine diffuses out from the receptor through the intracellular opening. The role of the intracellular cavity is hard to predict at this time. (d) Residues forming the intracellular cavity (blue) and opening (yellow).
Extended Data Figure 3. Biochemical analyses of ceramide binding to ADIPOR1 and ADIPOR2 and sphingosine formation.
A specific fluorescent signal for ADIPOR2 (a) or ADIPOR1 (b) incubated with NBD-ceramide was observed by FSEC at the elution volume of the receptor (blue broken line). In both cases, the two main peaks in the SEC absorbance traces could correspond to at least two receptor populations but only the one corresponding to the smaller peak on the right is able to bind to NBD-ceramide suggesting that part of the protein is either not functional or in a conformation which cannot accommodate the substrate. The presented figure is representative of two experiments performed with two independent receptor preparations. (c, d) Detected sphingosine in LC-MS analysis revealed ADIPOR1 ceramidase activity and adiponectin stimulation (around twenty five fold increase over basal). Relative sphingosine (c) and detected sphingosine (d) values are represented as the mean ± S.D. of three independent measurements. (e) Mass spectrum for the extracted ion peak (retention time of 2.27 min) of ADIPOR2 with ceramide-C24 sample, and the D-erythro-sphingosine (d18:1) standard sample. (f) Representative LC-MS analysis with an extracted ion chromatogram (m/z from 299.7 to 300.7) of the D-erythro-sphingosine (d18:1) standard sample (left panel) and of ceramide-C24 with N-dodecyl-β-d-maltopyranoside (DDM) and cholesteryl hemisuccinate (CHS) sample (right panel) in which no signals for sphingosine were detected. (g) Representative LC-MS analysis with an extracted ion chromatogram (m/z from 299.7 to 300.7) revealing the formation of the sphingoid base sphingosine (m/z=300.3, retention time of 2.26 min) from the enzymatic reaction between ADIPOR2 and ceramides of different chain length: Ceramide-C6, ceramide-C18 and ceramide-C24. The bottom panel represents the ADIPOR2 untreated samples. (h) Representative LC-MS analysis with an extracted ion chromatogram (m/z from 299.7 to 300.7) revealing the formation of the sphingoid base sphingosine (m/z=300.3, retention time of 2.27 min) from the enzymatic reaction between ADIPOR1 and ceramides of different chain length: ceramide-C6, ceramide-C18 and ceramide-C24. The bottom panel represents the ADIPOR1 untreated samples.
Extended Data Figure 4. Molecular dynamics simulations of ADIPOR2 substrate and products complexes.
(a) Comparison of the S1 crystal structure (5lx9) with the starting model used for MDS of the fatty acid and sphingosine system. A zoom of the active site is shown in inset. Calculated RMSD and distances between indicated residues and zinc during MDS performed with the sphingosine and the FA (C16:0) (b) or with the sphingosine and FA (C18:1) (d). In both cases, the sphingosine leaves the active site within the time scale of the MDS and moves towards the cytoplasm. The zinc coordination sphere remains as observed in the crystal structures during the C16:0 MDS (i.e. H202, H348, and H352 interact with the zinc ion), while in the C18:1 MDS some differences are observed. In the first 150ns, S198 interacts with the zinc along with H202, H348, and H352, while D219 is involved in a salt bridge with the sphingosine amine. After 150 ns, the D219/sphingosine interaction is broken and D219 replaces S198 in the zinc coordination sphere. These differences likely arise from the destabilization of the active site by the FA and sphingosine, which most probably requires longer time scales to return to equilibrium, as well as the strong tendency of MDS to remain stuck in local energy minima. (c) Snapshots of the active site extracted from MDS in the presence of the sphingosine and the FA (C16:0) at different times showing that the zinc binding site remained in the configuration observed in the crystal structures (except that the zinc adopted an octahedral geometry by interacting with 3 water molecules). (e) Snapshots of the active site extracted from MDS in the presence of the sphingosine and the FA (C18:1) at different times. In both C16:0 and C18:1 trajectories, the FA carboxylate forms a salt bridge with R278 side chain, which is also observed in the S2 structure. (f) Snapshots of the fatty acid and sphingosine taken every 10 ns along of 460 ns MDS trajectory, highlighting the movements of the sphingosine inside the receptor. The fatty acid and sphingosine are represented as blue and green lines, respectively. The zinc atom is shown as an orange sphere and the receptor is shown in cartoon representation. The carboxylic acid carbon (C1) of the fatty acid and the nitrogen atom of the sphingosine are shown in spheres and colored using blue-to-orange and green-to-red gradients to help visualize their motion over simulation time. (g) C16:0 ceramide top scoring docking pose reminiscent of the C18:1 pose.
Calculated RMSD and distances between indicated residues and zinc (h) during MDS performed with the C16:0 ceramide revealing a behavior similar to C18:1 ceramide. Inset in (h) highlights changes happening at the very beginning of the MDS. Because only the ligand is flexible during docking, and ADIPOR2 receptor was crystallized in a state that corresponds to the product state of the reaction (step four in the proposed mechanism), our interpretation is that the initial relaxation of the system represents the structural adaptation of the receptor to the presence of the substrate (induced fit back to step 1). We suspect that the movements of the receptor are fast because of the presence of the substrate in the binding pocket which is in the product state conformation thus constituting a perturbation of the system. (i) Snapshots of the active site extracted from MDS in the presence of C16:0 ceramide at different simulation times. The C16:0 ceramide and zinc-coordinating residues sampled conformations similar to what was observed for C18:1 ceramide. At late time points in the simulation, the ceramide moved slightly away from the zinc binding site, a likely consequence of the inability of MDS to simulate the destruction and creation of covalent bonds.
Extended Data Fig. 5. Proposed catalytic mechanism for ADIPOR2 ceramidase activity and docking calculations.
(a) Based on the interactions with ceramide and conformational changes of the zinc active site observed in MDS, as well as the zinc-coordinated FFA carboxyl oxygen seen in the crystal structures, we propose a general acid-base catalysis mechanism for the hydrolysis of the amide bond by ADIPOR2. In this mechanism, which is similar to what was proposed for neutral ceramidase (ref. 12 in the main text), the zinc ion activates a water molecule for nucleophilic attack of the amide carbon (1). Y220TM3, R278TM5 and Y328TM6 side chains polarize the amide carbonyl and stabilize the oxyanion formed in the tetrahedral transition state (2). H348TM7 serves as a general base for proton extraction from water (1) and subsequently acts as a general acid to transfer this proton to the nitrogen of ceramide during, or immediately after amide bond cleavage (3). The active site rearranges following the hydrolysis reaction to yield the product state-associated zinc coordination sphere observed in the crystal structures and MDS (4).
In this study, we decided to perform docking and simulations with ceramides and FFA presenting two different acyl chain lengths (C16:0, C18:1) as (i) we anticipated that chain length may not have a major impact on the observed mechanism and (ii) to compare our results with the study of ceramide binding to neutral ceramidase (ref .12 in the main text), in which docking calculations were performed with C16:0.
(b) The top scoring C18:1 FA docking pose obtained using PLANTS (shown as green sticks) is superimposed to the crystallographically observed FA taken from the revised ADIPOR2 structure (5lwy) (blue balls and sticks representation).
(c) Comparison of the top scoring C18:1 ceramide docking poses obtained using three different docking programs (PLANTS, Patchdock/Firedock and Glide). The ligands are shown as sticks with hydrogens omitted for clarity. The top scoring pose from PLANTS and Patchdock/Firedock are very similar, while the glide pose is slightly shifted towards the cytoplasm and a significant portion of the sphingosine moiety is exposed to the cytoplasm. In all three cases, the ceramide carbonyl contacts Y328 side chain.
(d) Comparison of the C18:1 and C16:0 ceramide top scoring docking poses obtained using PLANTS. The ADIPOR2 receptor is shown as semi-transparent cartoon and surface, and the insets highlight the position of the sphingosine moiety relative to the intracellular surface of the receptor.
Extended Data Fig. 6. The putative catalytic residues and the substrate binding pocket are highly conserved in the PAQR family.
(a) View of conserved residues around the zinc ion (orange sphere) from the intracellular side. The evolutionary analysis performed by Consurf server51 reveals that residues H202, H348, H352, and D219 (shown as sticks) coordinating the zinc ion in ADIPOR2 are strictly conserved in the entire PAQR family. S198 potentially involved in ceramide hydrolysis is also strictly conserved within the human members of the PAQR family. The receptor is shown as cartoon and coloured using the Consurf colour scale. Oxygen and nitrogen atoms are coloured in red and dark blue, respectively. (b) The conservation of the internal cavity within PAQR family viewed from within the membrane in two orientations obtained by a 180° rotation. The cavity is represented in surface (cavity mode 1) and coloured using the Consurf colour scale. These data strongly suggest that all members of the PAQR family may have a ceramidase activity. (c) Sequence alignment of the 11 members of the PAQR family coloured using the Consurf colour scale. It is important to note here that ADIPORs also share some homology with alkaline ceramidases further reinforcing the experimental evidence found in this study.
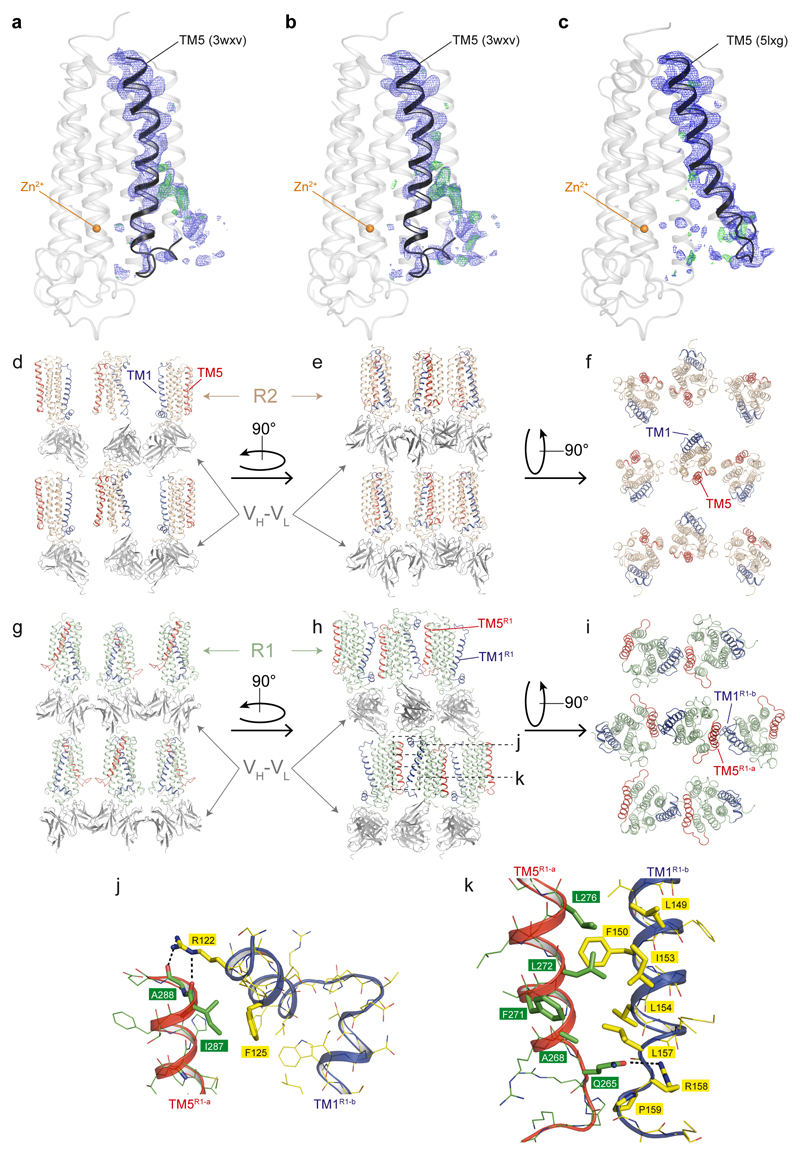
Extended Data Figure 7. Corrected electron density and ADIPOR1 TM5 positions and crystal lattice packing of ADIPOR1-scFv and ADIPOR2-scFv.
2Fo-Fc (blue mesh) and Fo-Fc (green mesh) electron density maps around TM5 are contoured at 1 σ and 2.5 σ, respectively, in the initial ADIPOR1 structure (PBD code 3WXV) fetched from the Electron Density Server (a), the ADIPOR1 structure after modeling in strong positive difference map peaks at ~13 and ~6 σ with two sulfate ions, respectively (b) and the final revised ADIPOR1 structure (c). ADIPOR1 is shown as cartoon and coloured in light grey with TM5 highlighted in black. The zinc ion is shown as an orange sphere.
Lattice packing of ADIPOR2-scFv crystals viewed within the membrane plane (d, e) and from the extracellular side (f). ADIPOR2 TM5 (red) does not make any crystal contacts neither with the bound scFv nor with the symmetry related molecules. Lattice packing of ADIPOR1-scFv crystals viewed within the membrane plane (g, h) and from the extracellular side (i). TM5 (red) of ADIPOR1 (R1-a) makes contact with the TM1 and N-terminal short helix (helix 0) (both in blue) from another symmetry related ADIPOR1 molecule (R1-b). (j, k) Closer view of the interaction of ADIPOR1 TM5 with TM1 and helix 0 from symmetry related ADIPOR1 molecule. At the top, TM5 is stabilized by hydrophobic contact between I287 and F125 of the symmetry related helix 0 as well as hydrogen bonds between the main chain carbonyl of A288 in TM5 and R122 in helix 0 as indicated by the black dashed line (j). At the bottom of TM5, Q265 interacts with R158 of the symmetry related receptor molecule intracellular loop 1 as indicated by the black dashed line. In addition, F271, L272 and L276 make hydrophobic contacts with symmetry related TM1 residues L157, I153, F150 and L149. The interacting residues are displayed as sticks and coloured in green for TM5 and yellow for TM1. ADIPOR1, ADIPOR2, VH and VL are coloured in pale green, wheat, dark grey and light grey, respectively. In both ADIPOR1-scFv and ADIPOR2-scFv, scFv molecules are contributing the most to the crystal lattice formation. Regarding the contacts between just the receptor molecules, in ADIPOR2 the packing is also mediated by TM4 of two symmetry related molecules.
Extended Data Figure 8. A broken N-terminus-TM5 interaction between the close (ADIPOR2) and open (ADIPOR1) structures.
The polar interaction between the R275TM5 and D117N-term of ADIPOR2 (a) is broken in the opened ADIPOR1 structure with the corresponding R264TM5 shifted away and the D106N-term side chain repositioned to interact with the Y194 (b). ADIPOR1 and ADIPOR2 are shown as cartoons and coloured in light green and dark yellow, respectively. R275, D117, R264, D106 and Y194 are shown as sticks. The zinc ion is represented as an orange sphere. Residues coordinating the zinc ion are shown as lines. Oxygen and nitrogen atoms are coloured in red and dark blue, respectively.
Extended Data Table 1. Data collection and refinement statistics (molecular replacement).
| ADIPOR2-scFv | ADIPOR2-scFv | |
|---|---|---|
| Data collection | ||
| No. of crystals (No. of wedges) | 5 (15) | 6 (12) |
| Space group | P21221 | P21221 |
| Cell dimensions | ||
| a, b, c (Å) | 74.58, 101.13, 111.58 | 74.16, 100.86, 110.39 |
| α, β, γ (°) | 90.00, 90.00, 90.00 | 90.00, 90.00, 90.00 |
| Resolution (Å) | 101.03-2.40 (2.50-2.40) * | 110.39-3.00 (3.18-3.00) |
| Anisotropy direction ** | ||
| Resolution where CC1/2 > 0.30 | ||
| overall (Å) | 2.41 | 3.01 |
| along h axis (Å) | 2.37 | 2.79 |
| along k axis (Å) | 2.36 | 2.74 |
| along l axis (Å) | 2.99 | 3.78 |
| Rmerge | 0.527 (NA) | 0.627 (NA) |
| Rpim | 0.174 (NA) | 0.248 (NA) |
| CC1/2 | 0.988 (0.489) | 0.979 (0.398) |
| I/σI | 5.5 (1.1) | 3.0 (1.0) |
| Completeness (%) | 100 (99.7) | 99.8 (99.3) |
| Redundancy | 10.5 (10.2) | 8.6 (8.2) |
| Refinement | ||
| Resolution (Å) | 32.21-2.40 | 74.46-3.00 |
| No. reflections | 33584 | 17135 |
| Rwork/Rfree | 17.60/20.25 | 20.38/24.80 |
| No. atoms | ||
| Protein | 4038 | 4087 |
| Zn | 1 | 1 |
| Oleate | 20 | 20 |
| Mono-oleins | 300 | 25 |
| Water | 488 | 227 |
| B-factors | ||
| Protein | 46.7 | 42.7 |
| Zn | 36.5 | 33.6 |
| Oleate | 48.3 | 35.3 |
| Mono-oleins | 81.5 | 53.9 |
| Water | 58.3 | 27.6 |
| R.m.s. deviations | ||
| Bond lengths (Å) | 0.010 | 0.009 |
| Bond angles (°) | 1.060 | 1.000 |
Values in parentheses are for highest-resolution shell.
The anisotropy statistics were computed with AIMLESS.
NA-not applicable, Rmerge value over 1 is statistically meaningless.
Supplementary Material
Acknowledgements
We are grateful to Christoph Mueller-Dieckmann and Ulrich Zander at the European Synchrotron Radiation Facility (ESRF), Grenoble, France for providing assistance in using beamline ID30B. The authors gratefully acknowledge the ESRF for provision of synchrotron radiation facilities via SSX Block Allocation Group beamtime. We thank Drs. Robie Joosten and Anastassis Perrakis from PDB REDO server for help with ADIPOR1 data re-analysis. We thank Dr. Felix Rey from the Structural Virology Unit, Institut Pasteur, Paris, France for providing S2 cells and an expression vector for scFv. This project has received funding from the European Research Council (ERC) under the European Union’s Horizon 2020 research and innovation programme (grant agreement No 647687).
Footnotes
Author Contributions
IVB and RS expressed, purified, characterized and crystallized receptor and scFv preparations with the help of PR, GB, MF and CB. IVB and CL collected data with the help of FH. CL performed the computational studies with help from LDC. IVB and CL solved and refined the structures. RS prepared the figures with the help of IVB and CL. EMS synthesized ceramides of different chain lengths and performed HPLC-MS analysis of the ceramide cleavage reactions. CA supervised EMS. All authors contributed to the manuscript preparation. SG supervised the overall project.
Author Information
These authors contributed equally to this work: Ieva Vasiliauskaité-Brooks, Rémy Sounier. Coordinates and structure factors for the revised ADIPOR1, the revised ADIPOR2 (S2), the 2.4Å ADIPOR2 (S1) and the 3Å ADIPOR2 (S3) structures have been deposited in the Protein Data Bank under accession numbers 5LXG, 5LWY, 5LX9 and 5LXA, respectively.
The authors declare no competing financial interests.
Reprints and permissions information are available at www.nature.com/reprints. Readers are welcome to comment on the online version of this article at www.nature.com/nature.
Data availability
Data that support the findings of this study have been deposited in the Protein Data Bank with the accession codes 5LXG, 5LWY, 5LX9 and 5LXA (http://www.rcsb.org/pdb/home/home.do). The data sets generated and analysed during the current study are available from the corresponding authors on reasonable request.
References
- 1.Holland WL, et al. Receptor-mediated activation of ceramidase activity initiates the pleiotropic actions of adiponectin. Nature medicine. 2011;17:55–63. doi: 10.1038/nm.2277. [DOI] [PMC free article] [PubMed] [Google Scholar]
- 2.Tanabe H, et al. Crystal structures of the human adiponectin receptors. Nature. 2015;520:312–316. doi: 10.1038/nature14301. [DOI] [PMC free article] [PubMed] [Google Scholar]
- 3.Scherer PE, Williams S, Fogliano M, Baldini G, Lodish HF. A novel serum protein similar to C1q, produced exclusively in adipocytes. J Biol Chem. 1995;270:26746–26749. doi: 10.1074/jbc.270.45.26746. [DOI] [PubMed] [Google Scholar]
- 4.Berg AH, Combs TP, Du X, Brownlee M, Scherer PE. The adipocyte-secreted protein Acrp30 enhances hepatic insulin action. Nature medicine. 2001;7:947–953. doi: 10.1038/90992. [DOI] [PubMed] [Google Scholar]
- 5.Fruebis J, et al. Proteolytic cleavage product of 30-kDa adipocyte complement-related protein increases fatty acid oxidation in muscle and causes weight loss in mice. Proc Natl Acad Sci U S A. 2001;98:2005–2010. doi: 10.1073/pnas.041591798. [DOI] [PMC free article] [PubMed] [Google Scholar]
- 6.Arita Y, et al. Paradoxical decrease of an adipose-specific protein, adiponectin, in obesity. Biochem Biophys Res Commun. 1999;257:79–83. doi: 10.1006/bbrc.1999.0255. [DOI] [PubMed] [Google Scholar]
- 7.Hotta K, et al. Circulating concentrations of the adipocyte protein adiponectin are decreased in parallel with reduced insulin sensitivity during the progression to type 2 diabetes in rhesus monkeys. Diabetes. 2001;50:1126–1133. doi: 10.2337/diabetes.50.5.1126. [DOI] [PubMed] [Google Scholar]
- 8.Yamauchi T, et al. The fat-derived hormone adiponectin reverses insulin resistance associated with both lipoatrophy and obesity. Nature medicine. 2001;7:941–946. doi: 10.1038/90984. [DOI] [PubMed] [Google Scholar]
- 9.Yamauchi T, et al. Cloning of adiponectin receptors that mediate antidiabetic metabolic effects. Nature. 2003;423:762–769. doi: 10.1038/nature01705. [DOI] [PubMed] [Google Scholar]
- 10.Tang YT, et al. PAQR proteins: a novel membrane receptor family defined by an ancient 7-transmembrane pass motif. Journal of molecular evolution. 2005;61:372–380. doi: 10.1007/s00239-004-0375-2. [DOI] [PubMed] [Google Scholar]
- 11.Marheineke K, Grunewald S, Christie W, Reilander H. Lipid composition of Spodoptera frugiperda (Sf9) and Trichoplusia ni (Tn) insect cells used for baculovirus infection. FEBS Lett. 1998;441:49–52. doi: 10.1016/s0014-5793(98)01523-3. [DOI] [PubMed] [Google Scholar]
- 12.Airola MV, et al. Structural Basis for Ceramide Recognition and Hydrolysis by Human Neutral Ceramidase. Structure. 2015;23:1482–1491. doi: 10.1016/j.str.2015.06.013. [DOI] [PMC free article] [PubMed] [Google Scholar]
- 13.Villa NY, et al. Sphingolipids Function as Downstream Effectors of a Fungal PAQR. Mol Pharmacol. 2009;75:866–875. doi: 10.1124/mol.108.049809. [DOI] [PMC free article] [PubMed] [Google Scholar]
- 14.Langosch D, Scharnagl C, Steiner H, Lemberg MK. Understanding intramembrane proteolysis: from protein dynamics to reaction kinetics. Trends Biochem Sci. 2015;40:318–327. doi: 10.1016/j.tibs.2015.04.001. [DOI] [PubMed] [Google Scholar]
- 15.Kamp F, et al. Intramembrane proteolysis of beta-amyloid precursor protein by gamma-secretase is an unusually slow process. Biophys J. 2015;108:1229–1237. doi: 10.1016/j.bpj.2014.12.045. [DOI] [PMC free article] [PubMed] [Google Scholar]
- 16.Pei J, Millay DP, Olson EN, Grishin NV. CREST--a large and diverse superfamily of putative transmembrane hydrolases. Biol Direct. 2011;6:37. doi: 10.1186/1745-6150-6-37. [DOI] [PMC free article] [PubMed] [Google Scholar]
- 17.Holland WL, Xia JY, Johnson JA, Scherer PE. Inducible overexpression of adiponectin receptors highlight the roles of adiponectin-induced ceramidase signaling in lipid and glucose homeostasis. Molecular metabolism. 2017 doi: 10.1016/j.molmet.2017.01.002. article in press. [DOI] [PMC free article] [PubMed] [Google Scholar]
- 18.Hernick M, Fierke CA. Zinc hydrolases: the mechanisms of zinc-dependent deacetylases. Arch Biochem Biophys. 2005;433:71–84. doi: 10.1016/j.abb.2004.08.006. [DOI] [PubMed] [Google Scholar]
- 19.Tanabe H, et al. Crystal structures of the human adiponectin receptors. Nature. 2015;520:312–316. doi: 10.1038/nature14301. [DOI] [PMC free article] [PubMed] [Google Scholar]
- 20.Gilmartin AA, et al. High-level secretion of recombinant monomeric murine and human single-chain Fv antibodies from Drosophila S2 cells. Protein Eng Des Sel. 2012;25:59–66. doi: 10.1093/protein/gzr058. [DOI] [PMC free article] [PubMed] [Google Scholar]
- 21.Johansson DX, Krey T, Andersson O. Production of recombinant antibodies in Drosophila melanogaster S2 cells. Methods Mol Biol. 2012;907:359–370. doi: 10.1007/978-1-61779-974-7_21. [DOI] [PubMed] [Google Scholar]
- 22.Krey T, et al. The disulfide bonds in glycoprotein E2 of hepatitis C virus reveal the tertiary organization of the molecule. PLoS Pathog. 2010;6:e1000762. doi: 10.1371/journal.ppat.1000762. [DOI] [PMC free article] [PubMed] [Google Scholar]
- 23.Caffrey M, Cherezov V. Crystallizing membrane proteins using lipidic mesophases. Nat Protoc. 2009;4:706–731. doi: 10.1038/nprot.2009.31. [DOI] [PMC free article] [PubMed] [Google Scholar]
- 24.Kabsch W. Xds. Acta Crystallogr D Biol Crystallogr. 2010;66:125–132. doi: 10.1107/S0907444909047337. [DOI] [PMC free article] [PubMed] [Google Scholar]
- 25.Winter G, Lobley CM, Prince SM. Decision making in xia2. Acta Crystallogr D Biol Crystallogr. 2013;69:1260–1273. doi: 10.1107/S0907444913015308. [DOI] [PMC free article] [PubMed] [Google Scholar]
- 26.Foadi J, et al. Clustering procedures for the optimal selection of data sets from multiple crystals in macromolecular crystallography. Acta Crystallogr D Biol Crystallogr. 2013;69:1617–1632. doi: 10.1107/S0907444913012274. [DOI] [PMC free article] [PubMed] [Google Scholar]
- 27.Evans P. Scaling and assessment of data quality. Acta Crystallogr D Biol Crystallogr. 2006;62:72–82. doi: 10.1107/S0907444905036693. [DOI] [PubMed] [Google Scholar]
- 28.McCoy AJ, et al. Phaser crystallographic software. J Appl Crystallogr. 2007;40:658–674. doi: 10.1107/S0021889807021206. [DOI] [PMC free article] [PubMed] [Google Scholar]
- 29.Emsley P, Lohkamp B, Scott WG, Cowtan K. Features and development of Coot. Acta Crystallogr D Biol Crystallogr. 2010;66:486–501. doi: 10.1107/S0907444910007493. [DOI] [PMC free article] [PubMed] [Google Scholar]
- 30.Bricogne G, B E, Brandl M, Flensburg C, Keller P, Paciorek W, Roversi P, S A, Smart OS, Vonrhein C, Womack TO. BUSTER version X.Y.Z. Cambridge, United Kingdom: Global Phasing Ltd; 2016. [Google Scholar]
- 31.Chen VB, et al. MolProbity: all-atom structure validation for macromolecular crystallography. Acta Crystallogr D Biol Crystallogr. 2010;66:12–21. doi: 10.1107/S0907444909042073. [DOI] [PMC free article] [PubMed] [Google Scholar]
- 32.Morin A, et al. Collaboration gets the most out of software. Elife. 2013;2:e01456. doi: 10.7554/eLife.01456. [DOI] [PMC free article] [PubMed] [Google Scholar]
- 33.Saied EM, Banhart S, Buerkle SE, Heuer D, Arenz C. A series of ceramide analogs modified at the 1-position with potent activity against the intracellular growth of Chlamydia trachomatis. Future Medicinal Chemistry. 2015;7:1971–1980. doi: 10.4155/fmc.15.126. [DOI] [PubMed] [Google Scholar]
- 34.Korb O, Stutzle T, Exner TE. Empirical scoring functions for advanced protein-ligand docking with PLANTS. J Chem Inf Model. 2009;49:84–96. doi: 10.1021/ci800298z. [DOI] [PubMed] [Google Scholar]
- 35.Schneidman-Duhovny D, Inbar Y, Nussinov R, Wolfson HJ. PatchDock and SymmDock: servers for rigid and symmetric docking. Nucleic Acids Res. 2005;33:W363–367. doi: 10.1093/nar/gki481. [DOI] [PMC free article] [PubMed] [Google Scholar]
- 36.Mashiach E, Schneidman-Duhovny D, Andrusier N, Nussinov R, Wolfson HJ. FireDock: a web server for fast interaction refinement in molecular docking. Nucleic Acids Res. 2008;36:W229–232. doi: 10.1093/nar/gkn186. [DOI] [PMC free article] [PubMed] [Google Scholar]
- 37.Grosdidier A, Zoete V, Michielin O. SwissDock, a protein-small molecule docking web service based on EADock DSS. Nucleic Acids Res. 2011;39:W270–277. doi: 10.1093/nar/gkr366. [DOI] [PMC free article] [PubMed] [Google Scholar]
- 38.Banks JL, et al. Integrated Modeling Program, Applied Chemical Theory (IMPACT) J Comput Chem. 2005;26:1752–1780. doi: 10.1002/jcc.20292. [DOI] [PMC free article] [PubMed] [Google Scholar]
- 39.Friesner RA, et al. Glide: a new approach for rapid, accurate docking and scoring. 1. Method and assessment of docking accuracy. J Med Chem. 2004;47:1739–1749. doi: 10.1021/jm0306430. [DOI] [PubMed] [Google Scholar]
- 40.Halgren TA, et al. Glide: a new approach for rapid, accurate docking and scoring. 2. Enrichment factors in database screening. J Med Chem. 2004;47:1750–1759. doi: 10.1021/jm030644s. [DOI] [PubMed] [Google Scholar]
- 41.Lomize MA, Lomize AL, Pogozheva ID, Mosberg HI. OPM: orientations of proteins in membranes database. Bioinformatics. 2006;22:623–625. doi: 10.1093/bioinformatics/btk023. [DOI] [PubMed] [Google Scholar]
- 42.Wu EL, et al. CHARMM-GUI Membrane Builder toward realistic biological membrane simulations. J Comput Chem. 2014;35:1997–2004. doi: 10.1002/jcc.23702. [DOI] [PMC free article] [PubMed] [Google Scholar]
- 43.Lee J, et al. CHARMM-GUI Input Generator for NAMD, GROMACS, AMBER, OpenMM, and CHARMM/OpenMM Simulations Using the CHARMM36 Additive Force Field. J Chem Theory Comput. 2016;12:405–413. doi: 10.1021/acs.jctc.5b00935. [DOI] [PMC free article] [PubMed] [Google Scholar]
- 44.Klauda JB, et al. Update of the CHARMM all-atom additive force field for lipids: validation on six lipid types. J Phys Chem B. 2010;114:7830–7843. doi: 10.1021/jp101759q. [DOI] [PMC free article] [PubMed] [Google Scholar]
- 45.Venable RM, et al. CHARMM all-atom additive force field for sphingomyelin: elucidation of hydrogen bonding and of positive curvature. Biophys J. 2014;107:134–145. doi: 10.1016/j.bpj.2014.05.034. [DOI] [PMC free article] [PubMed] [Google Scholar]
- 46.Vanommeslaeghe K, et al. CHARMM general force field: A force field for drug-like molecules compatible with the CHARMM all-atom additive biological force fields. J Comput Chem. 2010;31:671–690. doi: 10.1002/jcc.21367. [DOI] [PMC free article] [PubMed] [Google Scholar]
- 47.Steinbach PJ, Brooks BR. New Spherical-Cutoff Methods for Long-Range Forces in Macromolecular Simulation. Journal of Computational Chemistry. 1994;15:667–683. doi: 10.1002/jcc.540150702. [DOI] [Google Scholar]
- 48.Essmann U, et al. A Smooth Particle Mesh Ewald Method. J Chem Phys. 1995;103:8577–8593. doi: 10.1063/1.470117. [DOI] [Google Scholar]
- 49.Parrinello M, Rahman A. Polymorphic Transitions in Single-Crystals - a New Molecular-Dynamics Method. J Appl Phys. 1981;52:7182–7190. doi: 10.1063/1.328693. [DOI] [Google Scholar]
- 50.Hoover WG. Canonical dynamics: Equilibrium phase-space distributions. Phys Rev A Gen Phys. 1985;31:1695–1697. doi: 10.1103/physreva.31.1695. [DOI] [PubMed] [Google Scholar]
- 51.Nose S. A Molecular-Dynamics Method for Simulations in the Canonical Ensemble. Mol Phys. 1984;52:255–268. doi: 10.1080/00268978400101201. [DOI] [Google Scholar]
Associated Data
This section collects any data citations, data availability statements, or supplementary materials included in this article.


