Abstract
Brain tissue injury is often accompanied by spreading depolarization (SD) events, marked by widespread cellular depolarization and cessation of neuronal firing. SD recruits viable tissue into the lesion, making it a focus for intervention. During SD, drastic fluctuations occur in ion gradients, extracellular neurotransmitter concentrations, cellular metabolism, and cerebral blood flow. Measuring SD requires a multimodal approach to capture the array of changes. However, the use of multiple sensors can inflict tissue damage. Here, we use carbon-fiber microelectrodes to characterize several aspects of SD with a single, minimally-invasive sensor in the deep brain region of the nucleus accumbens. Fast-scan cyclic voltammetry detects large changes in oxygen, which reflect the balance between cerebral blood flow and energy consumption, and also supraphysiological release of electroactive neurotransmitters (i.e., dopamine). We verify waves of SD with concurrent single-unit or DC potential electrophysiological recordings. The single-unit recordings reveal bursts of action potentials followed by inactivity. The DC potentials exhibit a slow negative voltage shift in the extracellular space indicative of wide-spread cellular depolarization. Here, we characterize the multiple modalities of our sensor and demonstrate its utility for improved SD recordings.
Keywords: spreading depolarization, voltammetry, convolution, dopamine, oxygen, DC potential
Graphical abstract
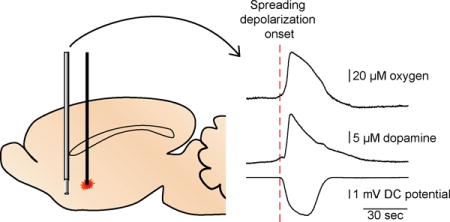
Implantable 5-μm sensor is characterized for simultaneous measurements of oxygen, dopamine, and electrophysiology in the deep brain during spreading depolarizations.
Introduction
Spreading depolarizations (SD) are waves of widespread cellular depolarization that occur with pathologies such as traumatic brain injury, stroke, hemorrhage, and migraine with aura.1 These waves slowly propagate through neural tissue (2–6 mm/min) and cause neurotransmitter release, ion gradient imbalance, and increased energy demand.2, 3 The quantity and duration of SD waves following the initial injury positively correlate with final infarct size.4–7 Conversely, treatments that minimize the occurrence of these waves prove to be neuroprotective in rodent experimental models.4, 7–10 As such, SD events in compromised tissues can be both a marker for delayed cell death and a possible target for therapeutic intervention.
SD waves are accompanied by ~10 fold increases in extracellular potassium ions, as well as a movement of sodium, calcium, and chloride ions, along with water, into the cell.11 This ion flux results in cellular depolarization and subsequent release of excitatory amino acids and monoamines.12, 13 As a consequence, neurons increase metabolic rates to both restore ion gradients and also buffer the extracellular space against excitotoxic neurotransmitters. In healthy tissue, blood vessels dilate to increase blood flow, remove toxic buildups of species, and deliver oxygen and glucose to replenish energy substrate stores.3 However, under pathological conditions SD is accompanied by decreased cerebral blood flow. This prolongs the duration of ion imbalance and oxygen starvation leading to cell death.3
Multimodal recordings are extensively used for SD studies due to the wide array of chemical, morphological, and hemodynamic changes that occur.14 Thus, many current methodologies rely on multiple invasive sensors that may contribute to tissue damage.15–17 Improved, single-implant devices recently detected simultaneous changes of glucose and lactate in real time.18, 19 However, these sensors do not provide parallel electrophysiological measurements, which verify SD. As such, there remains a need in the field of SD research for a sensor that can detect both chemical and electrophysiological phenomena with minimal invasiveness that permits access to the entire brain.
Here, we describe a single carbon-fiber microelectrode sensor to simultaneously record real-time changes in oxygen, dopamine, and electrophysiological activity. The 5-μm dimension of the electrode allows for real-time characterization of SD in both superficial and deep brain regions. In agreement with previous studies, single-unit activity revealed that bursts of cell firing occurred at the onset of the SD wave, followed by a period of inactivity, allowing verification of the SD waves.20, 21 We also separately recorded a negative shift in DC potential of the extracellular space arising from widespread depolarization of cells, traditionally used to verify SD.22–24 Further, using FSCV we detected large oxygen changes and supraphysiological dopamine release in the nucleus accumbens (NAc). Coupling FSCV with electrophysiology provides a minimally-invasive, multimodal recording system, capable of monitoring SD waves in traditionally studied cortical areas as well as deeper brain regions.
Methods
Chemicals
All chemicals were used as received from Sigma-Aldrich (St. Louis, MO). Urethane was dissolved to 50/50% w/v in bacteriostatic 0.9% NaCl. KCl was dissolved in deionized water. A physiological buffer was prepared for calibration experiments containing 3.25 mM KCl, 145 mM NaCl, 1.25 mM NaH2PO4, 1.2 mM CaCl2, 1.2 mM MgCl2, 2 mM Na2SO4, and 15 mM Trizma® HCl.
Simultaneous Electrochemical and Electrophysiological Data Acquisition
A switched headstage controller and two-electrode system consisting of a carbon-fiber working electrode (~75-μm exposed length) and Ag/AgCl reference electrode were used for all studies, as described previously.25 HDCV (High Definition Cyclic Voltammetry, UNC-Chapel Hill, NC, USA) software program controlled voltage applied to the carbon-fiber microelectrode and recorded resulting currents. Electrochemical data was displayed as a color plot where the x-axis is time, the y-axis is the applied voltage, and current is shown in false color. Cyclic voltammograms (CVs) or current-over-time traces are obtained from the color plot by taking either a vertical or horizontal section, respectively.
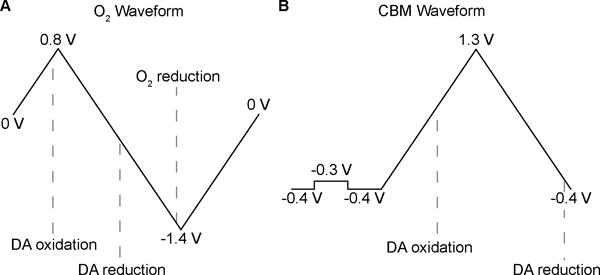
To detect both dopamine and oxygen with FSCV, an oxygen-sensitive waveform was employed (Fig. 1A). The applied potential scanned from 0 to 0.8 V, then to −1.4 V before returning to a 0 V holding potential at a rate of 400 V/s every 200 ms. The holding potential was applied to the electrode for 5 ms preceding and following the application of the waveform to allow amplifier settling. Between CV recordings, the amplifier connected to the carbon-fiber electrode was switched to a voltage follower to record electrophysiology. Digitizer software (Plexon, Dallas, TX) recorded single-unit action potentials and Offline Sorter (Plexon, Dallas, TX) was used to remove interfering signals and group units using principal component analysis.
Figure 1.
DC potential electrophysiological recordings required modifications to the headstage design (UNC Electronics Facility) so that the voltage at the carbon-fiber electrode first passed through a unity gain voltage-follower, then a constant voltage-following amplifier (Tektronix AM 502 Differential Amplifier, Beaverton, OR), and finally a low-pass filter the data from DC to 100 Hz (gain ×100). In-house software (UNC Electronics Facility) was temporally aligned to voltammetry data by a TTL-pulse. We continuously recorded the voltage output from the amplifier at 10 kHz. A MATLAB (Natick, MA) script averaged 30 data points occurring 20 ms before application of the waveform to obtain one voltage value every 200 ms. This minimized noise and allowed the amplifier to settle after applying the voltammetric waveform.
Signal Verification
The extensive redistribution of ions that occurs during SD produces significant capacitive peaks in the recorded CVs, which occur simultaneously with signals of interest. To verify the electrochemical measurements of oxygen, we compared FSCV responses to traces obtained with amperometry, a technique that is immune to capacitive changes.26 We recorded two SD signals obtained at the same location with FSCV using the oxygen-sensitive waveform, and then made amperometric measurements, at the same location, of an additional two SD waves by holding the carbon fiber at −1 V to reduce oxygen.
To verify dopamine signals we used a convolution-based method to measure and remove non-faradaic components from the CVs.27 For this method, the waveform was also scanned at 400 V/s. The scans were preceded by a 1.5-ms step from −0.4 to −0.3 V and back to −0.4 V for 1.5 ms. This potential step was used to compute the impedance of the carbon fiber immediately before collection of the cyclic voltammogram generated by a triangle ramp from −0.4 V to +1.3 V that returns to −0.4 V (Fig. 1B). The UEI filtering was set to 10 kHz to avoid filtering artifacts during application of the step function. An in-house LabVIEW (National Instruments, Austin, TX) program uses the electrode’s current response to the +0.1 V step to predict and remove interfering impedance effects from the measured CVs, revealing the faradaic signal.27
Animal Care and Stereotaxic Surgery
All procedures were approved by the Institutional Animal Care and Use Committee of the University of North Carolina at Chapel Hill. Male Sprague-Dawley rats (350–550 g, Charles River Laboratories) were anesthetized by intraperitoneal injection of urethane (1.5 g/kg) and placed in a stereotaxic frame (Kopf, Tujunga, CA). The scalp was excised to expose the skull. Burr holes were drilled for insertion of the electrode and the stimulus to generate SD. All coordinates are in reference to bregma (Paxinos and Watson, 2007). Coordinates for the carbon-fiber recording electrode were +2.2 mm anterior-posterior (AP) and +1.7 mm medial-lateral (ML). The recording electrode was lowered −0.8 to −2.1 mm dorsal-ventral (DV) for motor cortex studies and −6.9 to −7.4 mm DV for those in the NAc. For single-unit recordings, the DV coordinate of the electrode was optimized for a location where spontaneous neuronal firing was detected. A chloridized silver wire served as the reference electrode and was fixed in the contralateral hemisphere with a stainless steel screw. Burr holes were drilled at −0.8 AP, +0.8 ML; −0.8 AP, +3.2 ML; and −2.8 AP, +1.7 ML to allow for pinpricks or microinjections of KCl to stimulate waves of SD 3–5 mm away from the recording site. Pinpricks were delivered first with 27- or 22-G hypodermic needles to 7.5 mm DV. If this technique failed to produce a SD recorded at the carbon-fiber electrode, a stronger stimulus of a KCl microinjection was used. A 33-G infusion needle (Plastics One Inc., Roanoke, VA) attached with plastic tubing to a 10-μL Hamilton syringe was used to manually inject 2 μL of KCl, at a concentration of 0.25 or 1 M, using the lowest required for initiating a SD. Stimulations were repeated every 20 minutes to allow for recovery between SDs.
Calibrations
Electrodes were post-calibrated in an air-impermeable flow-injection analysis system to obtain sensitivity values for oxygen and dopamine. We determined calibration factors of 1.12 nA/μM for dopamine at its oxidative peak (+0.65 V) and −0.3 nA/μM for oxygen at its reductive peak (−1.33 V) for the oxygen sensitive waveform; 7.95 nA/μM dopamine for the convolution-based method waveform; and −0.059 nA/μM for oxygen using amperometry at −1 V. The current values recorded are converted to concentrations with the calibration factors. The factors are negative for oxygen because its reduction current is used for quantification.
Resistance recordings of electrodes were made with Axopatch 200B patch clamp amplifier (Axon Instruments, Foster City, CA).
Statistical Analysis
Two-tailed, paired t-tests and Pearson’s correlation tests were performed with GraphPad Prism 4 (GraphPad Software, San Diego, CA) and p < 0.05 was considered statistically significant.
Results and Discussion
Simultaneously obtained oxygen, dopamine, and DC potentials during SD
Recordings of widespread cellular depolarization serve as the gold-standard for identifying SD events.22, 23 Cells fire bursts of action potentials at the onset of the depolarizing wave and then remain in a quiescent state for several minutes as energy stores are replenished and ion gradients are reestablished.20, 21 In compromised tissue, cells may be electrically silent, but still exhibit a depolarization. In both instances, a negative shift in the DC potential occurs, indicative of widespread cellular depolarization.14, 22–24 Additionally, recordings of DC potential shifts during SD events provide a quantitative measure of the duration of the tissue depolarization. Therefore, we modified our system to record constantly the voltage at the carbon-fiber electrode through a separate DC-coupled amplifier, permitting measurement of extracellular DC potentials.
Fig. 2 shows the results of our multimodal sensing capability, with simultaneous oxygen, dopamine, and DC potential recordings. Oxygen and dopamine concentration traces are obtained from the currents displayed in false color in the color plots at their respective reduction or oxidation potentials. DC potentials are recorded simultaneously, using a separate hardware filter. Our combined approach realizes a need in the field of SD research for an improved characterization method, amenable to recordings in compromised or healthy tissue in all brain regions. Additionally, the carbon-fiber microelectrode is much smaller (5-μm diameter) than traditionally used microdialysis sensors13, 15; probes of this size do not elicit SD upon implantation, which can alter the tissue’s responsivity.28 The use of multiple sensors not only damages tissue, but complicates the temporal alignment of measurements. Other studies with combined electrophysiology and dopamine recordings have been unable to discern the difference in onset time for the two signals.12, 29, 30 With our time-locked recordings at high temporal resolution (5 Hz), we found that the DA signal onset followed the DC potential onset by 6.8 ± 0.9 s (average ± SEM, n = 8 subjects).
Figure 2.
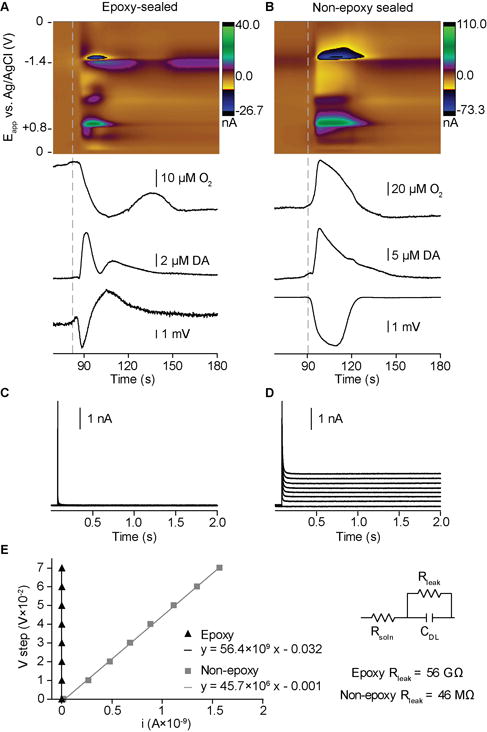
Investigators in the voltammetry field use both conventional carbon-fiber electrodes as well as epoxy-sealed electrodes with improved glass-fiber seals.31 The latter are preferred for voltammetry because they have lower background currents. However, the epoxy-sealed electrodes distorted the shape of the DC potential changes because of their stronger capacitive coupling to the solution (Fig. 2A,C,E). Thus, the DC shifts appeared multi-phasic and derivative-like, similar to AC-filtered recordings.23 We evaluated the capacitive and resistive characteristics of both electrode types by applying potential steps (Fig. 2C,D,E). Non-epoxy sealed electrodes preserved the shape of the negative DC shifts during in vivo SD recordings due to their decreased “leak” resistance, caused by imperfections in the glass-fiber seal (Fig. 2B,D,E). However, the magnitude of the recorded potentials is attenuated due to the capacitive elements selecting against slow frequency changes. The epoxy-sealed electrodes (n = 7) recorded shifts of 5.7 ± 0.6 mV with typical RMS noise of 133 μV; and, the non-epoxy electrodes (n = 6) recorded shifts of 2.3 ± 0.7 mV with noise levels of 19 μV. Though the two electrode types were unable to record SD events at the same location in any given subject, the electrochemical and electrophysiological data for both are consistent with expected SD patterns (vide infra).
Repeated waves of SD yield highly reproducible signals
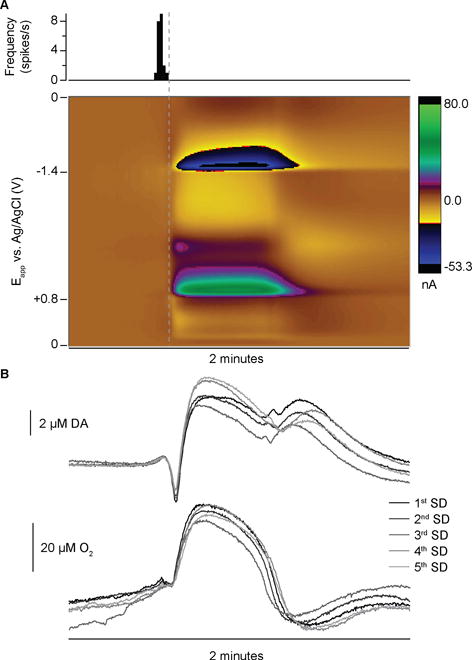
A pinprick or KCl stimulus, delivered at 20-minute intervals, elicited SD waves 3–5 mm away from our recording electrode. Consistent with the slow speed of travel of SD waves, the electrochemical and electrophysiological signals appeared at our sensor about 2 minutes after stimulation.2, 3 The initial event observed was an increase in single-unit firing or decrease in DC potential. This was followed by an array of large, overlapping signals in the color plot of the cyclic voltammetry recordings, lasting ~1–2 minutes (Fig. 3A,B). These results conform to the expected supraphysiological surge of chemical and electrical activity that radiates from a traumatized brain region, which includes concomitant shifts in ions, pH, oxygen, and neurotransmitters.2, 3, 11, 12, 32–34 For a given location, successive SD signals were very similar (Fig. 2B), consistent with the “all-or-none” characteristic2 of the depolarizing wave. This allows for within animal controls. The time to SD onset following stimulation typically varied by ~20s; the concentration traces in Fig. 2B are aligned to the SD onset.
Figure 3.
Interpretation of SD signals in FSCV measurements
FSCV produces multivariate data sets, which allow for identification of multiple signals and interfering currents. The most prominent features of SD in the background-subtracted CVs are capacitive peaks following the switching potentials (SPs) of the applied waveform (+0.8 V and −1.4 V for the oxygen-sensitive waveform, Fig. 4). These tend to obscure the current from the faradaic reactions of oxygen and dopamine. A large background current is generated by charging the electrical double layer when using high scan rates, as in FSCV.35 However, the massive change in ionic concentrations during SD and the adsorption of ions to the electrode alters the double-layer capacitance, thus changing the background current.27, 36 The altered capacitance manifests most strongly as peaks at the switching potentials of the background-subtracted CVs because the polarity of the scan reverses, necessitating the discharge and recharge of the capacitance. The capacitive peaks are then time-delayed because of the low-pass filtering of the UEI.
Figure 4.
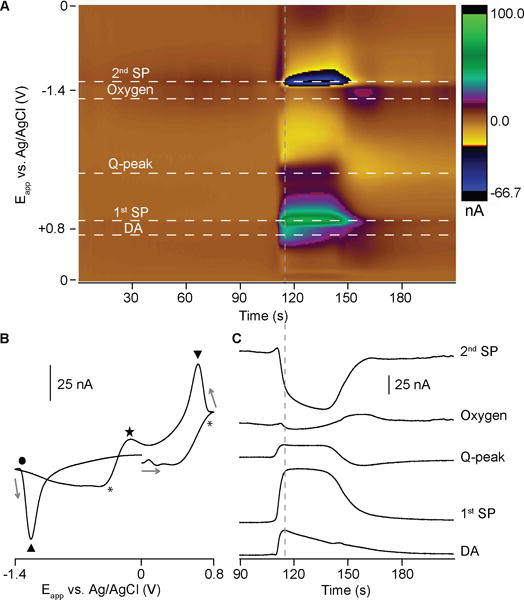
Another component of the electrochemical SD signal arises from pH-dependent redox of quinone moieties on the carbon-fiber surface (Q-peak, Fig. 4).36, 37 The electrochemical reaction of quinone surface groups involves electrons and protons, and contributes current to the background signal. Consequently, the change in pH that occurs during SD events32, 33 shifts the oxidation and reduction potentials of this process, producing prominent signals in the background-subtracted color plot. The first peak of the redox couple overlaps the dopamine oxidation current and the second peak is more well-defined at −0.1 V on the reductive scan.36, 38
SD produces capacitive and pH signals of a confounding magnitude, not seen in previous FSCV literature.38–40 Interfering currents in color plots are commonly resolved from catecholamine signals through principal component regression analysis (PCR).41 However, the large magnitude and temporal overlap of the various responses in SD precludes obtaining the independent standards required to build a training set for PCR.41–43 Therefore we employed other methods to verify dopamine and oxygen currents.
Varied temporal evolution of the overlapping signals allows for dopamine identification
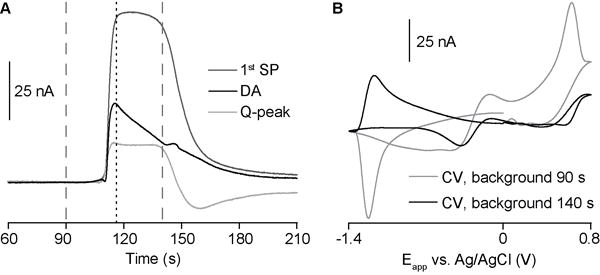
CVs taken during the wave of SD (Fig. 4B) do not resemble those for dopamine, due to the overlapping ionic- and pH-based signals. However, we took advantage of the different temporal characteristics of the signals for dopamine oxidation and the interfering currents to obtain an improved CV. The background signal in FSCV is typically set at a time where there are no significant changes (i.e., quiescent baseline). In Fig. 5, the background for subtraction is instead set at a time during the SD where the interfering currents (SPs and Q-peak) are near maximum and the dopamine signal has partially decayed. Most of the interfering signal is subtracted, generating a CV with the characteristic oxidative and reductive peaks assigned to a dopamine concentration increase (Fig. 5B, black CV). Although this approach yields an improved CV, the concentration trace for dopamine still contains other signal components.
Figure 5.
Convolution-based prediction improves dopamine CVs and concentration profiles
We employed a convolution-based method with enhanced dopamine sensitivity and selectivity to verify dopamine release currents during SD.27 The negative holding potential (−0.4 V) pre-concentrates dopamine at the electrode surface, and the extended positive limit (+1.3 V) prevents fouling of the electrode surface and enhances adsorption of dopamine.44 The +0.1 V potential step probes the impedance changes occurring at the time of each waveform application, and convolution of the triangular wave with the derivative of this response predicts the corresponding background signal (or generated charging current) in the existing impedance state. This enables removal of the interfering, capacitive (nonfaradaic) currents that arise from ionic changes that are a hallmark of SD (Fig. 6). After subtraction of convolution-based predictions of non-faradaic current, the color plot and CV clearly show the redox peaks indicative of a large increase in dopamine (compare CVs in Fig. 4B and Fig. 6C to dopamine CV in Fig. 3 of REF 44).44 We obtained peak values of 8.2 ± 1.7 μM dopamine (n = 7 subjects), which agrees with recordings made during SD in the striatum with less selective voltammetric techniques and, more recently, with microdialysis.12, 29, 30 It is important to keep in mind that calibration curves for dopamine with FSCV deviate from linearity above ~5 μM,44 which could lead to an underestimation of the concentration. Also, during SD, the extracellular space shrinks, causing an enhanced increase in concentration for a given increase in quantity of a species.3 However, this concentration is orders of magnitude larger than physiological transients (100–200 nM),45–47 highlighting the supraphysiological nature of this phenomenon.
Figure 6.
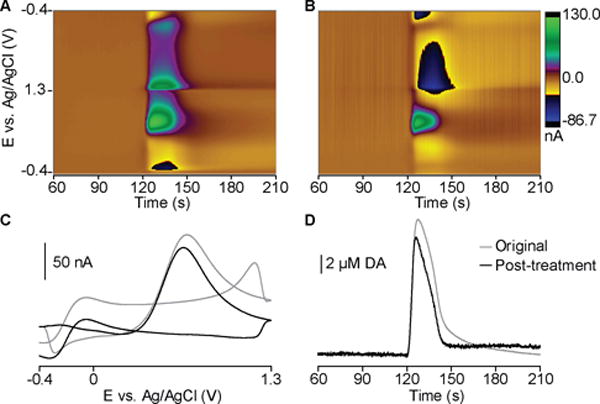
The difference in dopamine peak current before and after convolution-based data treatment was 14.8 ± 2.2%, revealing non-trivial contribution from capacitive currents. The quantification accuracy over the full time course is improved (Fig. 6D), which is vital to investigations of release dynamics. Few studies examine the effects of monoamines in SD, though dopamine is implicated in ischemic damage of catecholaminergic nerve terminals48–50 and serotonin receptor activation contributes to the hyperemic response during cortical SD.51 FSCV is ideal for future studies investigating these electroactive neurotransmitters.
Amperometry verifies selectivity for oxygen measurements in FSCV during SD
FSCV is a more selective electrochemical technique than amperometry, as it records currents generated over a range of potentials instead of one potential. The CV thus aids in differentiating between the array of reversibly and irreversibly oxidized species in the brain such as dopamine, norepinephrine, serotonin, ascorbic acid, DOPAC, and uric acid.44 However, as shown here, the FSCV measurements during SD are complicated by the nonfaradaic currents generated by ionic changes. Amperometric detection of oxygen at carbon electrodes is highly selective due to the absence of in vivo compounds reducing at similar potentials (−0.6 to −1.0 V), the immunity to nonfaradaic signals, as well as its insensitivity to changes caused by pH or temperature fluctuations.26, 52, 53 For these reasons, amperometry is widely used to measure in vivo oxygen.17, 26, 54, 55 Therefore, we employed amperometry to confirm that oxygen currents were devoid of interference.
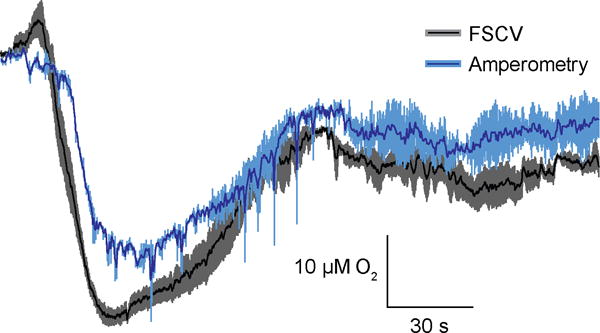
The same carbon-fiber electrode was used for both FSCV and amperometry recordings during SD within subjects. Epoxy-sealed electrodes must be used for amperometric recordings to avoid generating current due to the change in resistance of the extracellular media. We compared two oxygen traces obtained by FSCV during SD to two consecutive oxygen traces recorded with amperometry (Fig. 7). The peak concentrations recorded with the two methods were not significantly different (two-tailed, paired t-test, p = 0.40, n = 5), while the concentration-over-time traces exhibited a significant correlation (Pearson’s R = 0.87, p < 0.0001, n = 5), confirming that FSCV oxygen traces were free from interfering currents.
Figure 7.
Conclusion
SD is involved in pathological processes and promotes lesion growth in compromised neural tissue. Characterizing SD waves is crucial to improve diagnostics and develop therapeutic interventions. Due to the array of changes occurring during SD, multimodal sensing is employed which often requires multiple probes, complicating experimental procedures and producing greater tissue damage. We have optimized FSCV at carbon-fiber microelectrodes for minimally-invasive recordings of oxygen and neurotransmitters during SD with simultaneous single-unit or DC potential electrophysiological verification. Substantial, overlapping signals are produced due to the extensive ionic, pH, oxygen, and neurotransmitter changes during SD. Though we were unable to use PCR for signal authentication, we verified the recordings of oxygen and dopamine by amperometry and a convolution-based method, respectively. As proof-of-concept, we recorded signals of SD in the NAc, revealing large oxygen changes and supraphysiological release of dopamine during the depolarizing wave. FSCV is a powerful technique for minimally-invasive, multimodal recordings of chemical and electrophysiological changes during SD in all brain regions.
Supplementary Material
Acknowledgments
Douglas C. Kirkpatrick for electrode resistance data used in Figure 2C,D,E.
Funding
This research was supported by a grant from the NIH (DA032530 to R.M.W.).
Abbreviations
- CV
cyclic voltammogram
- DA
dopamine
- FSCV
Fast-scan cyclic voltammetry
- NAc
nucleus accumbens
- PCR
principle component regression
- O2
oxygen
- SD
spreading depolarization
- SPs
switching potentials
Footnotes
Author contributions
C.N.H carried out data collection and analysis and wrote the manuscript. J.A.J developed the convolution-based method and the associated analysis software. M.D.V. made hardware adjustments, enabling DC potential recordings. M.D.V. developed software for data acquisition and data analysis of DC potentials. R.M.W. conceived the sensor. All authors read and approved the final version of this manuscript.
Notes
The authors declare no competing financial interest.
References
- 1.Lauritzen M, Dreier JP, Fabricius M, Hartings JA, Graf R, Strong AJ. Clinical relevance of cortical spreading depression in neurological disorders: migraine, malignant stroke, subarachnoid and intracranial hemorrhage, and traumatic brain injury. J Cereb Blood Flow Metab. 2011;31:17–35. doi: 10.1038/jcbfm.2010.191. [DOI] [PMC free article] [PubMed] [Google Scholar]
- 2.Somjen GG. Mechanisms of spreading depression and hypoxic spreading depression-like depolarization. Physiol Rev. 2001;81:1065–1096. doi: 10.1152/physrev.2001.81.3.1065. [DOI] [PubMed] [Google Scholar]
- 3.Dreier JP. The role of spreading depression, spreading depolarization and spreading ischemia in neurological disease. Nat Med. 2011;17:439–447. doi: 10.1038/nm.2333. [DOI] [PubMed] [Google Scholar]
- 4.Mies G, Iijima T, Hossmann K-A. Correlation between periinfarct DC shifts and ischaemic neuronal damage in rat. Neuroreport. 1993;4:709–711. doi: 10.1097/00001756-199306000-00027. [DOI] [PubMed] [Google Scholar]
- 5.Takano K, Latour LL, Formato JE, Carano RA, Helmer KG, Hasegawa Y, Fisher M. The role of spreading depression in focal ischemia evaluated by diffusion mapping. Ann Neurol. 1996;39:308–318. doi: 10.1002/ana.410390307. [DOI] [PubMed] [Google Scholar]
- 6.Dijkhuizen RM, Beekwilder JP, van der Worp HB, van der Sprenkel JWB, Tulleken KAF, Nicolay K. Correlation between tissue depolarizations and damage in focal ischemic rat brain. Brain Res. 1999;840:194–205. doi: 10.1016/s0006-8993(99)01769-2. [DOI] [PubMed] [Google Scholar]
- 7.Hartings JA, Rolli ML, Lu XC, Tortella FC. Delayed secondary phase of peri-infarct depolarizations after focal cerebral ischemia: relation to infarct growth and neuroprotection. J Neurosci. 2003;23:11602–11610. doi: 10.1523/JNEUROSCI.23-37-11602.2003. [DOI] [PMC free article] [PubMed] [Google Scholar]
- 8.Gill R, Andine P, Hillered L, Persson L, Hagberg H. The effect of MK-801 on cortical spreading depression in the penumbral zone following focal ischaemia in the rat. J Cereb Blood Flow Metab. 1992;12:371–379. doi: 10.1038/jcbfm.1992.54. [DOI] [PubMed] [Google Scholar]
- 9.Chen Q, Chopp M, Bodzin G, Chen H. Temperature modulation of cerebral depolarization during focal cerebral ischemia in rats: correlation with ischemic injury. J Cereb Blood Flow Metab. 1993;13:389–394. doi: 10.1038/jcbfm.1993.52. [DOI] [PubMed] [Google Scholar]
- 10.Rawanduzy A, Hansen A, Hansen TW, Nedergaard M. Effective reduction of infarct volume by gap junction blockade in a rodent model of stroke. J Neurosurg. 1997;87:916–920. doi: 10.3171/jns.1997.87.6.0916. [DOI] [PubMed] [Google Scholar]
- 11.Hansen AJ, Zeuthen T. Extracellular ion concentrations during spreading depression and ischemia in the rat brain cortex. Acta physiologica Scandinavica. 1981;113:437–445. doi: 10.1111/j.1748-1716.1981.tb06920.x. [DOI] [PubMed] [Google Scholar]
- 12.Moghaddam B, Schenk JO, Stewart WB, Hansen AJ. Temporal Relationship between Neurotransmitter Release and Ion Flux during Spreading Depression and Anoxia. Can J Physiol Pharm. 1987;65:1105–1110. doi: 10.1139/y87-173. [DOI] [PubMed] [Google Scholar]
- 13.Fabricius M, Jensen LH, Lauritzen M. Microdialysis of interstitial amino acids during spreading depression and anoxic depolarization in rat neocortex. Brain Res. 1993;612:61–69. doi: 10.1016/0006-8993(93)91644-8. [DOI] [PubMed] [Google Scholar]
- 14.Dreier JP, Fabricius M, Ayata C, Sakowitz OW, William Shuttleworth C, Dohmen C, Hartings JA. Recording, analysis, and interpretation of spreading depolarizations in neurointensive care: Review and recommendations of the COSBID research group. J Cereb Blood Flow Metab. 2016 doi: 10.1177/0271678X16654496. [DOI] [PMC free article] [PubMed] [Google Scholar]
- 15.Rogers ML, Feuerstein D, Leong CL, Takagaki M, Niu X, Graf R, Boutelle MG. Continuous online microdialysis using microfluidic sensors: dynamic neurometabolic changes during spreading depolarization. ACS Chem Neurosci. 2013;4:799–807. doi: 10.1021/cn400047x. [DOI] [PMC free article] [PubMed] [Google Scholar]
- 16.Hinzman JM, DiNapoli VA, Mahoney EJ, Gerhardt GA, Hartings JA. Spreading depolarizations mediate excitotoxicity in the development of acute cortical lesions. Exp Neurol. 2015;267:243–253. doi: 10.1016/j.expneurol.2015.03.014. [DOI] [PubMed] [Google Scholar]
- 17.Balanca B, Meiller A, Bezin L, Dreier JP, Marinesco S, Lieutaud T. Altered hypermetabolic response to cortical spreading depolarizations after traumatic brain injury in rats. J Cereb Blood Flow Metab. 2017;37:1670–1686. doi: 10.1177/0271678X16657571. [DOI] [PMC free article] [PubMed] [Google Scholar]
- 18.Vasylieva N, Marinesco S, Barbier D, Sabac A. Silicon/SU8 multi-electrode micro-needle for in vivo neurochemical monitoring. Biosens Bioelectron. 2015;72:148–155. doi: 10.1016/j.bios.2015.05.004. [DOI] [PubMed] [Google Scholar]
- 19.Rogers ML, Leong CL, Gowers SA, Samper IC, Jewell SL, Khan A, Boutelle MG. Simultaneous monitoring of potassium, glucose and lactate during spreading depolarisation in the injured human brain - Proof of principle of a novel real-time neurochemical analysis system, continuous online microdialysis. J Cereb Blood Flow Metab. 2017;37:1883–1895. doi: 10.1177/0271678X16674486. [DOI] [PMC free article] [PubMed] [Google Scholar]
- 20.Grafstein B. Mechanism of spreading cortical depression. J Neurophysiol. 1956;19:154–171. doi: 10.1152/jn.1956.19.2.154. [DOI] [PubMed] [Google Scholar]
- 21.Gorelova N, Koroleva V, Amemori T, Pavlik V, Bureš J. Ketamine blockade of cortical spreading depression in rats. Electroencephalogr Clin Neurophysiol. 1987;66:440–447. doi: 10.1016/0013-4694(87)90213-6. [DOI] [PubMed] [Google Scholar]
- 22.Leao AA. Further observations on the spreading depression of activity in the cerebral cortex. J Neurophys. 1947;10:409–414. doi: 10.1152/jn.1947.10.6.409. [DOI] [PubMed] [Google Scholar]
- 23.Fabricius M, Fuhr S, Bhatia R, Boutelle M, Hashemi P, Strong AJ, Lauritzen M. Cortical spreading depression and peri-infarct depolarization in acutely injured human cerebral cortex. Brain. 2006;129:778–790. doi: 10.1093/brain/awh716. [DOI] [PubMed] [Google Scholar]
- 24.Hartings JA, Watanabe T, Bullock MR, Okonkwo DO, Fabricius M, Woitzik J, Strong AJ. Spreading depolarizations have prolonged direct current shifts and are associated with poor outcome in brain trauma. Brain. 2011;134:1529–1540. doi: 10.1093/brain/awr048. [DOI] [PubMed] [Google Scholar]
- 25.Takmakov P, McKinney CJ, Carelli RM, Wightman RM. Instrumentation for fast-scan cyclic voltammetry combined with electrophysiology for behavioral experiments in freely moving animals. Review Sci Instrum. 2011;82:074302. doi: 10.1063/1.3610651. [DOI] [PMC free article] [PubMed] [Google Scholar]
- 26.Bolger FB, McHugh SB, Bennett R, Li J, Ishiwari K, Francois J, Lowry JP. Characterisation of carbon paste electrodes for real-time amperometric monitoring of brain tissue oxygen. J Neurosci Methods. 2011;195:135–142. doi: 10.1016/j.jneumeth.2010.11.013. [DOI] [PubMed] [Google Scholar]
- 27.Johnson JA, Hobbs CN, Wightman RM. Removal of Differential Capacitive Interferences in Fast-Scan Cyclic Voltammetry. Anal Chem. 2017 doi: 10.1021/acs.analchem.7b01005. [DOI] [PMC free article] [PubMed] [Google Scholar]
- 28.Verhaegen MJ, Todd MM, Warner DS, James B, Weeks JB. The role of electrode size on the incidence of spreading depression and on cortical cerebral blood flow as measured by H2 clearance. J Cereb Blood Flow Metab. 1992;12:230–237. doi: 10.1038/jcbfm.1992.33. [DOI] [PubMed] [Google Scholar]
- 29.Ngo KT, Varner EL, Michael AC, Weber SG. Monitoring Dopamine Responses to Potassium Ion and Nomifensine by in Vivo Microdialysis with Online Liquid Chromatography at One-Minute Resolution. ACS Chem Neurosci. 2017 doi: 10.1021/acschemneuro.6b00383. [DOI] [PMC free article] [PubMed] [Google Scholar]
- 30.Nagy G, Moghaddam B, Oke A, Adams RN. Simultaneous monitoring of voltammetric and ion-selective electrodes in mammalian brain. Neurosci Lett. 1985;55:119–124. doi: 10.1016/0304-3940(85)90005-9. [DOI] [PubMed] [Google Scholar]
- 31.Rodeberg NT, Sandberg SG, Johnson JA, Phillips PE, Wightman RM. Hitchhiker’s Guide to Voltammetry: Acute and Chronic Electrodes for in vivo Fast-Scan Cyclic Voltammetry. ACS Chem Neurosci. 2017;8:221–234. doi: 10.1021/acschemneuro.6b00393. [DOI] [PMC free article] [PubMed] [Google Scholar]
- 32.Mutch WA, Hansen AJ. Extracellular pH changes during spreading depression and cerebral ischemia: mechanisms of brain pH regulation. J Cereb Blood Flow Metab. 1984;4:17–27. doi: 10.1038/jcbfm.1984.3. [DOI] [PubMed] [Google Scholar]
- 33.Somjen GG. Acidification of interstitial fluid in hippocampal formation caused by seizures and by spreading depression. Brain Res. 1984;311:186–188. doi: 10.1016/0006-8993(84)91416-1. [DOI] [PubMed] [Google Scholar]
- 34.Ayata C, Lauritzen M. Spreading Depression, Spreading Depolarizations, and the Cerebral Vasculature. Physiol Rev. 2015;95:953–993. doi: 10.1152/physrev.00027.2014. [DOI] [PMC free article] [PubMed] [Google Scholar]
- 35.Robinson DL, Hermans A, Seipel AT, Wightman RM. Monitoring rapid chemical communication in the brain. Chem Rev. 2008;108:2554–2584. doi: 10.1021/cr068081q. [DOI] [PMC free article] [PubMed] [Google Scholar]
- 36.Takmakov P, Zachek MK, Keithley RB, Bucher ES, McCarty GS, Wightman RM. Characterization of local pH changes in brain using fast-scan cyclic voltammetry with carbon microelectrodes. Anal Chem. 2010;82:9892–9900. doi: 10.1021/ac102399n. [DOI] [PMC free article] [PubMed] [Google Scholar]
- 37.Kawagoe KT, Garris PA, Wightman RM. pH-Dependent processes at Nafion®-coated carbon-fiber microelectrodes. J Electroanal Chem. 1993;359:193–207. [Google Scholar]
- 38.Venton BJ, Michael DJ, Wightman RM. Correlation of local changes in extracellular oxygen and pH that accompany dopaminergic terminal activity in the rat caudate–putamen. J Neurochem. 2003;84:373–381. doi: 10.1046/j.1471-4159.2003.01527.x. [DOI] [PubMed] [Google Scholar]
- 39.Jones SR, Mickelson GE, Collins LB, Kawagoe KT, Wightman RM. Interference by pH and Ca2+ ions during measurements of catecholamine release in slices of rat amygdala with fast-scan cyclic voltammetry. J Neurosci Methods. 1994;52:1–10. doi: 10.1016/0165-0270(94)90048-5. [DOI] [PubMed] [Google Scholar]
- 40.Kume-Kick J, Rice ME. Dependence of dopamine calibration factors on media Ca2+ and Mg2+ at carbon-fiber microelectrodes used with fast-scan cyclic voltammetry. J Neurosci Methods. 1998;84:55–62. doi: 10.1016/s0165-0270(98)00087-9. [DOI] [PubMed] [Google Scholar]
- 41.Keithley RB, Heien ML, Wightman RM. Multivariate concentration determination using principal component regression with residual analysis. Trends Anal Chem. 2009;28:1127–1136. doi: 10.1016/j.trac.2009.07.002. [DOI] [PMC free article] [PubMed] [Google Scholar]
- 42.Johnson JA, Rodeberg NT, Wightman RM. Failure of Standard Training Sets in the Analysis of Fast-Scan Cyclic Voltammetry Data. ACS Chem Neurosci. 2016;7:349–359. doi: 10.1021/acschemneuro.5b00302. [DOI] [PMC free article] [PubMed] [Google Scholar]
- 43.Rodeberg NT, Johnson JA, Cameron CM, Saddoris MP, Carelli RM, Wightman RM. Construction of Training Sets for Valid Calibration of in Vivo Cyclic Voltammetric Data by Principal Component Analysis. Anal Chem. 2015;87:11484–11491. doi: 10.1021/acs.analchem.5b03222. [DOI] [PMC free article] [PubMed] [Google Scholar]
- 44.Heien ML, Phillips PE, Stuber GD, Seipel AT, Wightman RM. Overoxidation of carbon-fiber microelectrodes enhances dopamine adsorption and increases sensitivity. Analyst. 2003;128:1413–1419. doi: 10.1039/b307024g. [DOI] [PubMed] [Google Scholar]
- 45.Robinson DL, Heien ML, Wightman RM. Frequency of dopamine concentration transients increases in dorsal and ventral striatum of male rats during introduction of conspecifics. J Neurosci. 2002;22:10477–10486. doi: 10.1523/JNEUROSCI.22-23-10477.2002. [DOI] [PMC free article] [PubMed] [Google Scholar]
- 46.Owesson-White CA, Ariansen J, Stuber GD, Cleaveland NA, Cheer JF, Mark Wightman R, Carelli RM. Neural encoding of cocaine-seeking behavior is coincident with phasic dopamine release in the accumbens core and shell. Eur J Neurosci. 2009;30:1117–1127. doi: 10.1111/j.1460-9568.2009.06916.x. [DOI] [PMC free article] [PubMed] [Google Scholar]
- 47.Fox ME, Mikhailova MA, Bass CE, Takmakov P, Gainetdinov RR, Budygin EA, Wightman RM. Cross-hemispheric dopamine projections have functional significance. Proc Natl Acad Sci USA. 2016;113:6985–6990. doi: 10.1073/pnas.1603629113. [DOI] [PMC free article] [PubMed] [Google Scholar]
- 48.Weinberger J, Cohen G. Nerve-Terminal Damage in Cerebral-Ischemia - Greater Susceptibility of Catecholamine Nerve-Terminals Relative to Serotonin Nerve-Terminals. Stroke. 1983;14:986–989. doi: 10.1161/01.str.14.6.986. [DOI] [PubMed] [Google Scholar]
- 49.Globus MY-T, Ginsberg MD, Dietrich WD, Busto R, Scheinberg P. Substantia nigra lesion protects against ischemic damage in the striatum. Neurosci Lett. 1987;80:251–256. doi: 10.1016/0304-3940(87)90463-0. [DOI] [PubMed] [Google Scholar]
- 50.Buisson A, Callebert J, Mathieu E, Plotkine M, Boulu R. Striatal protection induced by lesioning the substantia nigra of rats subjected to focal ischemia. J Neurochem. 1992;59:1153–1157. doi: 10.1111/j.1471-4159.1992.tb08358.x. [DOI] [PubMed] [Google Scholar]
- 51.Gold L, Back T, Arnold G, Dreier J, Einhäupl KM, Reuter U, Dirnagl U. Cortical spreading depression-associated hyperemia in rats: involvement of serotonin. Brain Res. 1998;783:188–193. doi: 10.1016/s0006-8993(97)01341-3. [DOI] [PubMed] [Google Scholar]
- 52.Davies PW, Brink F., Jr Microelectrodes for measuring local oxygen tension in animal tissues. Review Sci Instrum. 1942;13:524–533. [Google Scholar]
- 53.Zimmerman JB, Wightman RM. Simultaneous electrochemical measurements of oxygen and dopamine in vivo. Anal Chem. 1991;63:24–28. doi: 10.1021/ac00001a005. [DOI] [PubMed] [Google Scholar]
- 54.Takano T, Tian GF, Peng W, Lou N, Lovatt D, Hansen AJ, Nedergaard M. Cortical spreading depression causes and coincides with tissue hypoxia. Nat Neurosci. 2007;10:754–762. doi: 10.1038/nn1902. [DOI] [PubMed] [Google Scholar]
- 55.Piilgaard H, Lauritzen M. Persistent increase in oxygen consumption and impaired neurovascular coupling after spreading depression in rat neocortex. J Cereb Blood Flow Metab. 2009;29:1517–1527. doi: 10.1038/jcbfm.2009.73. [DOI] [PubMed] [Google Scholar]
Associated Data
This section collects any data citations, data availability statements, or supplementary materials included in this article.


