

Abstract
GABAergic interneurons play important roles in cortical circuit development. However, there are multiple populations of interneurons and their respective developmental contributions remain poorly explored. Neuregulin 1 (NRG1) and its interneuron-specific receptor ERBB4 are critical genes for interneuron maturation. Using a conditional ErbB4 deletion, we tested the role of vasoactive intestinal peptide (VIP)-expressing interneurons in the postnatal maturation of cortical circuits in vivo. ErbB4 removal from VIP interneurons during development leads to changes in their activity, along with severe dysregulation of cortical temporal organization and state-dependence. These alterations emerge during adolescence, and mature animals in which VIP interneurons lack ErbB4 exhibit reduced cortical responses to sensory stimuli and impaired sensory learning. Our data support a key role for VIP interneurons in cortical circuit development and suggest a possible contribution to pathophysiology in neurodevelopmental disorders. These findings provide a new perspective on the role of GABAergic interneuron diversity in cortical development.
Introduction
GABAergic interneurons represent only a small fraction of all cortical neurons (~20%), but play critical roles in the establishment, maintenance, and function of cortical circuits. The diversity of inhibitory interneurons, which comprise a number of distinct classes with different intrinsic properties, morphology, synaptic targeting, and molecular markers, allows them to dynamically sculpt cortical activity during both development and mature function. Recent work has focused on three major interneuron populations: 1) cells that co-express the calcium binding protein parvalbumin (PV) and preferentially synapse on the cell bodies of excitatory neurons; 2) cells that co-express the peptide somatostatin (SST) and preferentially target the dendrites of excitatory neurons; and 3) cells that co-express vasoactive intestinal peptide (VIP) and preferentially target other interneurons (Kepecs and Fishell, 2014). Interneurons have been suggested to regulate early organizational activity patterns in the cortex and hippocampus (Allene et al., 2008; Bonifazi et al., 2009; Picardo et al., 2011) and to control the expression of critical period plasticity by excitatory neurons (Takesian and Hensch, 2013). Recent work has further suggested complex developmental interactions between populations of inhibitory interneurons (Anastasiades et al., 2016; Marques-Smith et al., 2016; Tuncdemir et al., 2016). Developmental dysregulation of GABAergic cells is associated with pathophysiology underlying neurodevelopmental disorders including autism and schizophrenia, as well as epilepsy (Rossignol, 2011). However, the precise roles of the major interneuron classes in the postnatal development of cortical circuits remain poorly understood.
VIP-expressing interneurons (VIP-INs) have recently gained attention as important regulators of cortical function (Lee et al., 2013; Pi et al., 2013; Fu et al., 2014; Karnani et al., 2016). VIP-INs are preferentially found in superficial cortical layers and are innervated by local and long-range excitatory inputs as well as serotonergic and cholinergic afferents (Lee et al., 2013; Fu et al., 2014; Pronneke et al., 2015; Kamigaki and Dan, 2017). VIP-INs are strongly recruited by negative or noxious stimuli and arousing events such as the onset of motor activity (Lee et al., 2013; Pi et al., 2013; Fu et al., 2014). In turn, they regulate cortical excitatory activity and sensory response gain through inhibition of pyramidal neurons and other interneurons (Lee et al., 2013; Pfeffer et al., 2013; Pi et al., 2013; Fu et al., 2014; Garcia-Junco-Clemente et al., 2017). VIP-INs integrate into cortical circuits early in postnatal life (Miyoshi et al., 2015). However, despite their powerful influence on cortical activity, nothing is known about how they shape normal development of the cerebral cortex or how their disruption affects cortical function.
The signaling factor Neuregulin-1 (Nrg-1) and its membrane-bound tyrosine kinase receptor ERBB4 (ErbB4) are elements of a signaling pathway critical for the proper development of inhibitory cortical and hippocampal circuits. ErbB4 expression is restricted to GABAergic neurons in the cortex (Yau et al., 2003; Flames et al., 2004; Neddens et al., 2011), and this pathway plays a role in regulating GABAergic synaptic development (Fazzari et al., 2010; Del Pino et al., 2013). ErbB4 signaling is necessary for normal interneuron migration and synapse formation during development (Fazzari et al., 2010; Shamir et al., 2012), and global disruptions of the Nrg-1/ErbB4 pathway lead to decreased GABA release in the mature cerebral cortex (Woo et al., 2007; Mei and Xiong, 2008; Neddens and Buonanno, 2010; Ting et al., 2011) and impaired circuit function in mature animals (Barz et al., 2015, 2016). Disruption of the Nrg1-ErbB4 pathway specifically in PV interneurons reduces excitatory synaptic input to these cells and appears to contribute to the behavioral and neural phenotypes observed in the total ErbB4 deletion model (Chen et al., 2010; Wen et al., 2010; Shamir et al., 2012; Del Pino et al., 2013). However, the role of Nrg-1/ErbB4 signaling in other cortical interneuron populations, such as VIP cells, is unknown.
Here we examined the role of VIP-INs in the development and function of cortical circuits. We perturbed VIP-IN function by deleting ErbB4 specifically from these cells. We find that early postnatal disruption of VIP-INs causes a profound, long-term dysregulation of cortical activity that emerges during adolescence. VIP-IN-specific loss of ErbB4 also perturbs behavioral state-dependent regulation of cortical circuits and impairs sensory processing. These effects are specific to VIP-INs in the cortex, suggesting a key role for these sparse interneurons in cortical circuit development. Finally, animals lacking ErbB4 in VIP-INs exhibit impairments in sensory learning and other behaviors, highlighting the functional consequences of cortical circuit disruption.
Results
Developmental deletion of ErbB4 from VIP interneurons
We directly tested whether developmental dysfunction of VIP interneurons impairs cortical circuits following disruption of the ErbB4-Nrg1 signaling pathway, using mouse primary visual cortex (V1) as a model for local circuit function. We found that ErbB4 expression in V1 was restricted to GABAergic interneurons and was present in most VIP- and parvalbumin- (PV) and some somatostatin-expressing (SST) interneurons (Figures 1A–B, S1A–C). We developmentally ablated Nrg1-ErbB4 signaling specifically in VIP-INs around P8-9 (Miyoshi et al., 2015) by generating ErbB4F/F,VIPCre mice (Figure 1A–B). We did not observe a decrease in the overall density of VIP-INs in the mutants (Figure 1C, S1D), suggesting that ErbB4 deletion did not lead to death or altered migration of these cells. The density of SST and PV-expressing interneurons was likewise unaffected (Figure S1E). To examine the broad functional consequences of ErbB4 deletion from VIP-INs, we performed a series of standard behavioral assays. Similarly to ErbB4 null mice (Shamir et al., 2012), ErbB4F/F,VIPCre mutants exhibited hyperactivity and altered levels of anxiety as shown by open field and marble burying behavior assays (Figure S1O–T).
Figure 1. ErbB4 deletion from VIP interneurons alters cortical spiking.
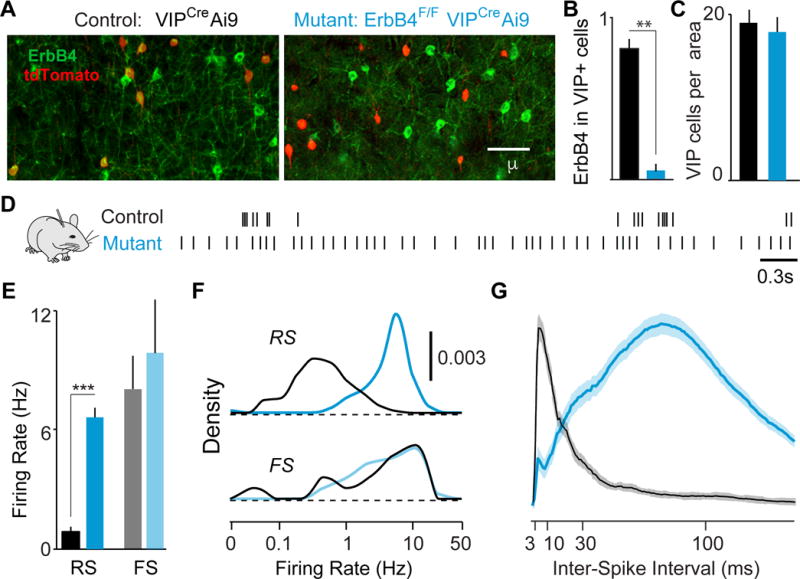
(A) ErbB4 and tdTomato immunohistochemistry in V1 cortex of control (black) and mutant (cyan) mice. Upon Cre recombination of the reporter line Ai9, VIP cells express tdTomato. (B) ErbB4 expression in VIP interneurons quantified as a fraction of cells double-labeled for ErbB4 and tdTomato over the total number of tdTomato labeled cells, in controls (black, n = 6 mice) and mutants (cyan, n = 6 mice). (C) Number of VIP fate-mapped cells per optical area in control and mutant mice. (D) Spike trains of example RS cells. (E) Average firing rate during quiescence. Controls: 153 RS, 15 FS cells, 8 mice. Mutants: 134 RS, 32 FS cells, 8 mice. (F) Distribution of firing rates across population. (G) Inter-spike interval histograms (normalized to max) during quiescence for all RS cells. Error bars show s.e.m. p**<0.01, p***<0.001.
Loss of key forms of temporally patterned cortical activity in ErbB4F/F,VIPCre mutants
To assay the effects of ErbB4 deletion on cortical activity, we performed extracellular recordings of regular spiking (RS; putative excitatory) neurons and fast spiking (FS; putative PV inhibitory) interneurons throughout cortical layers 2–6 in awake, head-fixed adult mutant and control mice (Figures 1, S1, Experimental Procedures). Surprisingly, deletion of ErbB4 from VIP-INs led to marked increases in the spontaneous cortical activity patterns of RS cells, whereas FS cells were unchanged. RS cells in mutants exhibited ~4-fold higher spontaneous firing rates than those in controls (Figure 1D–F). In addition, RS cells in mutants displayed abnormal temporal spiking properties, including reduced bursting (Figure 1G, S1M–N) and decreased firing rate variability (Figure S1N). These data suggest that early deletion of ErbB4 specifically from VIP-INs leads to increased activity of cortical excitatory neurons.
Rhythmic neuronal synchronization is a core feature of cortical activity, and reduced neural synchrony is a hallmark of schizophrenia and other disorders (Uhlhaas and Singer, 2010; Gandal et al., 2012). To examine the impact of ErbB4 deletion in VIP interneurons on the temporal patterning of cortical activity, we simultaneously recorded spiking activity and local field potentials (LFPs) in V1 (Figure 2A). Despite showing only modest changes in LFP power (Figures 2A, S2A), mutants showed a near-complete reduction in the phase-locking of individual RS cells to low-frequency and gamma LFP oscillations regardless of behavioral state (Figure 2A–D, S2B). Correlations between the spiking of simultaneously recorded RS-RS and RS-FS pairs were abolished in mutants (Figures 2E, S2C), further indicating a loss of synchronous firing. FS cells typically exhibit a high level of synchrony with other FS cells, largely due to dense chemical and electrical synaptic connectivity (Gibson et al., 1999). Surprisingly, FS-FS synchrony was unaffected in mutants (Figure 2E). These data indicate that early postnatal dysregulation of VIP-INs eliminates excitatory synchrony in cortical networks, disrupting several key forms of temporally organized activity that are important for information processing in cortical circuits (Fries, 2009).
Figure 2. Loss of VIP ErbB4 disrupts the temporal organization of cortical activity.
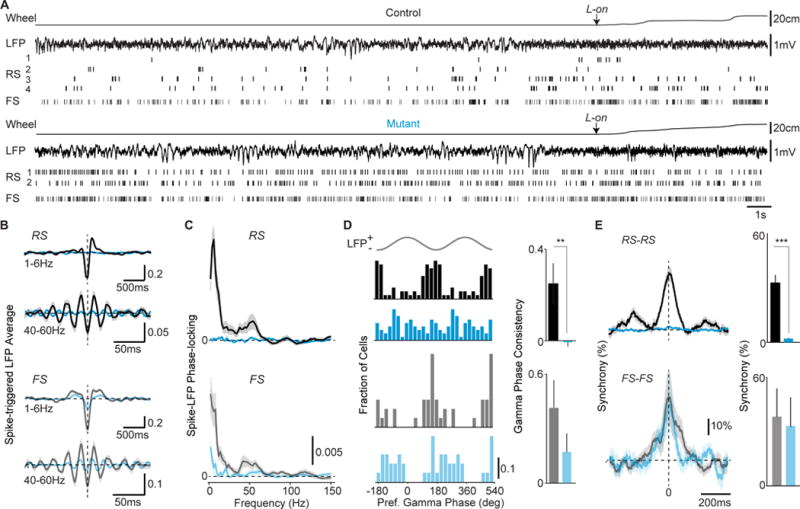
(A) Example wheel position and LFP traces, with single-unit activity, around locomotion-onset (L-on). Locomotion is shown as a linearized version of the wheel position. (B) Average spike-triggered LFP average in 40–60Hz and 1–6Hz bands during locomotion. Controls: 55 RS, 23 FS cells, 7 mice (black). Mutants: 61 RS, 23 FS, 8 mice (cyan). (C) Average spike-LFP phase-locking during locomotion. Control vs mutant significant in 1–6Hz (RS: p<0.05) and 40–60Hz (RS: p<0.05; FS: p<0.05). (D) Left: Preferred LFP gamma-phase of firing during locomotion. Right: Consistency of preferred LFP gamma-phases. (E) Left: Average normalized cross-correlograms during quiescence. Right: Percent-wise increase in zero-lag coincidences. RS-RS: Controls 192 pairs, 14 mice; Mutants 227 pairs, 5 mice. FS-FS: Controls n=15 pairs, 4 mice; Mutants 22 pairs, 3 mice. Error bars and shadings show s.e.m. p**<0.01, p***<0.001.
Developmental dysregulation of VIP interneurons abolishes cortical state transitions
Because VIP-INs are thought to contribute to arousal-mediated changes in cortical activity during locomotion (Fu et al., 2014), we tested the impact of ErbB4 deletion from these cells on the ability of cortical circuits to follow transitions in behavioral state. We recorded extracellular signals in V1 cortex of mice transitioning between quiescent and active periods (Vinck et al., 2015). In contrast to robust increases in spiking in control animals, RS cells in mutants showed no significant change in firing at locomotion onset (Figure 3A–C). Likewise, RS cells showed no significant change at locomotion offset, a separate period of high global arousal that is independent of motor activity and normally associated with decreased firing rates (Figure 3B,D) (Vinck et al., 2015). These data indicate an extensive loss of the cortical response to behavioral arousal and suggest that ErbB4 deletion from VIP-INs prevents locomotion- and arousal-related signals from reaching cortical excitatory neurons.
Figure 3. VIP ErbB4 deletion abolishes cortical state transitions.
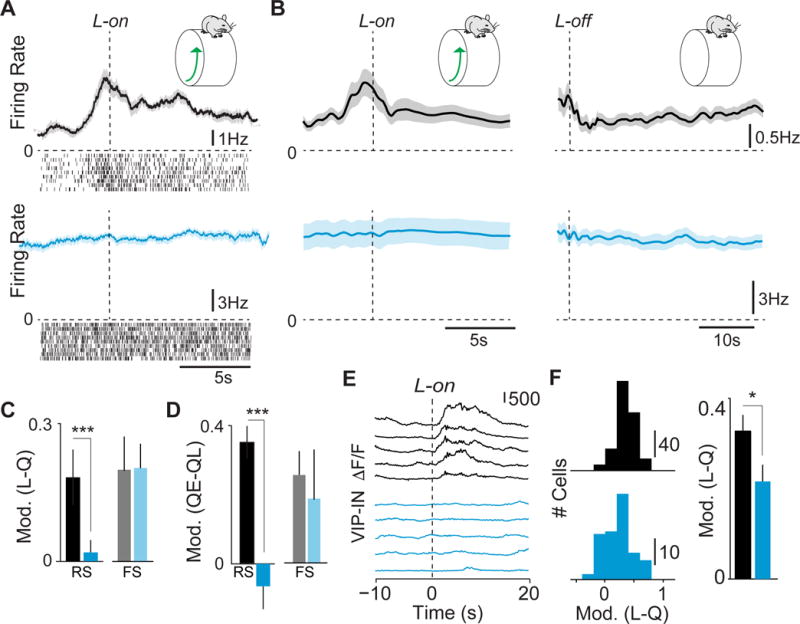
(A) Average firing rate and raster plots for example RS cells around locomotion onset (L-on) in control (black) and mutant (cyan). (B) Population average change in RS firing rate around locomotion on- (left panel) and offset (right panel). (C) Firing rate modulation index (L−Q/L+Q) in early locomotion period (L; −0.5 to 0.5s around L-on) as compared to quiescence period (Q) for RS and FS cells. Controls: 85 cells RS cells, 21 FS cells 8 mice. Mutants: 72 RS cells, 29 FS cells 8 mice. (D) Firing rate modulation index (QE−QL/QE+QL) in late (QL) vs. early (QE) quiescence for RS and FS cells. (E) Ca2+ transients in VIP interneurons at L-on. (F) Left: Histogram of modulation index (L−Q/L+Q) for VIP cells around L-on. Controls: 223 cells, 6 mice. Mutants: 87 cells, 3 mice. Right: Average modulation index for VIP interneurons around L-on. Error bars and shading show s.e.m. p**<0.01, p***<0.001.
Altered interneuron activity in ErbB4F/F,VIPCre mutants
To examine how changes in VIP-IN activity might contribute to a circuit-level loss of state-dependent cortical modulation, we compared VIP interneuron activation patterns in mutants and controls. We expressed the genetic calcium indicator GCaMP6s in VIP-INs and used 2-photon imaging (Figures 3E, S3F–G) to assay their activity during behavioral state transitions. VIP-INs increased their activity around locomotion onset in control mice, but their state-dependent modulation was reduced in mutants (Figures 3E–F, S3–G). The recruitment of VIP-IN activity by excitatory afferents may thus be compromised. Whole-cell recordings from acute brain slices confirmed reduced glutamatergic, but not cholinergic, input to VIP-INs in the mutants (Figure S3A–E). In contrast to the decrease in modulation observed in RS cells and VIP-INs, the state- dependence of FS cell firing was largely unchanged in mutants as compared to controls (Figure 3C–D).
SST-INs, which innervate pyramidal neuron dendrites (Chiu et al., 2013; Munoz et al., 2017), are a major synaptic target of VIP-INs, and this inhibitory-inhibitory interaction has been suggested to play a critical role in the regulation of cortical circuit activity (Fu et al., 2014; Munoz et al., 2017). Using a combined Cre- and Flp-dependent approach, we examined changes in SST-INs following ErbB4 deletion from VIP cells. We found that SST-INs in cortical layer 2/3 of mutants received reduced GABAergic input (Fig S3I–K) and exhibited enhanced state-dependent modulation (Figure S3L–O). Together, these results suggest that developmental deletion of ErbB4 from VIP-INs results in reduced GABAergic synaptic input to SST-INs and disrupted SST-IN function in the local cortical circuit.
Early postnatal disruption of VIP interneurons compromises circuit development and sensory processing
To test the impact of developmental VIP-IN disruption on cortical visual processing, we performed extracellular recordings in V1 of awake behaving animals during visual stimulation. In mutants, visual responses to drifting grating stimuli were reduced in amplitude in RS, but not FS cells (Figures 4A–D, S4A). Neither the observed decrease in state modulation nor the reduced visual responsiveness was correlated with elevated firing rates on a cell-by-cell basis (Figure S4G–H).
Figure 4. ErbB4 mutants exhibit reduced visual response selectivity.
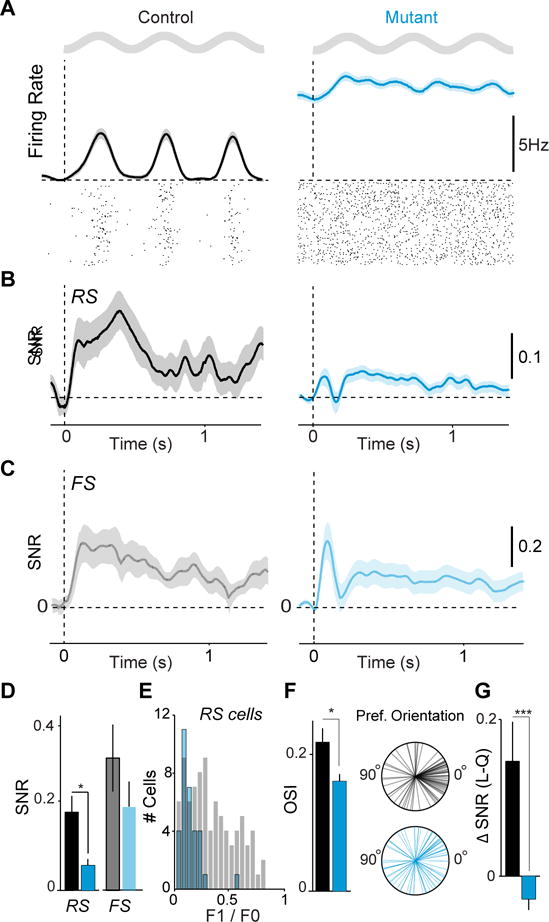
(A) Average firing rate and spike raster plot for example RS cells in response to a drifting grating stimulus in controls (black) and mutants (cyan). Grey sinusoids represent the temporal period of the sinusoidal drifting grating. (B) Average rate modulation relative to inter-trial interval around stimulus onset for RS cells. Controls: 106 RS, 8 mice. Mutants: 92 RS, 7 mice. (C) Average rate modulation relative to inter-trial interval around stimulus onset for FS cells. Controls: 21 cells, 8 animals. Mutants: 28 cells, 7 animals. (D) Signal-to-noise ratio of visual responses for RS and FS cells. (E) Histogram of F1/F0 values for RS cells in control and mutants. (F) Left: Average orientation selectivity index (OSI) of all RS cells. Right: Radial plots of preferred orientations of all RS cells. Controls: 55 cells, 7 mice. Mutants: 61 cells, 8 mice. Panels A–F measured during quiescence. (G) Increase in stimulus rate modulation of RS cells during locomotion as compared to quiescence. Error bars and shading show s.e.m. p*<0.05, p***<0.001.
In addition to changes in overall visual responsiveness, receptive field properties of V1 neurons were altered. RS cells in mutants exhibited less linear summation properties than controls, leading to an overall population shift towards low F1/F0 values associated with complex, rather than simple, cells (Figure 4E, S4F). RS cells in mutants were less orientation selective than those in controls (Figure 4F, S4C). Furthermore, whereas neurons in control mice showed a significant bias towards horizontal (0° angle) stimuli, a feature of cortical visual tuning that is refined after eye opening (Rochefort et al., 2011), this bias was absent in mutant mice (Figures 4F, S4D–E). We found that deletion of ErbB4 from VIP interneurons also eliminated the increase in visual response gain normally observed during periods of locomotion and arousal. We and others have previously shown that the signal-to-noise of visual responses in controls increases in the active state (Niell and Stryker, 2010; Fu et al., 2014; Vinck et al., 2015), but this enhancement was absent in the mutants (Figure 4G).
To more directly examine the consequences of VIP interneuron disruption for cortical circuit development, we compared neural activity in awake behaving mutants and controls at eye opening (P15-18), mid-adolescence (P25-28), and adulthood. At these ages, ErbB4 is expressed by the majority of VIP interneurons in control animals and is efficiently removed in VIP-INs in mutants (Figure 5A). Firing rates showed distinct developmental profiles in mutants and controls, with control firing rates decreasing and mutant firing rates increasing over time (Figure 5B–C). Visual responses were present at P15-18 in both groups, but were reduced in mutants compared to controls by P25-28 (Figure 5D–E, S5). Mutants demonstrated low F1/F0 values for visual responses by P25-28, indicating predominantly complex cells, and overall orientation selectivity was likewise reduced by P25-28 (Figure 5F–G). Mutant animals exhibited a bias towards horizontal stimuli at P25-28 (Figure 5H, S5D–E) that was impaired in adults (Figure 4F). Because visual response properties emerge from the establishment of appropriate thalamocortical and corticocortical synaptic connections, these findings suggest that deletion of ErbB4 from VIP-INs has a deleterious impact on the synaptic development and maintenance of cortical circuits.
Figure 5. Developmental window for effects of VIP-IN disruption.
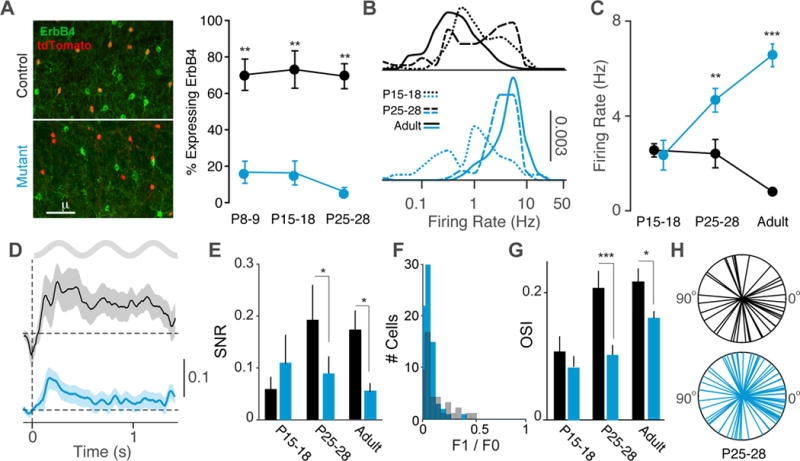
(A) ErbB4 and tdTomato immunohistochemistry in V1 cortex of control (black) and mutant (cyan) mice during postnatal development. Left: Upon Cre recombination of the reporter line Ai9, VIP cells express tdTomato. Right: ErbB4 expression in VIP interneurons quantified as a fraction of cells double-labeled for ErbB4 and tdTomato over the total number of tdTomato labeled cells, in controls (black; n = 4 mice) and mutants (cyan; n = 4 mice). (B) Distribution of firing rates of RS cells across population for three ages (P15-18, P25-28, and Adult) in controls and mutants. (C) Average firing rate of RS cells during quiescence for each age group. Controls: 113 cells, 4 mice (P15-18); 70 cells, 3 mice (P25-P28); 153 cells, 8 mice (adult). Mutants: 89 cells, 7 mice (P15-18); 103 cells, 4 mice (P25-P28); 134 cells, 8 mice (adult). (D) Average rate modulation relative to inter-trial interval around visual stimulus onset for RS cells in P25-28 animals. Controls: 43 cells, 3 mice Mutants: 74 cells, 3 mice. (E) Signal-to-noise ratio of visual responses for RS cells in controls and mutants in each age group. Controls: 23 cells, 3 mice (P15-18); 43 cells, 3 mice (P25-P28); 106 cells, 8 mice (adult). Mutants: 20 cells, 3 mice (P15-18); 74 cells, 3 mice (P25-P28); 92 cells, 7 mice (adult). (F) Histogram of F1/F0 values for RS cells in P25-28 animals. Controls: 43 cells, 3 mice. Mutants: 74 cells, 3 mice. (G) Average orientation selectivity index (OSI) of all RS cells in each age group in controls and mutants. Controls: 5 cells, 2 mice (P15-18); 42 cells, 3 mice (P25-P28); 55 cells, 7 mice (adult). Mutants: 20 cells, 3 mice (P15-18); 69 cells, 3 mice (P25-P28); 61 cells, 8 mice (adult). (H) Radial plots of preferred orientations of all RS cells in the P25-28 age group. Error bars and shading show s.e.m., p*<0.05, p**<0.01, p***<0.001.
To determine whether the observed changes in cortical development and function resulted from cortical VIP-IN disruption alone or were partially due to dysregulation of VIP-expressing cells elsewhere in the brain, we used a Cre-dependent viral approach to replace ErbB4 expression selectively in VIP-INs in V1 cortex (Li et al., 2007). Injection of ErbB4 virus at P5 resulted in robust expression of ErbB4 in the majority of VIP-INs in adult mutants (Figure 6A). Re-expression of ErbB4 in VIP-INs restored the cortical firing rates of RS cells in visual cortex to control levels (Figure 6B–C, S6A–B). Local restoration of ErbB4 in VIP-INs also resulted in normal state-dependent modulation of cortical activity (Figure 6D, S6C). Visual responses were likewise restored to control levels by ErbB4 re-expression, and the recorded neurons demonstrated a broad distribution of F1/F0 values associated with a mixed population of simple and complex cells (Figure 6E–G, S6F). Orientation selectivity and bias towards horizontal stimuli were not significantly different in controls and ErbB4 re-expression animals (Figure 6H, S6D–E). Finally, re-expression of ErbB4 selectively in cortical VIP-INs fully restored the state-dependent modulation of visual response gain to control levels (Figure. 6I). Together, these data indicate that the compromised cortical functions observed in the mutants result from deficits in cortical VIP-INs, and that cortex-specific re-expression of ErbB4 during early postnatal life restores cortical properties to normal levels.
Figure 6. Complete rescue by cortical re-expression of ErbB4 in VIP interneurons.
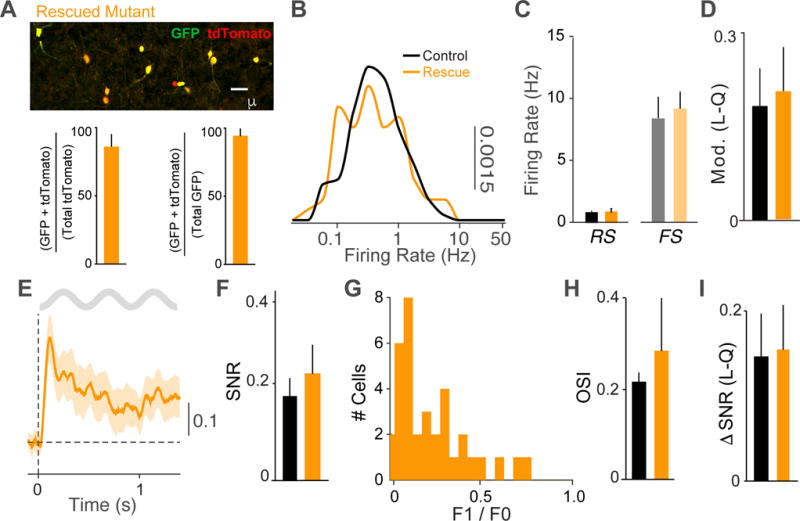
A) GFP and tdTomato immunohistochemistry in V1 cortex of mutant mice injected with AAV5-CAG-FLEX-GFP-T2A-ErbB4rc (Rescued Mutant, orange). Upper: Upon Cre recombination of the reporter line Ai9 and the viral vector, VIP cells express tdTomato and GFP. Lower, left: GFP expression in VIP interneurons quantified as a fraction of cells double labeled cells for GFP and tdTomato over the total number of tdTomato labeled cells. Lower, right: GFP expression in VIP interneurons quantified as a fraction of cells double labeled cells for GFP and tdTomato over the total number of GFP labeled cells in rescue mutants (n = 4 mice). (B) Distribution of RS firing rates across population in mutants with ErbB4 re-expression in cortical VIP-INs (orange) compared to controls (black). Controls: 153 cells, 8 mice (adults). Rescued Mutants: 63 RS cells, 5 mice. (C) Average firing rates for RS and FS cells during quiescence for each group. Controls: 153 RS, 15 FS cells, 8 mice. Rescued Mutants: 63 RS cells, 9 FS cells, 3 mice. (D) Firing rate modulation index (L−Q/L+Q) in early locomotion period (L; −0.5 to 0.5s around L-on) as compared to quiescence (Q) for each group. Controls: 85 RS cells, 5 mice. Rescued Mutants: 63 RS cells, 5 mice. (E) Average rate modulation relative to inter-trial interval around visual stimulus onset for RS cells in re-expression animals. (F) Signal-to-noise ratio of visual responses for RS cells in each group. Controls: 106 cells, 8 mice. Rescued Mutants: 42 cells, 5 mice. (G) Histogram of F1/F0 values for RS cells in re-expression animals. (H) Average orientation selectivity index (OSI) of all RS cells in each group. (I) Increase in stimulus rate modulation of RS cells during locomotion as compared to quiescence. Error bars and shading show s.e.m, There were no significant differences between controls and mutants.
Compromised visual learning following loss of ErbB4 in VIP interneurons
To directly test whether the altered spontaneous and visually evoked cortical activity observed in mutants contributed to perceptual deficits, we trained mice to perform a visual detection task in which stimulus contrast varied (Figure 7A). Mutants and controls had similar detection rates for high-contrast stimuli and similar false alarm rates (Figure 7B–C). The two groups performed equally well during early training sessions and showed equivalent initial psychometric functions (Figure 7D–E, S7D). However, control mice showed improved performance for low-contrast stimuli over several training days but mutant mice did not (Figure 7B,D,E, S7E), suggesting that developmental dysregulation of VIP-INs disrupts both neural activity and sensory perceptual learning.
Figure 7. VIP interneuron disruption causes impaired sensory learning.
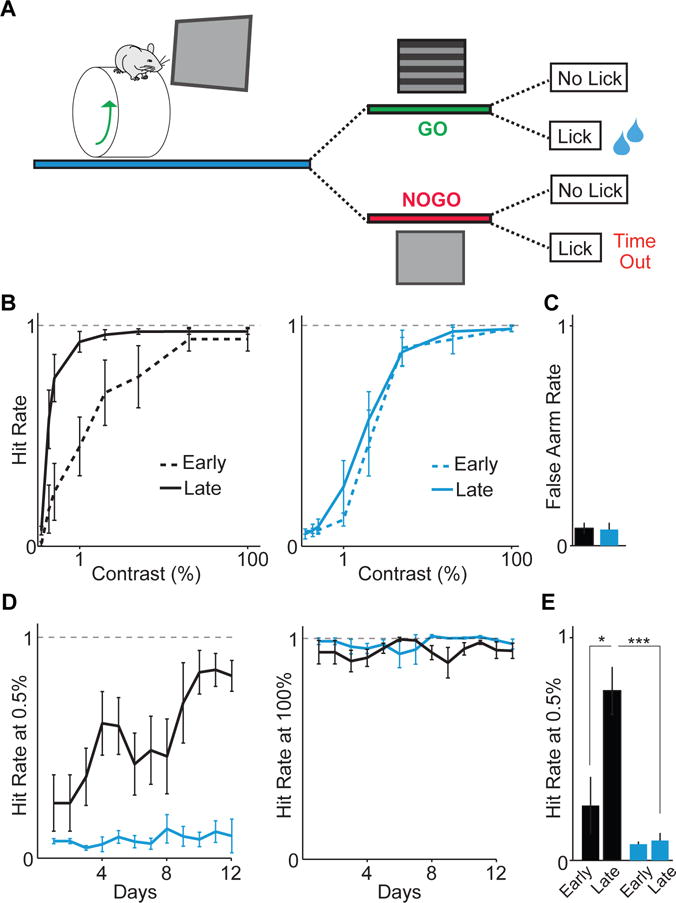
(A) Schematic of visual detection task. On each trial, either a grating appeared (GO) or there was no change (NOGO). Correct hits were rewarded with water, whereas incorrect hits were followed by a time-out. Controls: 4 mice (black). Mutants: 4 mice (cyan). (B) Control and mutant psychophysical performance curves for early (first 2 days) and late (last 2 days) of training sessions. (C) Average false alarm rates. (D) Average performance for low and high contrast stimuli. (E) Average performance at low contrast for early and late training days. Error bars and shading show s.e.m. p*<0.05, p***<0.001.
Discussion
We used deletion of a key developmental gene, ErbB4, to examine the role of VIP-INs in the postnatal maturation of cortical circuits. Although VIP-INs represent only ~12% of cortical GABAergic cells (Rudy et al., 2011), their developmental dysregulation had a surprising, long-term impact on cortical function. ErbB4 deletion from VIP-INs caused increased firing, disrupted temporal spiking patterns, and reduced sensory responses in cortical excitatory neurons. These neural circuit changes emerged by mid-adolescence and were associated with deficits in performance of a visual perception task. The cortical effects of global ErbB4 deletion from VIP-expressing cells were fully recovered by cortex-specific re-expression of ErbB4 in VIP-INs, indicating that the observed effects selectively highlight the consequences of cortical VIP-IN dysfunction. VIP-INs thus play an unanticipated role in cortical circuit development and represent a site of potential vulnerability in neurodevelopmental disorders.
Recent work has suggested a model where VIP-INs regulate cortical circuits predominantly by inhibiting other interneurons, including the dendrite-targeting SST-INs (Pfeffer et al., 2013), thereby disinhibiting pyramidal neurons (though see (Polack et al., 2013) and (Dipoppa, 2016) for a different conclusion). We found that VIP-INs in mutants received decreased glutamatergic, but not cholinergic, synaptic input and were not appropriately activated at locomotion onset, suggesting that their impact on the local neural circuit was diminished. In turn, GABAergic inhibition of SST-INs was decreased, suggesting a reduction in the influence of inhibitory-to-inhibitory connections in the local cortical circuit. Decreased inhibition of SST-INs was associated with an abnormal increase in the activity of these cells at state transitions, consistent with underlying neuromodulatory inputs to these cells (Kawaguchi, 1997; Fanselow et al., 2008). However, the decrease in VIP activation was associated with a sustained increase, rather than a decrease, in the firing of putative pyramidal neurons, raising the possibility that VIP inhibition directly regulates excitatory neuron activity (Garcia-Junco-Clemente et al., 2017). Our findings are thus consistent with a model in which reduced drive to VIP-INs and consequently decreased VIP-IN inhibition of SST-INs and pyramidal neurons contribute to impairments in cortical circuit development and state-dependent regulation of cortical activity. Our results do not preclude a further role, direct or indirect, for VIP-INs in the formation or maintenance of excitatory inputs to pyramidal neurons.
Cortical activity patterns and sensory responses are strongly modulated by behavioral state, such as sleep, wakefulness, and attention. This modulation is thought to be important for enhancing encoding of behaviorally relevant information and is compromised in disease (Lewis and Lieberman, 2000). Previous work has highlighted a role for VIP-INs in the state-dependent modulation of cortical gain control (Fu et al., 2014). ErbB4 deletion from VIP-INs caused a loss of both state transitions in RS cells and the enhanced visual response gain normally associated with arousal and locomotion (Saleem et al., 2013; Erisken et al., 2014; Vinck et al., 2015; Mineault et al., 2016), suggesting that developmental VIP-IN disruption decreases the dynamic range of cortical circuit activity. Developmental impairment of VIP-INs thus interrupts the ability of cortical circuits to adapt rapidly to ongoing cognitive and behavioral demands and to accurately encode information about behaviorally relevant environmental features.
Tightly coupled, fine time-scale interactions between excitation and inhibition are critical for restricting the generation of excitatory action potentials (Pouille and Scanziani, 2001; Wehr and Zador, 2003; Cardin et al., 2010) and for information encoding (Fries, 2009). Synchrony between cells in the cortex may enhance the transmission of information across long-range circuits. In healthy cortical circuits, excitatory neurons are entrained to the gamma rhythm and their activity is tightly coupled to that of fast-spiking inhibitory interneurons (Hasenstaub et al., 2005; Cardin et al., 2009; Vinck et al., 2013; Cardin, 2016). Surprisingly, following deletion of ErbB4 from VIP-INs, RS cells were uncoupled from the gamma rhythm and from FS cell spiking and exhibited a near-complete loss of pairwise synchrony. Developmental dysregulation of VIP-INs thus permanently compromises the ability of cortical circuits to participate in both the encoding and transmission of sensory information.
Previous work has found that global disruption of Nrg-1 or ErbB4 impairs normal synaptic function and plasticity (Kwon et al., 2005; Hahn et al., 2006; Chen et al., 2010; Abe et al., 2011; Geddes et al., 2011; Pitcher et al., 2011; Shamir et al., 2012) and alters the development of excitatory synapses onto PV interneurons and PV synapses onto pyramidal neurons (Li et al., 2007; Fazzari et al., 2010). We likewise found that ErbB4 deletion impairs the development of both excitatory synapses onto VIP-INs and GABAergic synaptic input to SST-INs, consistent with a loss of VIP synapses onto these cells. ErbB4 may thus play a general role in promoting the development of both excitatory synapses to INs and IN synapses to target cells. GABAergic inhibition plays a key role in the early postnatal development of appropriate synaptic receptive field structure (Hensch, 2005) and in the induction of plasticity in mature circuits (van Versendaal and Levelt, 2016), including via VIP-INs (Fu et al., 2015). VIP-specific ErbB4 deletion decreased visual responsiveness and severely altered the response properties of putative excitatory neurons beginning around P25-28, suggesting that developmental dysregulation of VIP-INs disrupts the synaptic establishment or maintenance of receptive field properties in visual cortex neurons during adolescence.
The disruption of network activity and sensory processing we observed following ErbB4 deletion was associated with compromised visual task performance and a consistently elevated threshold for visual contrast detection. It is unlikely that the deficits observed in the mutants resulted from failure to see stimuli or perform a motor response, as the two groups demonstrated similar baseline psychophysical performance. In comparison, deletion of ErbB4 from SST-expressing GABAergic neurons in the thalamic reticular nucleus impairs attentional switching but not learning or performance of a basic sensory detection task (Ahrens et al., 2015).
Nrg-1 and ErbB4 have been linked to schizophrenia through both genetic association (Nicodemus et al., 2006; Silberberg et al., 2006; Lu et al., 2010; Rico and Marin, 2011; Mei and Nave, 2014) and GWAS studies (Shi et al., 2009; Agim et al., 2013; Pardiñas, 2016), and mice globally lacking Nrg-1 or ErbB4 exhibit key behavioral deficits associated with this neurodevelopmental disease (Karl et al., 2007; Rico and Marin, 2011; Shamir et al., 2012). Dysregulation of GABAergic inhibition in the brain is a candidate mechanism underlying schizophrenia and other neurodevelopmental disorders (Uhlhaas and Singer, 2010; Hamm and Yuste, 2016; Hamm et al., 2017). Schizophrenic patients exhibit altered gamma oscillations (Karouni et al., 2010; Lee et al., 2010; Uhlhaas and Singer, 2010), and deficits in basic sensory processing and perception (Slaghuis, 2004; Martinez et al., 2008; Tan et al., 2013; Serrano-Pedraza et al., 2014). Initial symptoms are exhibited during adolescence and young adulthood, the time when GABAergic circuits are maturing (Fishell and Rudy, 2010). Cortical tissue from schizophrenic patients shows decreased expression of markers for multiple distinct populations of interneurons, including those that co-express PV, SST, and VIP (Hashimoto et al., 2008; Fung et al., 2010; Volk et al., 2012; Fung et al., 2014; Joshi et al., 2014), suggesting the pathophysiological involvement of multiple inhibitory cell types, including VIP interneurons (Hikida et al., 2007; Fazzari et al., 2010; Wen et al., 2010). We found that developmental impairment of VIP-INs led to deficits in cortical activity and sensory functions and other behavioral changes characteristic of models of neurodevelopmental disorders (Leung and Jia, 2016). Together with previous findings, these results suggest that behavioral and perceptual deficits following global disruption of key genes for GABAergic development, such as Nrg-1 and ErbB4, may arise from the summed impact of multiple disrupted GABAergic populations.
In summary, we find that VIP interneurons are critical for the postnatal maturation of cortical circuits. The severe disruption of cortical function following selective dysregulation of VIP interneurons suggests an unanticipated role for these cells in both cortical development and refinement during learning. Despite being few in number, VIP interneurons are targets for multiple neuromodulatory systems and potent regulators of cortical activity. VIP interneuron disruption may thus be a powerful mechanism underlying the large-scale dysregulations of cortical activity patterns, behavioral and sensory modulation, and perceptual function that are hallmarks of psychiatric disease.
STAR Methods
Contact for Reagent and Resource Sharing
Further information and requests for reagents may be directed to and will be fulfilled by the Lead Contact, Dr. Jessica A. Cardin (jess.cardin@yale.edu).
Experimental Model and Subject Details
All animal handling and maintenance was performed according to the regulations of the Institutional Animal Care and Use Committee of the Yale University School of Medicine. ErbB4F/F mice were crossed to ErbB4F/+ VIPCre to generate mutant animals (ErbB4F/F VIPCre) and littermate controls (ErbB4F/F, or VIPCre). Ai9 mice were crossed to Dlx6aCre, PVCre, or SSTCre, or VIPCre mice to generate Dlx6aCre Ai9, PVCre Ai9, or SSTCre Ai9, or VIPCre Ai9 reporter animals. RCE:FRT mice were crossed to SSTFlp to generate SSTFlp RCE mice. We used both female and male animals ranging from the ages P8 to PP150, as specified in the experiments.
Method Details
Immunohistochemistry
Control mice Dlx6aCre Ai9, PVCre Ai9, SSTCre Ai9, or VIPCre Ai9, and mutant ErbB4F/F VIPCre Ai9 animals were examined using immunohistochemistry. Brains were fixed by transcardial perfusion with 4% paraformaldehyde (PFA)/phosphate buffered saline (PBS) solution followed by a 1 hour post- fixation on ice with 4% PFA/PBS solution. Brains were rinsed with PBS and cryoprotected by using 15% sucrose/PBS solution for 6 hours and 30% sucrose/PBS solution overnight at 4°C. Tissues were embedded in Tissue Tek, frozen on dry ice, and cryosectioned at 20 μm thickness. Sections for immunohistochemistry analysis were processed using 1.5% normal goat serum (NGS) and 0.1% Triton X-100 in all procedures except washing steps, where only PBS was used. Sections were blocked for 1 hour, followed by incubation with the primary antibodies overnight at 4°C. Cryostat tissue sections were stained with the primary antibodies rabbit anti-ErbB4 (1:2000; mAB10 and p5721 courtesy of A. Buonanno), rat anti-SST (1:250, Chemicon), mouse anti-PV (1:1000, Sigma), and rabbit anti-VIP (1:250, ImmunoStar). Secondary antibody conjugated with Alexa fluorescent dyes 488 raised from goat was applied for 1 hr at room temperature for visualizing the signals. Nuclear counterstaining was performed with DAPI solution.
All analysis was evaluated in the primary visual cortex (V1). To minimize counting bias we compared sections of equivalent bregma positions, defined according to the Mouse Brain atlas (Paxinos and Franklin, 2001). The total number of cells expressing tdTomato (from the Ai9 reporter mouse line) were counted for a defined optical area. The percentages of cortical interneurons expressing ERBB4 or subtype specific markers (DLX6, PV, SST, VIP) among fate-mapped cells were calculated as a ratio between the number of double positive cells (Marker and tdTomato) over the total number of tdTomato positive cells. All data were represented as mean ± SEM, unpaired Student’s t-test.
ErbB4 rescue experiment
To re-express ErbB4 in VIP cells in the primary visual cortex of mutant mice, ErbB4F/F VIPCre Ai9, P5 pups were placed on ice for five minutes and a small craniotomy was made over primary visual cortex. Each mouse received three 300 nl injections of adenoassociated virus (AAV5-CAG-FLEX-GFP-T2A-ErbB4rc) (Li et al., 2007). Injections were made via beveled glass micropipette at a rate of ~10 nl/min. After injection, pipettes were left in the brain for ~5 minutes to prevent backflow. Mice had variable ErbB4 expression. However, ErbB4 expression was always restricted to the primary visual cortex. In some animals the transfection extended to the entirety of the visual cortex, while in other animals the rescue was only partial. To minimize the effect of the variability in virus expression in our analysis we perfused and stained all the animals from which we recorded. We tracked the location of the recording sites in order to determine electrode position relative to ErbB4 viral expression. In our analysis, we only included animals in which the recording electrodes were surrounded by VIP cells expressing ErbB4. Recordings in which the electrodes missed the injection site were discarded. In control experiments, we used both non-injected mutant mice and mice injected at P5 with a sham virus that does not express ErbB4. There was no significant difference between non-injected (n=5) and sham-injected animals (n=3) and we therefore used both as controls. Histological quantification of ErbB4 expression was restricted to the area of successful viral infection.
Headpost surgery and wheel training
Mice were handled for 5–10 min/day for 5 days prior to the headpost surgery. On the day of the surgery, the mouse was anesthetized with isoflurane and the scalp was shaved and cleaned three times with Betadine solution. An incision was made at the midline and the scalp resected to each side to leave an open area of skull. Two skull screws (McMaster-Carr) were placed at the anterior and posterior poles. Two nuts (McMaster-Carr) were glued in place over the bregma point with cyanoacrylate and secured with C&B-Metabond (Butler Schein). The Metabond was extended along the sides and back of the skull to cover each screw, leaving a bilateral window of skull uncovered over primary visual cortex. The exposed skull was covered by a layer of cyanoacrylate. The skin was then glued to the edge of the Metabond with cyanoacrylate. Analgesics were given immediately after the surgery and on the two following days to aid recovery. Mice were given a course of antibiotics (Sulfatrim, Butler Schein) to prevent infection and were allowed to recover for 3–5 days following implant surgery before beginning wheel training.
Once recovered from the surgery, mice were trained with a headpost on the wheel apparatus. The mouse wheel apparatus was 3D-printed (Shapeways Inc.) in plastic with a 15 cm diameter and integrated axle and was spring-mounted on a fixed base. A programmable magnetic angle sensor (Digikey) was attached for continuous monitoring of wheel motion. Headposts were custom-designed to mimic the natural head angle of the running mouse, and mice were mounted with the center of the body at the apex of the wheel. On each training day, a headpost was attached to the implanted nuts with two screws (McMaster-Carr). The headpost was then secured with thumb screws at two points on the wheel. Mice were headposted in place for increasing intervals on each successive day. If signs of anxiety or distress were noted, the mouse was removed from the headpost and the training interval was not lengthened on the next day. Mice were trained on the wheel for up to 7 days or until they exhibited robust bouts of running activity during each session. Mice that continued to exhibit signs of distress were not used for awake electrophysiology sessions.
In vivo electrophysiology
All extracellular single-unit, multi-unit, and LFP recordings were made with an array of independently moveable tetrodes mounted in an Eckhorn Microdrive (Thomas Recording). Signals were digitized and recorded by a Digital Lynx system (Neuralynx). All data were sampled at 40kHz. All LFP recordings were referenced to the surface of the cortex. LFP data were recorded with open filters and single unit data was filtered from 600–9000Hz. Awake recordings were made from mice that had received handling and wheel training as described above. On the initial recording day, a small craniotomy was made over V1 under light isoflurane anesthesia. The craniotomy was then covered with Kwik-Cast (World Precision Instruments), after which the mouse was allowed to recover for 2 hours. Mice were then fitted with a headpost and secured in place on the wheel apparatus before electrodes were lowered. Recording electrodes were initially lowered to ~150 μm, then independently adjusted after a recovery period of 30–60 min. At the end of a recording session, the craniotomy was flushed with saline and capped. On subsequent recording days, the craniotomy was flushed with saline before placing the electrode array in a new site. Recordings were performed mainly in the second half of the light portion of the light/dark cycle.
In vitro electrophysiology
Under isoflurane anesthesia, mice were decapitated and transcardially perfused with ice-cold choline-artificial cerebrospinal fluid (choline-ACSF) containing (in mM): 110 choline, 25 NaHCO3, 1.25 NaH2PO4, 2.5 KCl, 7 MgCl2, 0.5 CaCl2, 20 glucose, 11.6 sodium ascorbate, 3.1 sodium pyruvate. Acute occipital slices (300 μm) were prepared from the left hemisphere and transferred to ACSF solution containing (in mM): 127 NaCl, 25 NaHCO3, 1.25 NaH2PO4, 2.5 KCl, 1 MgCl2, 2 CaCl2, and 20 glucose bubbled with 95% O2 and 5% CO2. After an incubation period of 30 min at 32°C, the slices were maintained at room temperature until use.
Visualized whole-cell recordings were performed by targeting fluorescently labeled VIP-INs in the monocular region of the primary visual cortex (V1). All recordings were performed at room temperature. Criteria for recording included a series resistance (Rs) of <20 MΩ. For miniature excitatory postsynaptic current recordings, the ACSF contained 1 μM TTX to block sodium channels. The internal solution contained (in mM): 126 cesium gluconate, 10 HEPES, 10 sodium phosphocreatine, 4 MgCl2, 4 Na2ATP, 0.4 Na2GTP, 1 EGTA (pH 7.3 with CsOH). Cells were voltage-clamped at −70 mV. For miniature postsynaptic current recordings, the ACSF contained 1 uM TTX to block sodium channels. For mEPSCs, the internal solution contained (in mM): 126 cesium gluconate, 10 HEPES, 10 sodium phosphocreatine, 4 MgCl2, 4 Na2ATP, 0.4 Na2GTP, 1 EGTA (pH 7.3 with CsOH). For mIPSCs, the internal solution contained (in mM): 100 cesium chloride, 30 cesium gluconate, 10 HEPES, 10 sodium phosphocreatine, 4 MgCl2, 4 Na2ATP, 0.4 Na2GTP, 1 EGTA (pH 7.3 with CsOH).
For local application of ACh, a glass pipette connected to a picospritzer was placed near the cell body of an identified VIP-IN. To activate cholinergic receptors on VIP-INs, ACh (1 mM) was loaded into a glass micropipette (2–4 MOhm), and the pipette tip placed 40–50 microns from the cell body. ACh was pressure ejected via a computer-driven picospritzer (Puff duration 30 ms) during recordings.
In vivo imaging
To express the genetically encoded calcium indicator GCaMP6, mice were anesthetized with 1–2% isoflurane mixed with pure oxygen and a small craniotomy was made over primary visual cortex. Each mouse received three 100 nl injections of adenoassociated virus (AAV5-Synapsin-FLEX-GCaMP6s, University of Pennsylvania Vector Core or, Deisseroth Lab, Stanford University) at coordinates (in mm from Bregma): AP −3.5, ML 1.5, DV 0.4; AP −3, ML 2, DV 0.4; AP −2.5, ML 2.5, DV 0.4. Injections were made via beveled glass micropipette at a rate of ~10 nl/min. After injection, pipettes were left in the brain for ~5 minutes to prevent backflow. Imaging experiments were conducted 25–30 days after virus injection. For implantation of the imaging window, mice were anesthetized using a mixture of ketamine (80 mg/kg) and xylazine (5 mg/kg), and a ~2 mm diameter craniotomy was opened over V1. An imaging window consisting of a small rectangular glass piece attached to a 5mm circular cover glass using an ultraviolet-curing adhesive (Norland Products) was inserted into the craniotomy and secured to the skull with Metabond. A custom titanium head post was secured to the skull with Metabond.
Imaging was performed using a resonant scanner-based two-photon microscope (MOM, Sutter Instruments) coupled to a Ti:Sapphire laser (MaiTai DeepSee, Spectra Physics) tuned to 940 nm for GCaMP6. Emitted light was collected using a 25× 1.05 NA objective (Olympus). Mice were placed on the wheel and head-fixed under the microscope objective. To prevent light contamination from the display monitor, the microscope was enclosed in blackout material that extended to the headpost. Images were acquired using ScanImage 4.2 at ~30 Hz, 256×256 pixels (290×290 um). Imaging of layer 2/3 was performed at ~150–300 um depth relative to the brain surface. Images were continuously monitored throughout the experiments, and slow drifts of the image were manually corrected. For each mouse, 1–4 fields of view were imaged. All data were acquired in front of a mean-luminance gray screen.
Visual stimulation
Visual stimuli were presented on an LCD monitor at a spatial resolution of 1680×1050, a real-time frame rate of 60Hz, and a mean luminance of 45 cd/m2 positioned 15cm from the eye. The LCD monitor used for visual stimulation (22 inches) was mounted on an arm and positioned on the right side of the animal, perpendicular to the surface of the right eye. The screen was placed so that stimuli were only presented to the right eye. Stimuli were generated by custom-written software (J. Cardin, Matlab). Initial hand-mapping was performed to localize the receptive fields of identified cells in the electrophysiological experiments; an automated mapping was using during imaging to identify the largest overall change in fluorescence for a given field. To maximize data collection, visual stimuli were positioned to cover as many identified receptive fields as possible. All stimuli were sinusoidal drifting gratings at a temporal frequency of 2 Hz, presented at a fixed duration of 1.5 s (2 s) with an interstimulus interval of 2 s (5 s) for electrophysiological (imaging) experiments. For the electrophysiological recordings, we used blocks of visual stimuli where contrast was held at 100% and orientation was varied. To determine orientation tuning, gratings were presented at 12 different orientations, randomized and presented 20–50 times per orientation. Orientation tuned stimuli were optimized for mean spatial frequency. For in vivo imaging, we used blocks of visual stimuli where drifting gratings were either oriented at 0 or 90 degrees, and contrasts varied from 0 to 100% with steps of 10%. The stimuli were randomized and presented 20–40 times per contrast.
Visual detection task
Mice were trained to perform a GO-NOGO visual contrast detection task while head-fixed on a wheel. The screen was placed ~15cm from the mouse. During initial shaping stages, mice were trained to lick a water spout in response to presentation of a high-contrast, full-screen stimulus. A tone cue was given to signal the onset of each trial. When a performance criterion of >80% hit rates and <20% false alarm rates was reached, they were moved to the full version of the task where the stimulus contrast varied randomly across trials. Stimulus contrast was selected on each trial from the series: 0, 0.35, 0.425, 0.5, 1, 2, 5, 20, 100%. A correct response (hit) was rewarded with a small (~2μl) drop of water. False alarms were punished with a bright screen, a high-frequency tone, and an extended inter-trial interval between 15 and 17s. Correct and incorrect rejections (miss) were neither rewarded nor punished but were followed by an inter-trial-interval between 5 and 7s. Mice were put on the task for a total of 45 minutes per session.
Quantification and Statistical Analysis
In vitro electrophysiology analysis
Standard software for miniature event detection (MiniAnalysis, Synaptosoft) was used to detect and measure miniature events based on a template-matching method (Clements and Bekkers, 1997). Data were compared using Student’s t-tests.
In vivo electrophysiology analysis
Spikes were clustered semi-automatically using the following procedure. We first used the KlustaKwik 2.0 software to identify a maximum of 30 clusters using the waveform Energy and Energy of the waveform’s first derivative as clustering features. We then used a modified version of the M-Clust environment to manually separate units and we selected well-isolated units. We further ensured that maximum contamination of the ISI (Inter-spike-interval) histogram <1.5 ms was smaller than 0.1%. In a small number of cases we accepted clusters with isolation distances smaller than 20, which could be caused by e.g. non-Gaussian clusters, only if separation was of sufficient quality as judged by comparing the cluster with all other noise clusters (20%, 80% quantiles of ID = 19, 43; median±standard error of median = 25±0.5). Unit data were analyzed for firing rates and patterns, correlations, and visual responses using custom-written Matlab software.
Quantification of firing rate
The firing rate was computed by dividing the total number of spikes a cell fired in a given period by the total duration of that period (Fig. 1E, F).
Quantification of inter-spike-interval maximum
For each cell, we computed the inter-spike-interval (ISI) histogram at 1ms resolution. We then determined the time at which this histogram had a peak. To obtain an average ISI histogram, we first normalized the ISI histogram of each cell individually by dividing by the maximum value in the ISI histogram (Fig. 1G).
Quantification of burstiness
We quantified the propensity to engage in burst firing using the coefficient of Local Variation (LV) (Shinomoto et al., 2009). The LV is a modification of the coefficient of variation (CV) measure and, like the CV, it quantifies spiking irregularity. A Poisson-process has an LV of 1. Rhythmic firing leads to LV values <1, whereas burst firing leads to LV values above 1. The LV quantifies irregularity only on the basis of pairs of subsequent ISIs, and, unlike the CV, is therefore robust against non-stationarities in firing rate and the mean firing rate (Shinomoto et al., 2009).
Computation of wheel position and change points
Wheel position was extracted from the output of a linear angle detector. Since wheel position is a circular variable, we first transformed the sensor data to the [−π,π] interval. Because the position data would make sudden jumps around values of π and – π, we further performed circular unwrapping of the position phases to create a linear variable (Fig. 2A).
We then used a change-point detection algorithm that detected statistical differences in the distribution of locomotion velocities across time. The motivation of this method relative to the standard method of using an arbitrary threshold (e.g., 1 cm/s) (Niell and Stryker, 2010) is that our technique allowed for small perturbations in locomotion speed to be identified that might otherwise fail to reach the locomotion threshold. Further, it ensured that the onset of locomotion could be detected before the speed reached 1 cm/s. If the distributions of data points 100 ms before and 100 ms after a certain time point t were significantly different from each other, using a standard T-test at p<0.05 and sampling at 2 kHz, then the data point was deemed a candidate change point. A point t was considered a candidate locomotion onset point if the speed 100 ms after t was significantly higher than 100 ms before t. A point was considered a candidate locomotion offset point if the speed 100 ms after t was significantly lower than 100 ms before t. A point was accepted as a locomotion onset point if the previous transition point was a locomotion offset point. A point was considered to be a locomotion offset if it was preceded by a locomotion onset point, and if the speed 100 ms after t did not significantly differ from zero. This prevented a decrease in speed to be identified as a locomotion offset point. We further required that a locomotion offset point not be followed by a locomotion onset point for at least 2 s, because mice sometimes showed brief interruptions between bouts of running.
We selected locomotion trials for which the average speed until the next locomotion offset point exceeded 1 cm/s and which lasted longer than 2 s. Quiescence trials were selected that lasted longer than 5 s, had an average speed <1 cm/s, and for which the maximum range of movement was <3 cm across the complete quiescence trial.
Computation of LFP power
To compute LFP power spectra, we divided the data in 500 ms periods and multiplied each data segment by a Hann taper. We then computed the average LFP power spectrum by computing the FFT per segment and averaging over the segment’s power spectra.
Spike-field locking analysis
Spike-field locking was computed using the Pairwise Phase Consistency (Vinck et al., 2012), a measure of phase consistency that is not biased by the firing rate or the number of spikes. The PPC is computed as follows:
For each spike, a spike-LFP phase is computed at each frequency (see below).
For each pair of spikes (fired by one cell) that fell in a different trial, we then compute the inner product of the two spike-LFP phases (the inner product being a measure of their similarity). Spike-LFP phases were computed for each spike and frequency separately by using Discrete Fourier Transform with Hanning taper of an LFP segment of length 9/f, where f is the frequency of interest. For a given time period (quiescence or locomotion), we only selected cells that fired at least 50 spikes in that period.
The PPC then equals the average of the inner products across all pairs of spike-LFP phases that fell in different trials. Note that exclusively taking pairs of spike-LFP phases from different trials ensures that history effects like bursting do not artificially inflate the measure of phase locking. The expected value of the PPC ranges between 0 and 1, although estimates lower than zero can occur.
For each cell, we computed the preferred phase of firing in the 40–60 Hz range by first computing the circular mean across all spike-LFP phases, and then computing the circular mean across frequencies (Fig. 2D, left).
We then computed the phase consistency (Fig. 2D, right) of preferred spike-LFP phases across units by computing the PPC over the preferred spike-LFP phases. Finally, we computed an estimate of the standard error of the mean using the jack-knife (Fig. 2D, right).
Computation of STAs
To compute the average STA in the delta/theta [1,6] Hz and the gamma [40–60] Hz band, we first filtered the LFP data of 2s traces around each spike. We then normalized the energy of the LFP trace by either dividing by the mean absolute value of the LFP signal. We then averaged these traces across spikes.
Computation of pair correlations
Unit-unit correlations (Fig. 2E) were computed using the cross-correlogram at 1ms resolution. The cross-correlogram contains, for each cell pair, the number of spike coincidences at a certain delay (e.g. the number of times one neuron fired a spike 5–6 ms after another neuron). We normalized the cross-correlogram by computing the percent-wise increase compared to the expected fraction of coincidences given the firing rates of the two cells.
Computation of modulation by state
To examine whether RS and FS cell firing rates were significantly changed around locomotion onset, we computed the firing rate in the [−0.5, 0.5] s window around locomotion onset (L-on; as in (Vinck et al., 2015) and compared this to the firing rate in the [−5, −2] s quiescence period before locomotion onset by computing log(FRL-on/FRQ).
Using the same modulation index, we also compared the firing rate in the early [2,5] s quiescence period after locomotion offset – when the animal was still aroused but not yet moving (Vinck et al., 2015) – to the late [>40] s quiescence period after locomotion onset, when the animal had low arousal levels and is not moving (Vinck et al., 2015).
Computation of calcium fluorescence
Analysis of imaging data was performed using ImageJ and custom routines in MATLAB (The Mathworks). Motion artifacts and drifts in the Ca2+ signal were corrected with the moco plug-in in ImageJ (Dubbs et al., 2016), and regions of interest (ROIs) were selected as previously described (Chen et al., 2013). All pixels in a given ROI were averaged as a measure of fluorescence, and the neuropil signal was subtracted.
Quantification of calcium signals
Frame times from the resonant scanner were used to align the Ca2+ signals with the wheel traces. Ca2+ signals were expressed as ΔF/F(t). Briefly, a time-dependent baseline, F0(t), was taken as the average of the minimum 10% of overall fluorescence, F(t), during the recording period. The relative change in fluorescence was calculated as ΔF/F(t)=(F(t)−F0(t))/F0(t). For this analysis, we selected locomotion trials which lasted 5s or longer, and quiescent trials which lasted 15s or longer. To determine whether Ca2+ activity was altered during behavioral state transitions, ΔF/F(t) from [0,4]s after locomotion onset (CaL-on) was compared with ΔF/F(t) from [10,15]s after locomotion offset (CaQ) by computing (CaL-on−CaQ)/(CaL-on+CaQ).
Quantification of rate modulation to visual stimulus
For this analysis we computed the firing rate in the 30–500 ms period after stimulus onset, and the firing rate in the 1000 ms before stimulus onset. We then computed the firing rate modulation of stimulus-driven versus baseline rate as log(FRstim/FRbase). We call this modulation the SNR. We also computed the SNR at each time point by computing log(FRstim(t)/FRbase) where FRstim(t) is the estimated firing rate at time t, which was estimated by convolving the spike trains with Gaussian smoothing windows (50ms, sigma=12.5ms), We further compared this modulation between the entire locomotion period and the entire quiescence period, computing the ΔSNR as log(FRstim, L/FRbase, L) − log(FRstim, Q/FRbase, Q).
Computation of visual modulation (F1/F0)
To determine the extent to which cells showed linear responses to a drifting grating, we performed the following analysis. We first computed the average spike density of the firing by convolving the spike trains with Gaussian smoothing windows (50ms, sigma=12.5ms), and averaging these over trials. We then computed a Fourier Transform of the average spike density in the 0.25–1.25 s window, thereby excluding the initial firing transient. (Note that including this transient would likely lead to artificially increased F1/F0 values). The F1 component was extracted as 2 times the amplitude of the Fourier component at 2 Hz (the temporal frequency of the drifting grating), and the F0 component was taken as the 0 Hz, DC component of the FFT. We then computed an index of linearity as L=F1/F0.
Quantification of visual response amplitude
For this analysis, we averaged the change in calcium fluorescence (ΔF/F(t)) in response to the three smallest contrasts (0–20%, Clow), and in response to the three largest contrasts (90–100%, Chigh). We computed the contrast modulation as (Chigh − Clow)/(Chigh + Clow), and call this modulation the SNR. We determined the SNR during periods of quiescence and locomotion separately.
Quantification of orientation selectivity
The orientation selectivity index is defined as R = [1-Circular Variance]. This is derived by letting each orientation (measured in radians, with 0 and 90 degree orientations corresponding to 0 and PI radians) be a vector on the circle with weight . Note that we performed this procedure for the directions lying between 0 and 180 degrees and 180 and 360 degrees separately, and averaged all derived measures over the two set of directions. We then computed the resultant vector by summing the sine and cosine components.
We next computed the resultant vector length (OSI) as R = |V|. Note that 0<=R<=1, and that R=1 indicates that a cell only has a non-zero firing rate for one orientation, whereas R=0 indicates that the cell has the same firing rates for all orientations. These vectors can also be normalized to unity length by V/|V|. These vectors are shown as a unit, and in histogram form. We also computed the phase consistency over the preferred orientations.
The OSI is a biased quantity in that it tends to be over-estimated for a finite number of trials (Womelsdorf et al., 2012). This can be intuitively seen: Suppose that R=0, meaning that the true firing rate for each orientation is identical. With a small number of trials, the firing rate estimates will deviate from those true estimates, which causes R>0. This bias is typically also stronger if the firing rate is lower (Womelsdorf et al., 2012). The reason for that is that the ratio mean/s.e.m. (where s.e.m. is the standard error of the mean) tends to be higher when the firing rate is high, assuming a Poisson process. That is, proportionally speaking, the deviation in the estimated firing rate from the true firing rate tends to be larger when the true firing rate is low.
To correct for these intrinsic biases, we performed the following estimation procedures. 1) For each cell, we randomly selected 50 spikes across all spikes and then compute the OSI. We repeated this procedure by bootstrapping a random sample of 50 spikes (without replacement) for 10000 times and computing the average OSI across these bootstraps. These estimates are shown in Fig. 4F. 2) For each cell, we randomly shuffled the trials across orientations. This was done such that if the first orientation originally contained 10 trials, the surrogate/random set of trials for the first orientation would also contain 10 trials. We then computed the OSI for the shuffled condition, and repeated this procedure 5000 times. In order to correct for the bias, we then subtracted the average shuffled OSI from the true OSI. These values are shown in Fig. S4C. Values greater than zero indicate that there was more orientation than by chance.
Computation of correlations between FR and SNR
To compute the correlation between FR and the rate modulation by visual stimulus, we computed the average firing rate over baseline and stimulus periods as FRavg = (FRstim + FRbase)/2. We then binned FRavg by constructing bins that were B = [bincenter−0.2*bincenter, bincenter+0.2*bincenter] wide. For each bin, we then computed the average rate modulation by the visual stimulus.
We performed the same procedure for the modulation by state. In this case FRavg was computed as FRavg = (FRQ + FRL-ON)/2.
Computation of visual performance false alarm rate
The False Alarm Rate was defined as the average number of incorrect hits, i.e. licking responses when the GO stimulus was not displayed (i.e. the NOGO condition).
Computation of visual psychophysical performance curves
For each session, we corrected the total number of true hits by the false alarm rate as follows. Assuming that each time when the mouse sees the stimulus, the mouse responds to the stimulus, observed HITRATE equals HITRATEobserved = HITRATEtrue + (1− HITRATEtrue)*FAR.
Thus, it follows that
If HITRATEobserved < FAR, then we let HITRATEtrue = 0. If the observed hit rate is 100%, then the true hit rate is also 100%. If the observed hit rate equals the FAR or is smaller than the FAR, then the estimated true hitrate equals zero.
We cleaned up the data per session automatically as follows. First, we ensured that when the mice stopped performing at the end of a session, this data was not incorporated into the average. This was done by computing a 10-point running moving average of the data. For the k-th trial, we then computed the average performance of the mouse (as HITRATEobserved) until the (k-1)-th trial. This average performance was computed starting from the trial where the mouse had obtained at least 10 rewards, to prevent poor performance at the start from influencing the average. (Note that the first ten trials in a given session were always 100% contrast trials). The same procedure was performed on the FAR. The last trial was defined as the trial at which the 10-point moving average of the hit rate or the false alarm rate fell below 75% of the mean performance up to that point and did not recover above this level anymore.
We then computed, for each contrast, the average hit rate for each contrast and the FAR, and estimated the true hit rate as detailed above. We fit sigmoid curves to the contrast vs. hit-rate data. We constructed learning curves by computing the 2-day moving averages of the psychophysics curve for each mouse. We then took the value of the 2-day moving average at a given contrast and computed the mean and s.e.m. across mice. These values are shown in Fig. 7D. We also computed the average psychophysics curve for the first two sessions, and for all the sessions starting from day 12, when the performance of the controls reached a saturation point. These curves are shown, at the measured contrasts, in Fig. 7B. We performed a standard T-test to test for differences between animals, and to test for differences between early and late trials.
Statistical testing
A common problem in many experimental studies is the use of nested design, where multiple cells are measured for each animal and cannot be taken as independent measurements (Galbraith et al., 2010). Thus, directly performing statistical comparisons between a sample of control and mutant cells, as is typical in the neurosciences, leads to a highly increased false alarm rate and suboptimal estimates of the mean (Aarts et al., 2014).
To avoid the increased false positive rate inherent in nested designs, we used semi-weighted error estimators, commonly used in random-effects meta-analysis (Chung et al., 2013; DerSimonian and Laird, 1986). Let yi be the mean for one parameter (e.g., OSI) for the i-th animal, where xj is the parameter value for the j-th cell and there are M cells per animal, defined as:
| (3) |
The unweighted estimator of the mean is defined as the mean over yi, using the number of animals per condition as degrees of freedom. This analysis is suboptimal, as some animals have many cells and yield more reliable estimates, whereas other animals have few cells and yield more unreliable estimates. Alternatively, a weighted estimator can be defined by pooling observations across N animals and using the number of cells per condition as degrees of freedom. Although this estimator is commonly used in the neurosciences, statistical inference based on pooling cells together does not properly control the false alarm rate (Aarts et al., 2014)
The semi-weighted estimator, for a given experimental condition (e.g., CT cells) is defined as:
| (4) |
where weight for the i-th animal is defined as:
| (5) |
Here, is the within-animal variance across cells and τ2 is the estimated variance across all animals of a given condition using the maximum likelihood method (Chung et al., 2013):
| (6) |
We solved equations 5 and 6 iteratively and checked for convergence of τ2 to <0.001. Intuitively, if there is no across-animal variance, then the contribution of each cell is weighted by the number of animals (the weighted estimator). If the across animal variance is very large (i.e., observations within an animal are maximally dependent), then each animal is given the same weight. Previously, we used this semi-weighted estimator to calculate the statistical significance of the difference between cell populations using a standard Student’s t-test (Lur et al., 2016).
For this paper, we improved on this previous statistical procedure by developing a nonparametric statistical inference procedure to test for statistical differences between animals. Using a nonparametric statistical permutation test avoids any assumptions inherent to parametric statistics. However, directly permuting animals between controls and knockouts would lead to a test with low statistical sensitivity because it can yield permutations in which one group could contain many animals with a low number of cells (which would yield a large variance of the permutation distribution). We therefore used a stratified permutation test that circumvents this problem and that was constructed as follows:
We ranked the animals according to the number of cells recorded (which is roughly inversely proportional to the variance). We then created ‘strata’ containing, for each condition, a subset of animals that had similar ranks. This was done as follows. For the condition with the fewest number of animals, we ranked the animals according to the number of cells they had and ranked them into non-overlapping strata of 2. If the number of animals was uneven then the last strata would contain 3 animals. We then created the same number of strata for the other condition and placed them in these strata according to their ranks.
For example, the division of strata for the following distributions of animal and cell numbers would be as follows
|
| |||||
| Stratum | N Cells | Knockout | Stratum | N Cells | Control |
|
| |||||
| 1 | 2 | 1 | 1 | 2 | 7 |
|
| |||||
| 1 | 5 | 2 | 1 | 3 | 8 |
|
| |||||
| 2 | 10 | 3 | 1 | 5 | 9 |
|
| |||||
| 2 | 20 | 4 | 2 | 9 | 10 |
|
| |||||
| 3 | 40 | 5 | 2 | 15 | 11 |
|
| |||||
| 3 | 100 | 6 | 2 | 25 | 12 |
|
| |||||
| 3 | 40 | 13 | |||
|
| |||||
| 3 | 60 | 14 | |||
|
| |||||
| 3 | 90 | 15 | |||
|
| |||||
Then, one permutation would look as follows
|
| |||||
| Stratum | N Cells | Random 1 | Stratum | N Cells | Random 2 |
|
| |||||
| 1 | 2 | 1 | 1 | 5 | 2 |
|
| |||||
| 1 | 2 | 7 | 1 | 3 | 8 |
|
| |||||
| 2 | 10 | 3 | 1 | 5 | 9 |
|
| |||||
| 2 | 9 | 10 | 2 | 20 | 4 |
|
| |||||
| 3 | 40 | 13 | 2 | 15 | 11 |
|
| |||||
| 3 | 60 | 14 | 2 | 25 | 12 |
|
| |||||
| 3 | 40 | 5 | |||
|
| |||||
| 3 | 100 | 6 | |||
|
| |||||
| 3 | 90 | 15 | |||
|
| |||||
We then computed, for each condition, the semiweighted estimator, which yields a difference between the semiweighted estimator in the control and the mutant condition. For each random permutation, we also computed the difference between the semiweighted estimator for the random group 1 and the random group 2. This yielded a randomization distribution of differences between the conditions. Under the null hypothesis, the data are exchangeable between the knockout and the control conditions (i.e. their statistical distributions are identical). We tested against this null hypothesis by comparing the observed difference in semiweighted estimators with the 95% percentile of the randomization distribution.
We compared the resulting p-values with comparing the mean and sem values of the semi-weighted estimators according to the T-distribution (as in (Lur et al., 2016)), which generally agreed very well. Compared to directly testing for differences between cells as is commonly done in neuroscience, the p-values we observed were often a few orders of magnitude larger, while our procedure was generally more sensitive than computing the mean per animal first and performing statistics over those per-animal means.
At all places in the manuscript, we used this stratified permutation test over the semi-weighted estimators to test for statistical differences. In the figures where we show pairwise differences between conditions, for example locomotion vs. quiescence and stimulus vs. baseline, we show weighted means (Fig. 3C–D, Fig. 4D, G). In those figures where we report spike-spike and spike-field correlations, we also show weighted means. This allows one to judge whether these differences and correlations are significantly different from zero. In these cases, we always performed statistical testing over the semi-weighted means of the pairwise differences. For other figures where this is not relevant, for example absolute firing rates or LV values, we show the semi-weighted means.
Supplementary Material
Acknowledgments
The authors are grateful to A. Buonanno for the ErbB4 antibodies, A. Koleske for the ErbB4F/F mice, and B. Li for the ErbB4 virus. We thank R. Pant for assistance with histology and A. Airhart, T. Church, and A. Murray for assistance with the visual task. We thank U. Knoblich for initial work on the behavioral apparatus. We thank Q. Perrenoud for mouse illustrations. This work was supported by a Brown-Coxe fellowship, a Jane Coffin Childs Fellowship, and a NARSAD Young Investigator Award to RBB; a Rubicon fellowship and a Human Frontiers Postdoctoral Fellowship to MV; NIH R01 MH099045 to MJH; and NIH R01 MH102365, NIH R01 EY022951, a Smith Family Award for Excellence in Biomedical Research, a Klingenstein Fellowship Award, an Alfred P. Sloan Fellowship, a NARSAD Young Investigator Award, and a McKnight Fellowship to JAC.
Footnotes
Publisher's Disclaimer: This is a PDF file of an unedited manuscript that has been accepted for publication. As a service to our customers we are providing this early version of the manuscript. The manuscript will undergo copyediting, typesetting, and review of the resulting proof before it is published in its final citable form. Please note that during the production process errors may be discovered which could affect the content, and all legal disclaimers that apply to the journal pertain.
Author Contributions: RBB, MV, KAF, and JAC designed experiments. RBB and MV performed in vivo electrophysiology recordings. RBB and MV performed visual behavior experiments. RBB and MV analyzed in vivo electrophysiology and visual behavior data. GL and KAF performed surgical implants for 2-photon imaging. KAF performed 2–photon imaging experiments and analyzed data. VH and JMM performed and analyzed standard behavioral assays. DL, JC, and MJH performed and analyzed in vitro electrophysiology experiments. KD and CR generated the Flp-dependent GCaMP6m construct. RBB, MV, and JAC wrote manuscript.
References
- Abe Y, Namba H, Kato T, Iwakura Y, Nawa H. Neuregulin-1 signals from the periphery regulate AMPA receptor sensitivity and expression in GABAergic interneurons in developing neocortex. The Journal of neuroscience: the official journal of the Society for Neuroscience. 2011;31:5699–5709. doi: 10.1523/JNEUROSCI.3477-10.2011. [DOI] [PMC free article] [PubMed] [Google Scholar]
- Agim ZS, Esendal M, Briollais L, Uyan O, Meschian M, Martinez LA, Ding Y, Basak AN, Ozcelik H. Discovery, validation and characterization of Erbb4 and Nrg1 haplotypes using data from three genome-wide association studies of schizophrenia. PloS one. 2013;8:e53042. doi: 10.1371/journal.pone.0053042. [DOI] [PMC free article] [PubMed] [Google Scholar]
- Ahrens S, Jaramillo S, Yu K, Ghosh S, Hwang GR, Paik R, Lai C, He M, Huang ZJ, Li B. ErbB4 regulation of a thalamic reticular nucleus circuit for sensory selection. Nature neuroscience. 2015;18:104–111. doi: 10.1038/nn.3897. [DOI] [PMC free article] [PubMed] [Google Scholar]
- Allene C, Cattani A, Ackman JB, Bonifazi P, Aniksztejn L, Ben-Ari Y, Cossart R. Sequential generation of two distinct synapse-driven network patterns in developing neocortex. The Journal of neuroscience: the official journal of the Society for Neuroscience. 2008;28:12851–12863. doi: 10.1523/JNEUROSCI.3733-08.2008. [DOI] [PMC free article] [PubMed] [Google Scholar]
- Anastasiades PG, Marques-Smith A, Lyngholm D, Lickiss T, Raffiq S, Katzel D, Miesenbock G, Butt SJ. GABAergic interneurons form transient layer-specific circuits in early postnatal neocortex. Nature communications. 2016;7:10584. doi: 10.1038/ncomms10584. [DOI] [PMC free article] [PubMed] [Google Scholar]
- Barz CS, Bessaih T, Abel T, Feldmeyer D, Contreras D. Altered resonance properties of somatosensory responses in mice deficient for the schizophrenia risk gene Neuregulin 1. Brain structure & function. 2015 doi: 10.1007/s00429-015-1169-6. [DOI] [PMC free article] [PubMed] [Google Scholar]
- Barz CS, Bessaih T, Abel T, Feldmeyer D, Contreras D. Sensory encoding in Neuregulin 1 mutants. Brain structure & function. 2016;221:1067–1081. doi: 10.1007/s00429-014-0955-x. [DOI] [PMC free article] [PubMed] [Google Scholar]
- Bonifazi P, Goldin M, Picardo MA, Jorquera I, Cattani A, Bianconi G, Represa A, Ben-Ari Y, Cossart R. GABAergic hub neurons orchestrate synchrony in developing hippocampal networks. Science. 2009;326:1419–1424. doi: 10.1126/science.1175509. [DOI] [PubMed] [Google Scholar]
- Cardin JA. Snapshots of the Brain in Action: Local Circuit Operations through the Lens of gamma Oscillations. The Journal of neuroscience: the official journal of the Society for Neuroscience. 2016;36:10496–10504. doi: 10.1523/JNEUROSCI.1021-16.2016. [DOI] [PMC free article] [PubMed] [Google Scholar]
- Cardin JA, Kumbhani RD, Contreras D, Palmer LA. Cellular mechanisms of temporal sensitivity in visual cortex neurons. The Journal of neuroscience: the official journal of the Society for Neuroscience. 2010;30:3652–3662. doi: 10.1523/JNEUROSCI.5279-09.2010. [DOI] [PMC free article] [PubMed] [Google Scholar]
- Cardin JA, Carlen M, Meletis K, Knoblich U, Zhang F, Deisseroth K, Tsai LH, Moore CI. Driving fast-spiking cells induces gamma rhythm and controls sensory responses. Nature. 2009;459:663–667. doi: 10.1038/nature08002. [DOI] [PMC free article] [PubMed] [Google Scholar]
- Chen YJ, Zhang M, Yin DM, Wen L, Ting A, Wang P, Lu YS, Zhu XH, Li SJ, Wu CY, Wang XM, Lai C, Xiong WC, Mei L, Gao TM. ErbB4 in parvalbumin-positive interneurons is critical for neuregulin 1 regulation of long-term potentiation. Proceedings of the National Academy of Sciences of the United States of America. 2010;107:21818–21823. doi: 10.1073/pnas.1010669107. [DOI] [PMC free article] [PubMed] [Google Scholar]
- Chiu CQ, Lur G, Morse TM, Carnevale NT, Ellis-Davies GC, Higley MJ. Compartmentalization of GABAergic inhibition by dendritic spines. Science. 2013;340:759–762. doi: 10.1126/science.1234274. [DOI] [PMC free article] [PubMed] [Google Scholar]
- Chung Y, Rabe-Hesketh S, Choi IH. Avoiding zero between-study variance estimates in random-effects meta-analysis. Statistics in medicine. 2013;32:4071–4089. doi: 10.1002/sim.5821. [DOI] [PubMed] [Google Scholar]
- Clements JD, Bekkers JM. Detection of spontaneous synaptic events with an optimally scaled template. Biophysical journal. 1997;73:220–229. doi: 10.1016/S0006-3495(97)78062-7. [DOI] [PMC free article] [PubMed] [Google Scholar]
- Del Pino I, Garcia-Frigola C, Dehorter N, Brotons-Mas JR, Alvarez-Salvado E, Martinez de Lagran M, Ciceri G, Gabaldon MV, Moratal D, Dierssen M, Canals S, Marin O, Rico B. Erbb4 deletion from fast-spiking interneurons causes schizophrenia-like phenotypes. Neuron. 2013;79:1152–1168. doi: 10.1016/j.neuron.2013.07.010. [DOI] [PubMed] [Google Scholar]
- DerSimonian R, Laird N. Meta-analysis in clinical trials. Controlled clinical trials. 1986;7:177–188. doi: 10.1016/0197-2456(86)90046-2. [DOI] [PubMed] [Google Scholar]
- Dipoppa MR,A, Krumin M, Pachitariu M, Carandini M, Harris KD. Vision and locomotion shape the interactions between neuron types in mouse visual cortex. bioRxiv. 2016 doi: 10.1016/j.neuron.2018.03.037. [DOI] [PMC free article] [PubMed] [Google Scholar]
- Dubbs A, Guevara J, Yuste R. moco: Fast Motion Correction for Calcium Imaging. Frontiers in neuroinformatics. 2016;10:6. doi: 10.3389/fninf.2016.00006. [DOI] [PMC free article] [PubMed] [Google Scholar]
- Erisken S, Vaiceliunaite A, Jurjut O, Fiorini M, Katzner S, Busse L. Effects of locomotion extend throughout the mouse early visual system. Current biology: CB. 2014;24:2899–2907. doi: 10.1016/j.cub.2014.10.045. [DOI] [PubMed] [Google Scholar]
- Fazzari P, Paternain AV, Valiente M, Pla R, Lujan R, Lloyd K, Lerma J, Marin O, Rico B. Control of cortical GABA circuitry development by Nrg1 and ErbB4 signalling. Nature. 2010;464:1376–1380. doi: 10.1038/nature08928. [DOI] [PubMed] [Google Scholar]
- Fishell G, Rudy B. Mechanisms of Inhibition within the Telencephalon: “Where the Wild Things Are”. Annu Rev Neurosci. 2010 doi: 10.1146/annurev-neuro-061010-113717. [DOI] [PMC free article] [PubMed] [Google Scholar]
- Flames N, Long JE, Garratt AN, Fischer TM, Gassmann M, Birchmeier C, Lai C, Rubenstein JL, Marin O. Short- and long-range attraction of cortical GABAergic interneurons by neuregulin-1. Neuron. 2004;44:251–261. doi: 10.1016/j.neuron.2004.09.028. [DOI] [PubMed] [Google Scholar]
- Fries P. Neuronal gamma-band synchronization as a fundamental process in cortical computation. Annual review of neuroscience. 2009;32:209–224. doi: 10.1146/annurev.neuro.051508.135603. [DOI] [PubMed] [Google Scholar]
- Fu Y, Kaneko M, Tang Y, Alvarez-Buylla A, Stryker MP. A cortical disinhibitory circuit for enhancing adult plasticity. eLife. 2015;4:e05558. doi: 10.7554/eLife.05558. [DOI] [PMC free article] [PubMed] [Google Scholar]
- Fu Y, Tucciarone JM, Espinosa JS, Sheng N, Darcy DP, Nicoll RA, Huang ZJ, Stryker MP. A cortical circuit for gain control by behavioral state. Cell. 2014;156:1139–1152. doi: 10.1016/j.cell.2014.01.050. [DOI] [PMC free article] [PubMed] [Google Scholar]
- Fung SJ, Fillman SG, Webster MJ, Shannon Weickert C. Schizophrenia and bipolar disorder show both common and distinct changes in cortical interneuron markers. Schizophrenia research. 2014;155:26–30. doi: 10.1016/j.schres.2014.02.021. [DOI] [PubMed] [Google Scholar]
- Fung SJ, Webster MJ, Sivagnanasundaram S, Duncan C, Elashoff M, Weickert CS. Expression of interneuron markers in the dorsolateral prefrontal cortex of the developing human and in schizophrenia. The American journal of psychiatry. 2010;167:1479–1488. doi: 10.1176/appi.ajp.2010.09060784. [DOI] [PubMed] [Google Scholar]
- Gandal MJ, Edgar JC, Klook K, Siegel SJ. Gamma synchrony: towards a translational biomarker for the treatment-resistant symptoms of schizophrenia. Neuropharmacology. 2012;62:1504–1518. doi: 10.1016/j.neuropharm.2011.02.007. [DOI] [PMC free article] [PubMed] [Google Scholar]
- Galbraith S, Daniel JA, Vissel B. A Study of Clustered Data and Approaches to Its Analysis. Journal of Neuroscience. 2010;30:10601–10608. doi: 10.1523/JNEUROSCI.0362-10.2010. [DOI] [PMC free article] [PubMed] [Google Scholar]
- Garcia-Junco-Clemente P, Ikrar T, Tring E, Xu X, Ringach DL, Trachtenberg JT. An inhibitory pull-push circuit in frontal cortex. Nature neuroscience. 2017;20:389–392. doi: 10.1038/nn.4483. [DOI] [PMC free article] [PubMed] [Google Scholar]
- Geddes AE, Huang XF, Newell KA. Reciprocal signalling between NR2 subunits of the NMDA receptor and neuregulin1 and their role in schizophrenia. Prog Neuropsychopharmacol Biol Psychiatry. 2011;35:896–904. doi: 10.1016/j.pnpbp.2011.02.017. [DOI] [PubMed] [Google Scholar]
- Gibson JR, Beierlein M, Connors BW. Two networks of electrically coupled inhibitory neurons in neocortex. Nature. 1999;402:75–79. doi: 10.1038/47035. [DOI] [PubMed] [Google Scholar]
- Golub MS, Germann SL, Lloyd KC. Behavioral characteristics of a nervous system-specific erbB4 knock-out mouse. Behavioural brain research. 2004;153:159–170. doi: 10.1016/j.bbr.2003.11.010. [DOI] [PubMed] [Google Scholar]
- Hahn CG, Wang HY, Cho DS, Talbot K, Gur RE, Berrettini WH, Bakshi K, Kamins J, Borgmann-Winter KE, Siegel SJ, Gallop RJ, Arnold SE. Altered neuregulin 1-erbB4 signaling contributes to NMDA receptor hypofunction in schizophrenia. Nat Med. 2006;12:824–828. doi: 10.1038/nm1418. [DOI] [PubMed] [Google Scholar]
- Hamm JP, Yuste R. Somatostatin Interneurons Control a Key Component of Mismatch Negativity in Mouse Visual Cortex. Cell reports. 2016;16:597–604. doi: 10.1016/j.celrep.2016.06.037. [DOI] [PMC free article] [PubMed] [Google Scholar]
- Hamm JP, Peterka DS, Gogos JA, Yuste R. Altered Cortical Ensembles in Mouse Models of Schizophrenia. Neuron. 2017;94:153–167 e158. doi: 10.1016/j.neuron.2017.03.019. [DOI] [PMC free article] [PubMed] [Google Scholar]
- Hasenstaub A, Shu Y, Haider B, Kraushaar U, Duque A, McCormick DA. Inhibitory postsynaptic potentials carry synchronized frequency information in active cortical networks. Neuron. 2005;47:423–435. doi: 10.1016/j.neuron.2005.06.016. [DOI] [PubMed] [Google Scholar]
- Hashimoto T, Arion D, Unger T, Maldonado-Aviles JG, Morris HM, Volk DW, Mirnics K, Lewis DA. Alterations in GABA-related transcriptome in the dorsolateral prefrontal cortex of subjects with schizophrenia. Molecular psychiatry. 2008;13:147–161. doi: 10.1038/sj.mp.4002011. [DOI] [PMC free article] [PubMed] [Google Scholar]
- Hensch TK. Critical period plasticity in local cortical circuits. Nature reviews Neuroscience. 2005;6:877–888. doi: 10.1038/nrn1787. [DOI] [PubMed] [Google Scholar]
- Hikida T, Jaaro-Peled H, Seshadri S, Oishi K, Hookway C, Kong S, Wu D, Xue R, Andrade M, Tankou S, Mori S, Gallagher M, Ishizuka K, Pletnikov M, Kida S, Sawa A. Dominant-negative DISC1 transgenic mice display schizophrenia-associated phenotypes detected by measures translatable to humans. Proceedings of the National Academy of Sciences of the United States of America. 2007;104:14501–14506. doi: 10.1073/pnas.0704774104. [DOI] [PMC free article] [PubMed] [Google Scholar]
- Joshi D, Fullerton JM, Weickert CS. Elevated ErbB4 mRNA is related to interneuron deficit in prefrontal cortex in schizophrenia. Journal of psychiatric research. 2014;53:125–132. doi: 10.1016/j.jpsychires.2014.02.014. [DOI] [PubMed] [Google Scholar]
- Kamigaki T, Dan Y. Delay activity of specific prefrontal interneuron subtypes modulates memory-guided behavior. Nature neuroscience. 2017;20:854–863. doi: 10.1038/nn.4554. [DOI] [PMC free article] [PubMed] [Google Scholar]
- Karl T, Duffy L, Scimone A, Harvey RP, Schofield PR. Altered motor activity, exploration and anxiety in heterozygous neuregulin 1 mutant mice: implications for understanding schizophrenia. Genes, brain, and behavior. 2007;6:677–687. doi: 10.1111/j.1601-183X.2006.00298.x. [DOI] [PubMed] [Google Scholar]
- Karnani MM, Jackson J, Ayzenshtat I, Tucciarone J, Manoocheri K, Snider WG, Yuste R. Cooperative Subnetworks of Molecularly Similar Interneurons in Mouse Neocortex. Neuron. 2016;90:86–100. doi: 10.1016/j.neuron.2016.02.037. [DOI] [PMC free article] [PubMed] [Google Scholar]
- Karouni M, Arulthas S, Larsson PG, Rytter E, Johannessen SI, Landmark CJ. Psychiatric comorbidity in patients with epilepsy: a population-based study. European journal of clinical pharmacology. 2010;66:1151–1160. doi: 10.1007/s00228-010-0861-y. [DOI] [PubMed] [Google Scholar]
- Kepecs A, Fishell G. Interneuron cell types are fit to function. Nature. 2014;505:318–326. doi: 10.1038/nature12983. [DOI] [PMC free article] [PubMed] [Google Scholar]
- Kwon OB, Longart M, Vullhorst D, Hoffman DA, Buonanno A. Neuregulin-1 reverses long-term potentiation at CA1 hippocampal synapses. The Journal of neuroscience: the official journal of the Society for Neuroscience. 2005;25:9378–9383. doi: 10.1523/JNEUROSCI.2100-05.2005. [DOI] [PMC free article] [PubMed] [Google Scholar]
- Lee S, Kruglikov I, Huang ZJ, Fishell G, Rudy B. A disinhibitory circuit mediates motor integration in the somatosensory cortex. Nature neuroscience. 2013;16:1662–1670. doi: 10.1038/nn.3544. [DOI] [PMC free article] [PubMed] [Google Scholar]
- Lee SH, Kim DW, Kim EY, Kim S, Im CH. Dysfunctional gamma-band activity during face structural processing in schizophrenia patients. Schizophr Res. 2010;119:191–197. doi: 10.1016/j.schres.2010.02.1058. [DOI] [PubMed] [Google Scholar]
- Leung C, Jia Z. Mouse Genetic Models of Human Brain Disorders. Frontiers in genetics. 2016;7:40. doi: 10.3389/fgene.2016.00040. [DOI] [PMC free article] [PubMed] [Google Scholar]
- Lewis DA, Lieberman JA. Catching up on schizophrenia: natural history and neurobiology. Neuron. 2000;28:325–334. doi: 10.1016/s0896-6273(00)00111-2. [DOI] [PubMed] [Google Scholar]
- Li B, Woo RS, Mei L, Malinow R. The neuregulin-1 receptor erbB4 controls glutamatergic synapse maturation and plasticity. Neuron. 2007;54:583–597. doi: 10.1016/j.neuron.2007.03.028. [DOI] [PMC free article] [PubMed] [Google Scholar]
- Lu CL, Wang YC, Chen JY, Lai IC, Liou YJ. Support for the involvement of the ERBB4 gene in schizophrenia: a genetic association analysis. Neuroscience letters. 2010;481:120–125. doi: 10.1016/j.neulet.2010.06.067. [DOI] [PubMed] [Google Scholar]
- Lur G, Vinck MA, Tang L, Cardin JA, Higley MJ. Projection-Specific Visual Feature Encoding by Layer 5 Cortical Subnetworks. Cell reports. 2016;14:2538–2545. doi: 10.1016/j.celrep.2016.02.050. [DOI] [PMC free article] [PubMed] [Google Scholar]
- Marques-Smith A, Lyngholm D, Kaufmann AK, Stacey JA, Hoerder-Suabedissen A, Becker EB, Wilson MC, Molnar Z, Butt SJ. A Transient Translaminar GABAergic Interneuron Circuit Connects Thalamocortical Recipient Layers in Neonatal Somatosensory Cortex. Neuron. 2016;89:536–549. doi: 10.1016/j.neuron.2016.01.015. [DOI] [PMC free article] [PubMed] [Google Scholar]
- Martinez A, Hillyard SA, Dias EC, Hagler DJ, Jr, Butler PD, Guilfoyle DN, Jalbrzikowski M, Silipo G, Javitt DC. Magnocellular pathway impairment in schizophrenia: evidence from functional magnetic resonance imaging. The Journal of neuroscience: the official journal of the Society for Neuroscience. 2008;28:7492–7500. doi: 10.1523/JNEUROSCI.1852-08.2008. [DOI] [PMC free article] [PubMed] [Google Scholar]
- Mei L, Xiong WC. Neuregulin 1 in neural development, synaptic plasticity and schizophrenia. Nat Rev Neurosci. 2008;9:437–452. doi: 10.1038/nrn2392. [DOI] [PMC free article] [PubMed] [Google Scholar]
- Mei L, Nave KA. Neuregulin-ERBB signaling in the nervous system and neuropsychiatric diseases. Neuron. 2014;83:27–49. doi: 10.1016/j.neuron.2014.06.007. [DOI] [PMC free article] [PubMed] [Google Scholar]
- Mineault PJ, Tring E, Trachtenberg JT, Ringach DL. Enhanced Spatial Resolution During Locomotion and Heightened Attention in Mouse Primary Visual Cortex. The Journal of neuroscience: the official journal of the Society for Neuroscience. 2016;36:6382–6392. doi: 10.1523/JNEUROSCI.0430-16.2016. [DOI] [PMC free article] [PubMed] [Google Scholar]
- Miyoshi G, Young A, Petros T, Karayannis T, McKenzie Chang M, Lavado A, Iwano T, Nakajima M, Taniguchi H, Huang ZJ, Heintz N, Oliver G, Matsuzaki F, Machold RP, Fishell G. Prox1 Regulates the Subtype-Specific Development of Caudal Ganglionic Eminence-Derived GABAergic Cortical Interneurons. The Journal of neuroscience: the official journal of the Society for Neuroscience. 2015;35:12869–12889. doi: 10.1523/JNEUROSCI.1164-15.2015. [DOI] [PMC free article] [PubMed] [Google Scholar]
- Munoz W, Tremblay R, Levenstein D, Rudy B. Layer-specific modulation of neocortical dendritic inhibition during active wakefulness. Science. 2017;355:954–959. doi: 10.1126/science.aag2599. [DOI] [PubMed] [Google Scholar]
- Neddens J, Buonanno A. Selective populations of hippocampal interneurons express ErbB4 and their number and distribution is altered in ErbB4 knockout mice. Hippocampus. 2010;20:724–744. doi: 10.1002/hipo.20675. [DOI] [PMC free article] [PubMed] [Google Scholar]
- Neddens J, Fish KN, Tricoire L, Vullhorst D, Shamir A, Chung W, Lewis DA, McBain CJ, Buonanno A. Conserved interneuron-specific ErbB4 expression in frontal cortex of rodents, monkeys, and humans: implications for schizophrenia. Biological psychiatry. 2011;70:636–645. doi: 10.1016/j.biopsych.2011.04.016. [DOI] [PMC free article] [PubMed] [Google Scholar]
- Nicodemus KK, Luna A, Vakkalanka R, Goldberg T, Egan M, Straub RE, Weinberger DR. Further evidence for association between ErbB4 and schizophrenia and influence on cognitive intermediate phenotypes in healthy controls. Molecular psychiatry. 2006;11:1062–1065. doi: 10.1038/sj.mp.4001878. [DOI] [PubMed] [Google Scholar]
- Niell CM, Stryker MP. Modulation of visual responses by behavioral state in mouse visual cortex. Neuron. 2010;65:472–479. doi: 10.1016/j.neuron.2010.01.033. [DOI] [PMC free article] [PubMed] [Google Scholar]
- Pardiñas H, Pocklington, Escott-Price, Ripke, Carrera, Legge, Bishop, Cameron, Hamshere, Han, Hubbard, Lynham, Mantripragada, Walters Common schizophrenia alleles are enriched in mutation-intolerant genes and maintained by background selection. bioRxiv. 2016 doi: 10.1038/s41588-018-0059-2. [DOI] [PMC free article] [PubMed] [Google Scholar]
- Pfeffer CK, Xue M, He M, Huang ZJ, Scanziani M. Inhibition of inhibition in visual cortex: the logic of connections between molecularly distinct interneurons. Nature neuroscience. 2013;16:1068–1076. doi: 10.1038/nn.3446. [DOI] [PMC free article] [PubMed] [Google Scholar]
- Pi HJ, Hangya B, Kvitsiani D, Sanders JI, Huang ZJ, Kepecs A. Cortical interneurons that specialize in disinhibitory control. Nature. 2013;503:521–524. doi: 10.1038/nature12676. [DOI] [PMC free article] [PubMed] [Google Scholar]
- Picardo MA, Guigue P, Bonifazi P, Batista-Brito R, Allene C, Ribas A, Fishell G, Baude A, Cossart R. Pioneer GABA cells comprise a subpopulation of hub neurons in the developing hippocampus. Neuron. 2011;71:695–709. doi: 10.1016/j.neuron.2011.06.018. [DOI] [PMC free article] [PubMed] [Google Scholar]
- Pitcher GM, Kalia LV, Ng D, Goodfellow NM, Yee KT, Lambe EK, Salter MW. Schizophrenia susceptibility pathway neuregulin 1-ErbB4 suppresses Src upregulation of NMDA receptors. Nat Med. 2011;17:470–478. doi: 10.1038/nm.2315. [DOI] [PMC free article] [PubMed] [Google Scholar]
- Polack PO, Friedman J, Golshani P. Cellular mechanisms of brain state-dependent gain modulation in visual cortex. Nature neuroscience. 2013;16:1331–1339. doi: 10.1038/nn.3464. [DOI] [PMC free article] [PubMed] [Google Scholar]
- Pouille F, Scanziani M. Enforcement of temporal fidelity in pyramidal cells by somatic feed-forward inhibition. Science. 2001;293:1159–1163. doi: 10.1126/science.1060342. [DOI] [PubMed] [Google Scholar]
- Pronneke A, Scheuer B, Wagener RJ, Mock M, Witte M, Staiger JF. Characterizing VIP Neurons in the Barrel Cortex of VIPcre/tdTomato Mice Reveals Layer-Specific Differences. Cerebral cortex. 2015;25:4854–4868. doi: 10.1093/cercor/bhv202. [DOI] [PMC free article] [PubMed] [Google Scholar]
- Rico B, Marin O. Neuregulin signaling, cortical circuitry development and schizophrenia. Current opinion in genetics & development. 2011;21:262–270. doi: 10.1016/j.gde.2010.12.010. [DOI] [PubMed] [Google Scholar]
- Rochefort NL, Narushima M, Grienberger C, Marandi N, Hill DN, Konnerth A. Development of direction selectivity in mouse cortical neurons. Neuron. 2011;71:425–432. doi: 10.1016/j.neuron.2011.06.013. [DOI] [PubMed] [Google Scholar]
- Rossignol E. Genetics and function of neocortical GABAergic interneurons in neurodevelopmental disorders. Neural plasticity. 2011;2011:649325. doi: 10.1155/2011/649325. [DOI] [PMC free article] [PubMed] [Google Scholar]
- Rudy B, Fishell G, Lee S, Hjerling-Leffler J. Three groups of interneurons account for nearly 100% of neocortical GABAergic neurons. Developmental neurobiology. 2011;71:45–61. doi: 10.1002/dneu.20853. [DOI] [PMC free article] [PubMed] [Google Scholar]
- Saleem AB, Ayaz A, Jeffery KJ, Harris KD, Carandini M. Integration of visual motion and locomotion in mouse visual cortex. Nature neuroscience. 2013;16:1864–1869. doi: 10.1038/nn.3567. [DOI] [PMC free article] [PubMed] [Google Scholar]
- Serrano-Pedraza I, Romero-Ferreiro V, Read JC, Dieguez-Risco T, Bagney A, Caballero-Gonzalez M, Rodriguez-Torresano J, Rodriguez-Jimenez R. Reduced visual surround suppression in schizophrenia shown by measuring contrast detection thresholds. Frontiers in psychology. 2014;5:1431. doi: 10.3389/fpsyg.2014.01431. [DOI] [PMC free article] [PubMed] [Google Scholar]
- Shamir A, Kwon OB, Karavanova I, Vullhorst D, Leiva-Salcedo E, Janssen MJ, Buonanno A. The importance of the NRG-1/ErbB4 pathway for synaptic plasticity and behaviors associated with psychiatric disorders. The Journal of neuroscience: the official journal of the Society for Neuroscience. 2012;32:2988–2997. doi: 10.1523/JNEUROSCI.1899-11.2012. [DOI] [PMC free article] [PubMed] [Google Scholar]
- Shi J, et al. Common variants on chromosome 6p22.1 are associated with schizophrenia. Nature. 2009;460:753–757. doi: 10.1038/nature08192. [DOI] [PMC free article] [PubMed] [Google Scholar]
- Shinomoto S, Kim H, Shimokawa T, Matsuno N, Funahashi S, Shima K, Fujita I, Tamura H, Doi T, Kawano K, et al. Relating neuronal firing patterns to functional differentiation of cerebral cortex. PLoS computational biology. 2009;5:e1000433. doi: 10.1371/journal.pcbi.1000433. [DOI] [PMC free article] [PubMed] [Google Scholar]
- Silberberg G, Darvasi A, Pinkas-Kramarski R, Navon R. The involvement of ErbB4 with schizophrenia: association and expression studies. American journal of medical genetics Part B, Neuropsychiatric genetics: the official publication of the International Society of Psychiatric Genetics. 2006;141B:142–148. doi: 10.1002/ajmg.b.30275. [DOI] [PubMed] [Google Scholar]
- Slaghuis WL. Spatio-temporal luminance contrast sensitivity and visual backward masking in schizophrenia. Experimental brain research. 2004;156:196–211. doi: 10.1007/s00221-003-1771-3. [DOI] [PubMed] [Google Scholar]
- Takesian AE, Hensch TK. Balancing plasticity/stability across brain development. Progress in brain research. 2013;207:3–34. doi: 10.1016/B978-0-444-63327-9.00001-1. [DOI] [PubMed] [Google Scholar]
- Tan HR, Lana L, Uhlhaas PJ. High-frequency neural oscillations and visual processing deficits in schizophrenia. Frontiers in psychology. 2013;4:621. doi: 10.3389/fpsyg.2013.00621. [DOI] [PMC free article] [PubMed] [Google Scholar]
- Ting AK, Chen Y, Wen L, Yin DM, Shen C, Tao Y, Liu X, Xiong WC, Mei L. Neuregulin 1 promotes excitatory synapse development and function in GABAergic interneurons. The Journal of neuroscience: the official journal of the Society for Neuroscience. 2011;31:15–25. doi: 10.1523/JNEUROSCI.2538-10.2011. [DOI] [PMC free article] [PubMed] [Google Scholar]
- Tuncdemir SN, Wamsley B, Stam FJ, Osakada F, Goulding M, Callaway EM, Rudy B, Fishell G. Early Somatostatin Interneuron Connectivity Mediates the Maturation of Deep Layer Cortical Circuits. Neuron. 2016;89:521–535. doi: 10.1016/j.neuron.2015.11.020. [DOI] [PMC free article] [PubMed] [Google Scholar]
- Uhlhaas PJ, Singer W. Abnormal neural oscillations and synchrony in schizophrenia. Nature reviews Neuroscience. 2010;11:100–113. doi: 10.1038/nrn2774. [DOI] [PubMed] [Google Scholar]
- van Versendaal D, Levelt CN. Inhibitory interneurons in visual cortical plasticity. Cellular and molecular life sciences: CMLS. 2016 doi: 10.1007/s00018-016-2264-4. [DOI] [PMC free article] [PubMed] [Google Scholar]
- Vinck M, Batista-Brito R, Knoblich U, Cardin JA. Arousal and locomotion make distinct contributions to cortical activity patterns and visual encoding. Neuron. 2015;86:740–754. doi: 10.1016/j.neuron.2015.03.028. [DOI] [PMC free article] [PubMed] [Google Scholar]
- Vinck M, Womelsdorf T, Buffalo EA, Desimone R, Fries P. Attentional modulation of cell-class-specific gamma-band synchronization in awake monkey area v4. Neuron. 2013;80:1077–1089. doi: 10.1016/j.neuron.2013.08.019. [DOI] [PMC free article] [PubMed] [Google Scholar]
- Vinck M, Battaglia FP, Womelsdorf T, Pennartz C. Improved measures of phase-coupling between spikes and the Local Field Potential. Journal of computational neuroscience. 2012;33:53–75. doi: 10.1007/s10827-011-0374-4. [DOI] [PMC free article] [PubMed] [Google Scholar]
- Volk DW, Matsubara T, Li S, Sengupta EJ, Georgiev D, Minabe Y, Sampson A, Hashimoto T, Lewis DA. Deficits in transcriptional regulators of cortical parvalbumin neurons in schizophrenia. The American journal of psychiatry. 2012;169:1082–1091. doi: 10.1176/appi.ajp.2012.12030305. [DOI] [PMC free article] [PubMed] [Google Scholar]
- Wehr M, Zador AM. Balanced inhibition underlies tuning and sharpens spike timing in auditory cortex. Nature. 2003;426:442–446. doi: 10.1038/nature02116. [DOI] [PubMed] [Google Scholar]
- Wen L, Lu YS, Zhu XH, Li XM, Woo RS, Chen YJ, Yin DM, Lai C, Terry AV, Jr, Vazdarjanova A, Xiong WC, Mei L. Neuregulin 1 regulates pyramidal neuron activity via ErbB4 in parvalbumin-positive interneurons. Proceedings of the National Academy of Sciences of the United States of America. 2010;107:1211–1216. doi: 10.1073/pnas.0910302107. [DOI] [PMC free article] [PubMed] [Google Scholar]
- Womelsdorf T, Lima B, Vinck M, Oostenveld R, Singer W, Neuenschwander S, Fries P. Orientation selectivity and noise correlation in awake monkey area V1 are modulated by the gamma cycle. Proceedings of the National Academy of Sciences of the United States of America. 2012;109:4302–4307. doi: 10.1073/pnas.1114223109. [DOI] [PMC free article] [PubMed] [Google Scholar]
- Woo RS, Li XM, Tao Y, Carpenter-Hyland E, Huang YZ, Weber J, Neiswender H, Dong XP, Wu J, Gassmann M, Lai C, Xiong WC, Gao TM, Mei L. Neuregulin-1 enhances depolarization-induced GABA release. Neuron. 2007;54:599–610. doi: 10.1016/j.neuron.2007.04.009. [DOI] [PubMed] [Google Scholar]
- Yau HJ, Wang HF, Lai C, Liu FC. Neural development of the neuregulin receptor ErbB4 in the cerebral cortex and the hippocampus: preferential expression by interneurons tangentially migrating from the ganglionic eminences. Cerebral cortex. 2003;13:252–264. doi: 10.1093/cercor/13.3.252. [DOI] [PubMed] [Google Scholar]
Associated Data
This section collects any data citations, data availability statements, or supplementary materials included in this article.