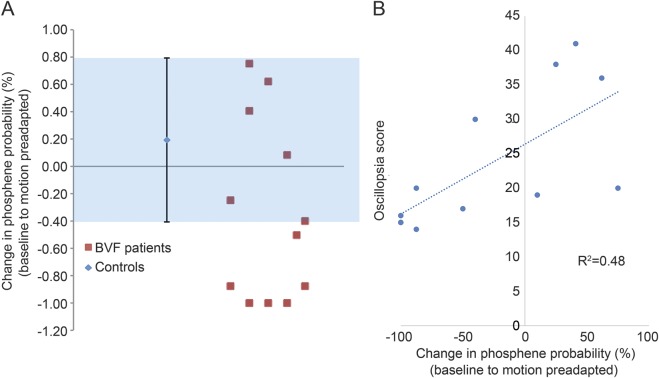
Figure 4. Changes in cortical excitability from baseline to motion.
(A) The y-axis shows the percent change in the probability of perceiving a phosphene from baseline to the motion preadapted condition. Blue shaded areas represent the healthy controls with an error bar of 3 SDs. The change for each patient is represented by the red squares. Patients with disappearing phosphenes during visual motion onset fell outside the 3 SDs. (B) The relationship between the percent change in the probability of perceiving a phosphene from the baseline to the motion preadapted condition on the x-axis and the oscillopsia symptom score on the y-axis. BVF = bilateral vestibular failure.

