

Abstract
AIM
The aim of the present study was to evaluate the effect of the proposed organic cation transporter (OCT) inhibitor daclatasvir on the pharmacokinetics and pharmacodynamics of the OCT substrate metformin.
METHODS
This was an open‐label, two‐period, randomized, crossover trial in 20 healthy subjects. Treatment A consisted of metformin and treatment B consisted of metformin + daclatasvir. Pharmacokinetic curves were recorded at steady‐state. Geometric mean ratios (GMRs) with 90% confidence intervals (CIs) were calculated for metformin area under the concentration–time curve from 0 h to 12 h (AUC0–12), maximum plasma concentration (Cmax) and final plasma concentration (Clast). An oral glucose tolerance test was performed, measuring insulin, glucose and lactate levels.
RESULTS
The GMRs (90% CI) of metformin AUC0–12, Cmax and Clast (B vs. A) were 109% (102–116%), 108% (101–116%) and 112% (103–122%). The geometric mean AUC0–2 for insulin, glucose and lactate during treatments A and B were 84 h.mEl–1 and 90 h.mEl–1, 13.6 h.mmol l–1 and 13.4 h.mmol l–1, and 3.4 h.mmol l–1 and 3.5 h.mmol l–1, respectively.
CONCLUSIONS
Bioequivalence analysis showed that daclatasvir does not influence the pharmacokinetics of metformin in healthy subjects. Pharmacodynamic parameters were also comparable between treatments.
Keywords: diabetes, drug interactions, drug transporters, hepatitis, pharmacokinetic–pharmacodynamic
What is Already Known about this Subject
Several drug interactions with daclatasvir have been studied previously; however, the drug–drug interaction between daclatasvir and metformin has not been evaluated, neither in vivo nor in vitro.
Metformin is a substrate of drug transporters organic cation transporter (OCT) 1 and OCT2, which are possibly inhibited by daclatasvir.
What this Study Adds
There is no drug–drug interaction between daclatasvir and metformin.
Daclatasvir and metformin can be combined but physicians are recommended to monitor for (altered) adverse events during treatment.
Tables of Links
| TARGETS | |
|---|---|
| Enzymes 2 http://www.guidetopharmacology.org/GRAC/ObjectDisplayForward?objectId=2534 | Transporters 3 |
| CYP3A4 | BCRP |
| MATE1 | |
| MATE2K | |
| OATP1B1 | |
| OCT1, 2, 3 | |
| P‐gp | |
| PMAT |
These Tables list key protein targets and ligands in this article that are hyperlinked to corresponding entries in http://www.guidetopharmacology.org, the common portal for data from the IUPHAR/BPS Guide to PHARMACOLOGY 1, and are permanently archived in the Concise Guide to PHARMACOLOGY 2015/16 2, 3.
Introduction
Chronic hepatitis C virus (HCV) infection is associated with insulin resistance, which might cause type 2 diabetes mellitus (T2DM) 4. It is estimated that 150–170 million people are infected with HCV worldwide and 422 million people were living with T2DM in 2014 5, 6. In addition, both conditions have a high impact on international healthcare because of the high morbidity and mortality rates of T2DM and HCV 7, 8.
The association between HCV and insulin resistance/T2DM has been studied extensively 9, 10. Compared with controls, there is an increased prevalence of diabetes mellitus (DM) in HCV patients 11. T2DM is two‐ to threefold more prevalent in HCV‐infected patients compared with hepatitis‐B‐infected individuals 4. Insulin resistance itself causes liver disease 4, and in combination with HCV, patients have an increased risk of developing cirrhosis and hepatocellular carcinoma 11, 12. Furthermore, insulin resistance in HCV patients is correlated with reduced efficacy of HCV treatment, and viral clearance is associated with improved insulin sensitivity 4, 13. In the literature, there is consensus about the relationship between HCV and insulin resistance/T2DM; however, the mechanisms behind this relationship are still under debate 10.
Metformin is a biguanide used for the treatment of T2DM as it has the ability to lower the blood glucose concentrations in these patients. In Western counties, metformin is the first choice in the treatment of T2DM. It is not metabolized but it is a substrate for several membrane transporters – namely, plasma membrane monoamine transporter (PMAT), organic cation transporter (OCT) 1, 2 and 3, and multidrug and toxin extrusion protein (MATE) 1 and 2K. The oral absorption and hepatic uptake of metformin is mediated by PMAT, OCT1 and OCT3. However, the involvement of the OCTs in intestinal absorption remains controversial 14, 15. Metformin is excreted renally through glomerular filtration (protein binding is negligible) and active tubular secretion 14. Tubular secretion is facilitated by uptake into the tubular cells via OCT2 and excretion into the urine via MATE1 and MATE2K 16. Tubular reabsorption might be facilitated by OCT1 and PMAT 14, 17, 18. As the renal clearance of metformin is higher than creatinine clearance, it is deduced that tubular secretion plays an important role in its excretion 19.
Drug interactions influencing metformin pharmacokinetics (PK) are a result of inhibition or induction of the previously mentioned drug transporters. The human immunodeficiency virus (HIV) integrase inhibitor dolutegravir increases the metformin exposure by 79%, probably via inhibition of OCT2 20. Rifampicin, an OCT inducer, causes increased renal clearance and tubular secretion of metformin 21.
Similarly, a potential interaction may exist between the nonstructural protein 5A (NS5A) inhibitor daclatasvir and metformin. Daclatasvir is used for the treatment of HCV infection in combination with sofosbuvir and is licensed for the treatment of genotype 1, 3 and 4 22. It is metabolized by cytochrome P450 (CYP) 3A4 and is a substrate of P‐glycoprotein (P‐gp). It does not influence drug‐metabolizing enzymes but, at least in vitro, it seems to inhibit the activity of several drug transporters, such as P‐gp, OCT1 and OCT2, organic anion transporting polypeptide 1B1 and breast cancer resistance protein 22. However, the clinical relevance of OCT1 and OCT2 inhibition was unknown at the time of the present study.
Our hypothesis is that daclatasvir could decrease metformin tubular excretion, through inhibition of OCT2, and therefore causes increased plasma concentrations and increased glucose‐lowering activity. Inhibition of OCT1 in the liver could also lead to increased plasma concentrations of metformin. The proposed in vivo PK interaction and the net pharmacodynamic (PD) effect are unknown, and therefore we conducted a PK–PD study to evaluate the potential drug–drug interaction between daclatasvir and metformin.
Methods
Study design
This was an open‐label, two‐period, randomized, crossover trial in healthy subjects. Subjects were randomized in treatment sequences AB and BA. Treatment A (reference) consisted of 500 mg metformin twice daily (BID) on days 1 and 2 (Metformin HCL Actavis 500 mg, Aurobindo Pharma ‐ Milpharm Ltd, Middlesex, United Kingdom). The dose was increased to 1000 mg BID on days 3–8. This gradual dose step‐up was chosen to limit adverse events (AEs), as subjects used metformin without food for 8 days.
Treatment B (test) consisted of 500 mg metformin BID (days 1–2) and 1000 mg metformin BID (days 3–8). From day 1 to day 8, 60 mg daclatasvir once daily was added (Daklinza®, Bristol‐Myers Squibb, Uxbridge, United Kingdom 23). Between treatments there was a washout period of 13 days.
To study metformin and daclatasvir exposure, at day 8 of treatment (steady‐state), blood samples for a PK curve were obtained up to 12 h and 24 h after intake of metformin and daclatasvir, respectively. To study metformin excretion, 12‐h urine was collected for the determination of metformin renal clearance.
The PD of metformin was studied using an oral glucose tolerance test (OGTT), which was also performed at day 8 of treatment. During this 2‐h test, venous blood was withdrawn to determine the plasma concentrations of glucose, lactate and insulin.
Study participants
Healthy males and females were included. Subjects eligible for inclusion were 18–55 years of age and had a body mass index (BMI) of 18–36 kg m–2. Subjects had to be in a good age‐appropriate health condition (physical examination, electrocardiography and biochemical, haematological and urinalysis testing).No concomitant medication was allowed, except for acetaminophen <2000 mg day–1. Main exclusion criteria were a positive HIV, hepatitis B or HCV test, pregnancy and estimated glomerular filtration rate (eGFR) <60 ml min–1.
Dosing and adherence
During study visits on days 1, 2, 3, 5 and 8, medication was administered at 08:00 h, supervised by the study personnel. In between study visits, subjects took the medication at home, and adherence was assessed as follows: (i) tablets were counted by the trial nurses; (ii) Medication Event Monitoring System (MEMS) caps (Aardex Ltd, Zug, Switzerland) were used to monitor the opening of the metformin‐containing bottles; and (iii) subjects were instructed to record the time of medication intake (and any AE) in a diary.
PK sampling and oral glucose tolerance test
The study was conducted at the Clinical Research Centre Nijmegen in the Radboud university medical center, Nijmegen, the Netherlands.
At steady‐state (day 8), blood samples were withdrawn to measure the plasma concentrations of metformin (A and B) and daclatasvir (B). Drugs were taken concomitantly after an overnight fast, and blood was withdrawn in ethylenediamine tetra‐acetic acid tubes at t = 0 (predose), 0.5, 1, 1.5, 1.9, 2.5, 3, 4, 6, 8, 10 and 12 h after metformin intake. During treatment B (daclatasvir), an additional sample was collected at 24 h. Blood samples were stored in a refrigerator until centrifuged (5 min at 1900 g). Plasma was transferred into polypropylene tubes and stored at −40°C until bioanalysis. To study metformin excretion at steady‐state and to assess the renal clearance of metformin, urine was collected for 12 h at intervals of 4 h. Prior to the start of collection, morning urine was voided before the administration of metformin. Participants were asked to drink 200 ml water every 4 h. The volume and pH of the urine were noted, and it was stored at −40°C until further bioanalysis.
For the OGTT, the participants were instructed to avoid strenuous exercise and to follow a carbohydrate‐controlled diet (at least 200–250 g carbohydrates per day) for 3 days prior to day 8. The OGTT was performed after an overnight fast for at least 14 h. At 10:00 h, the subjects drank 75 g glucose in 200 mL water. Following the glucose intake, venous blood was withdrawn at t = 0 (predose), 30, 60, 90 and 120 min to determine the plasma concentrations of glucose, lactate and insulin.
Data were collected using Castor EDC (Castor Electronic Data Capture, Ciwit BV, Amsterdam, the Netherlands).
Bioanalytical methods
Metformin and daclatasvir were analysed in the laboratory of the Department of Pharmacy of the Radboud university medical center, Nijmegen, the Netherlands. Metformin in the plasma and urine were determined using two different validated ultra‐performance liquid chromatography (UPLC) assays with ultraviolet (UV) detection (236 nm).
Metformin was extracted from 200 μl plasma using 80 μl 4 M sodium hydroxide and 3 ml 1‐butanol/ (n‐) hexane (50:50, v/v). This solution was vortexed for 1 min at 1600 rpm and centrifuged for 5 min at 1900 g. The aqueous phase was frozen for 1 min at –40°C before the organic phase was poured into a vial. Metformin was then back‐extracted from the organic phase by adding 200 μl 0.1% phosphoric acid. This solution was vortexed for 1 min at 1600 rpm and centrifuged for 5 min at 1900 g.
Metformin was extracted from 20 μl urine following the same procedures after adding 200 μl blank plasma. After back‐extraction, 100 μl of the water phase was diluted with 900 μl water before injection.
Chromatography was performed using an Acquity UPLC HSS T3 analytical column (1.8 μm, 2.1 × 100 mm; Waters, Milford, MA, USA) with a mobile phase of 0.02 M phosphate buffer, pH 3.23. The flow rate was set at 0.6 ml min–1. After every injection, the column was rinsed with a combination of eluent and acetonitrile (50:50, v/v) before equilibrating back to the initial eluent.
Accuracy across five metformin quality‐control samples, measured in three runs (n = 15) over 2 days, ranged from 101% to 103% in plasma and 98% to 101% in urine. Interday precision ranged from 0.0% to 2.4% in plasma and 0.0% to 3.9% in urine (n = 15). Intraday precision ranged from 1.2% to 5.8% in plasma and 2.3% to 8.9% in urine (n = 5). For metformin in plasma, the calibration range was 0.01–5.00 mg l–1 and for urine the range was 2.0–2100 mg l–1.
Daclatasvir was measured using a validated UPLC method with UV detection (314 nm). Daclatasvir was extracted from 100 μl plasma using 200 μl acetonitrile/methanol (50:50, v/v) with 0.1% formic acid. This solution was vortexed for 5 min at 2500 rpm and centrifuged for 5 min at 1910 g. The supernatant (170 μl) was poured into a vial and centrifuged for 5 min at 1910 g; 10 μl was then injected onto an Acquity UPLC BEH C18 analytical column (1.7 μm, 2.1 × 50 mm; Waters, Milford, MA, USA). The flow rate was set to 0.550 ml min–1, and daclatasvir was eluted by using a gradient 0.05 M phosphate buffer and 0.05 M phosphate buffer/acetonitrile 30/70 v/v.
Accuracy across five daclatasvir quality‐control samples, measured in three runs over 2 days, ranged from 98% to 107%. Interday precision ranged from 0.0% to 1.3% and intraday precision ranged from 1.3% to 6.0%. The calibration range of the method was 0.03–10 mg l–1.
Insulin samples were collected in lithium–heparinized tubes and determined at the clinical chemistry laboratory of Radboud university medical center, Nijmegen, the Netherlands (random access analyzer, Roche E170 modular immunoassay, Roche Diagnostics International Ltd, Rotkreuz, Switzerland). Glucose and lactate (blood gas tube blood gas tube Pro‐Vent 4646E, lithium‐heparin coating, Smiths Medical, MN, USA) were determined directly after sampling, using a glucose enzymatic–amperometric method (Biosen C‐line GP, EKF‐diagnostic GmbH, Barleben, Germany).
PK analysis
A noncompartmental approach was used (WinNonlin/Phoenix version 6.3, Pharsight Corporation, St Louis, MO, USA) to assess the area under the time curve from 0 h to 12 h (AUC0–12) and 12‐h plasma concentration (C12) for metformin and from 0 h to 24 h (AUC0–24) and 24‐h plasma concentration (C24) for daclatasvir. In addition, the maximum plasma concentration (Cmax), time to reach Cmax and apparent elimination half‐life of metformin and daclatasvir were determined. Metformin renal clearance was calculated by dividing the total amount of metformin excreted (0–12 h) by the AUC0–12. The secretion of metformin was calculated by subtracting the metformin clearance from the creatinine clearance, which was calculated using the Chronic Kidney Disease Epidemiology Collaboration (CKD‐EPI) formula: eGFR (mL/min/1.73 m2 = 141 × minimum (Scr/κ)α × maximum (Scr/κ, 1)−1.209 × 0.993Age × 1.018 [if female] × 1.159 [if black]). With Scr as standardized serum creatinine in mg/dL, κ as 0.7 and 0.9 for females and males, respectively, and age in years. In addition, the geometric mean ratios (GMRs) with 95% confidence intervals (CIs) (treatment B vs. treatment A) for metformin secretion and eGFR were calculated.
PD analysis
The plasma concentrations of glucose, lactate and insulin were used to calculate the area under the concentration–time curve from 0 h to 2 h (AUC0–2), for which WinNonlin/Phoenix was used. The insulin and glucose concentrations were also used to calculate the homeostatic model assessment insulin resistance (HOMA‐IR) score, which is used to quantify insulin resistance [HOMA‐IR = (glucose × insulin)/22.5].
Statistical analysis
The AUC0–12 values of metformin for treatments A and B were compared using the bioequivalence approach, which is recommended by the European Medicines Agency (EMA) to evaluate PK drug interactions 24. GMRs with 90% CIs of AUC0–12, Cmax and C12 were calculated for metformin, comparing treatment B and treatment A. We used a linear mixed‐effect model with fixed parameters to calculate the GMR with 90% CI. Fixed parameters were treatment, period, sequence and subjects within sequence according to EMA guidelines 24.
For bioequivalence between treatments A and B, the AUC0–12 GMR with 90% CI should fall within the range of 80–125%.
Based on a previously observed intersubject coefficient of variation (CV%) of 22% for metformin AUC0–12 25, we expected the intrasubject CV% to be lower: 15%. For the sample‐size calculation, we used a power calculation in SAS® (SAS Institute Inc. 2011. Cary, NC, USA) using a paired t‐test for lognormal distribution for showing equivalence. For 80% power to prove bioequivalence, a sample size of 17 subjects should be included in the study. To account for possible dropouts, 20 subjects were to be included.
Metformin renal clearance was log‐transformed and compared between treatments using a paired t‐test.
Glucose, lactate and insulin AUC0–2 values were log‐transformed and compared between treatments using a paired t‐test. All statistical analyses were performed in IBM SPSS Statistics (IBM Corp. Released 2013. IBM SPSS Statistics for Windows, Version 22.0. Armonk, NY: IBM Corp).
Safety and tolerability
During all study visits, AEs and laboratory safety (biochemistry and haematology) were monitored by the study nurses and physicians. AEs were graded using the Division of AIDS Table for Grading the Severity of Adult and Pediatric Adverse Events (‘DAIDS AE Grading Table’); version 1.0, December 2004, clarification August 2009 26).
Ethics
The trial was approved by the Investigational Review Board of Radboud university medical center, Nijmegen, the Netherlands. The trial was conducted in accordance with Good Clinical Practice and the Declaration of Helsinki and registered at ClinicalTrials.gov (NCT02565862). All participants signed informed consent forms before screening evaluations.
Results
Baseline characteristics
Twenty subjects (nine male) were enrolled, and all subjects completed the study. All subjects were white; their median (range) age was 47.5 (20–55) years and the median (range) BMI was 26.6 (22.9–36.0) kg m–2. The subjects were in normal health, based on medical history, physical examination, vital signs, and biochemical and haematological data.
In general, adherence to the study medication was good, as proven by pill count, monitoring of the MEMS caps and registration in the diary. Two subjects took a double dose of daclatasvir, and three subjects forgot one or two tablets of 500 mg metformin. These deviations did not lead to exclusion of any of the study participants.
PK of metformin and daclatasvir
Steady‐state geometric mean (GM) concentration–time curves of metformin are shown in Figure 1A and the PK parameters are shown in Table 1. One subject vomited during treatment A; therefore, the results of 19 subjects are presented. The GMR with 90% CI of the metformin AUC0–12, Cmax and C12 of metformin with and without daclatasvir (B vs. A) were 109% (102–116%), 108% (101–116%) and 112% (103–122%), respectively. As the CIs of all parameters fell within the range 80–125%, absence of an interaction was confirmed.
Figure 1.
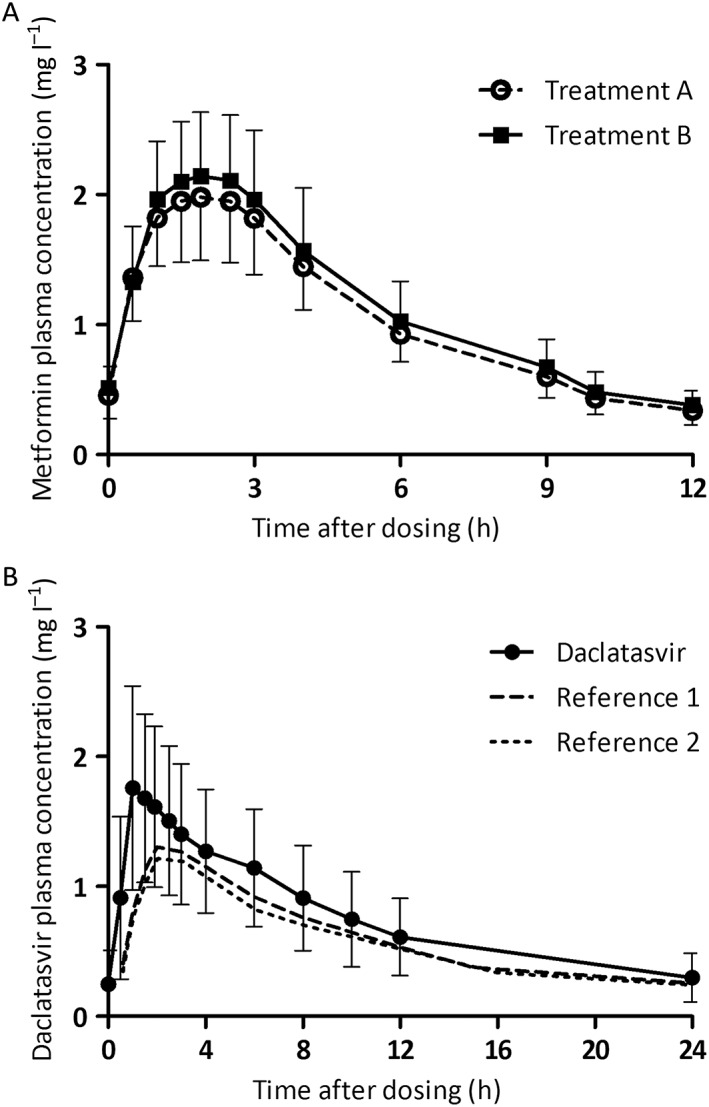
Pharmacokinetic curves of metformin for both treatments (A). Pharmacokinetic curve of daclatasvir (and reference) (B). Data shown are geometric means with geometric coefficient of variation. Reference curves for daclatasvir were adapted from Gandhi et al. 27. Treatment A: data from 19 subjects were used. Treatment B: data from 20 subjects were used
Table 1.
Steady‐state pharmacokinetic parameters of metformin (n = 19) and daclatasvir (n = 20). Geometric means are presented with geometric coefficient of variation. Also shown are geometric mean ratios of treatment B (with daclatasvir) vs. treatment A (without daclatasvir)
| Metformin | Treatment A (n = 19a) | Treatment B (n = 20) | GMR, % (90% CI) |
|---|---|---|---|
| AUC 0–12 (h . mg l –1 ) | 12.41 (22) | 13.54 (25) | 109 (102, 116) |
| C max (mg l –1 ) | 2.06 (23) | 2.23 (23) | 108 (101, 116) |
| C 12 (mg l –1 ) | 0.34 (32) | 0.38 (29) | 112 (103, 122) |
| T max (h) b | 1.9 (1–2.5) | 1.9 (1–3.0) | – |
| T 1/2 (h) c | 4.77 (19) | 4.86 (22) | – |
| Daclatasvir | Treatment B | Reference d | |
|---|---|---|---|
| AUC 0–24 (h . mg l –1 ) | 18.38 (44) | 12.7 (41); 13.8 (26) | |
| C max (mg l –1 ) | 1.85 (40) | 1.34 (38); 1.41 (28) | |
| C 24 (mg l –1 ) | 0.30 (63) | 0.225 (54); 0.225 (36) | |
| T max (h) a | 1 (1–2.5) | 2.0 (1.0; 6.0) | |
| T 1/2 (h) b | 11.23 (23) | – |
For treatment A, 19 subjects were used for the pharmacokinetic analysis as one subject vomited during treatment
Values presented are medians (range)
The apparent T1/2 is calculated
The reference values from Gandhi et al. are presented 27
AUC0–12, area under the time curve from 0 h to 12 h; AUC0–24, area under the time curve from 0 h to 24 h; C12, 12‐h plasma concentration; C24, 24‐h plasma concentration; CI, confidence interval; Cmax, maximum plasma concentration; GMR, geometric mean ratio; T1/2, elimination half‐life; Tmax, time to reach Cmax
Urine was collected to estimate renal metformin clearance. Treatment B included 19 subjects because urine was not correctly stored for one subject. The GM (range) renal clearance of metformin for treatment A was 351 (148–646) ml min–1 and for treatment B was 333 (166–537) ml min–1 (P = 0.504). The GM (range) for metformin secretion during treatments A and B was 275 (25–538) ml min–1 and 269 (91–445) ml min–1 (P = 0.3822), respectively. The GMR (95% CI) for metformin secretion (B vs. A) was 98% (70–137%) and 98% (95–101%), respectively, for eGFR (Figure 2).
Figure 2.

The 12‐h metformin secretion during treatments A and B shown per patient. The urine of one subject was discarded during the trial; therefore, the metformin secretion of 19 subjects is shown
The GM concentration–time curve of daclatasvir and PK parameters are shown in Figure 1B and Table 1, respectively, combined with references values 27. The GMs with geometric coefficient of variation (GCV%) AUC0–24, Cmax and C24 values of daclatasvir were 18.38 (44) h.mg l–1, 1.85 (40) mg l–1 and 0.30 (63) mg l–1, respectively.
PD of metformin
The OGTT was used to study PD endpoints (insulin, lactate, glucose). Treatment A contained data from 19 subjects as one subject was not able to tolerate the glucose drink during treatment A. The subject vomited and was excluded from the analysis.
The GM (GCV%) for AUC0–2 for insulin for treatments A and B were 86 (49) h.mE l–1and 87 (54) h.mE l–1, respectively (P = 0.430). The glucose and lactate GM (GCV%) AUC0–2 values during treatments A and B were 13.7 (10) h.mmol l–1 and 13.4 (14) h.mmol l–1, and 3.4 (15) h.mmol l–1 and 3.4 (18) h.mmol l–1, respectively (P = 0.919; P = 0.779, respectively) (Figure 3). In Figure 4, we show the AUC0–2 ratios (treatment B/treatment A) per subject for glucose, insulin and lactate.
Figure 3.

Results of the pharmacodynamic analysis. Glucose (A), insulin (B) and lactate (C) area under the concentration–time curves from 0 h to 2 h are shown. Presented values are geometric means with geometric coefficients of variation (n = 19)
Figure 4.

Ratios for treatment B/treatment A shown per subject for metformin area under the concentration–time curves from 0 h to 12 h, metformin maximum plasma concentration, metformin 12‐h plasma concentration, all open circles. In addition, the closed circles show the ratio for treatment b/treatment A per subject for the glucose area under the time curves from 0 h to 2 h (AUC0–2), insulin AUC0–2 and lactate AUC0–2. One subject did not tolerate the oral glucose tolerance test during treatment A; therefore, the ratio of 19 subjects is shown for glucose, insulin and lactate. AUC0–12, area under the time curve from 0 h to 12 h; Cmax, maximum plasma concentration; C12, 12‐h plasma concentration; AUC0–2, area under the time curve from 0 h to 2 h
The HOMA‐IR score was calculated for the individual subjects (treatments A and B), showing the variation in insulin resistance in the study population. The HOMA‐IR varied from 0.73 to 4.81 during treatment A and 0.94 to 4.19 during treatment B.
Safety and tolerability
A total of 129 AEs were reported during the trial, varying from three to 11 AEs per subject. No serious adverse events (SAEs) were reported. Only one AE was graded as grade 3 (elevated amylase). The majority of the AEs were ‘probably’ related to the use of study medication (55%) and were reported during the combined treatment of metformin and daclatasvir (59%). Six AEs (four subjects) were reported directly after the intake of the study medication.
The most commonly reported AEs were diarrhoea (n = 26), stomach ache/stomach cramps (n = 15), nausea (n = 11), headache (n = 10) and fatigue (n = 9). The gastrointestinal AEs were most likely caused by metformin. Subjects recovered from all AEs after the end of treatment. AEs reported (≥5%) per treatment are shown in Table 2.
Table 2.
Adverse events (AEs) reported during the trial, per treatment. Only AEs that were reported ≥5.0% are shown
| Treatment A (Total number AEs: 53) | Treatment B (Total number AEs: 76) | |||||
|---|---|---|---|---|---|---|
| Subjects, n | AEs, n | AEs, % | Subjects, n | AEs, n | AEs, % | |
| Diarrhoea | 10 | 11 | 21 | 12 | 15 | 20 |
| Fatigue | 5 | 5 | 9 | 4 | 4 | 5 |
| Stomach ache/cramps | 5 | 5 | 9 | 6 | 10 | 13 |
| Nausea | 4 | 4 | 8 | 5 | 7 | 9 |
| Sore throat | 3 | 3 | 6 | |||
| Vomiting | 2 | 3 | 6 | 2 | 2 | 3 |
| Common cold | 3 | 3 | 6 | |||
| Headache | 2 | 2 | 4 | 7 | 8 | 11 |
Treatment A: 100 mg metformin twice daily; treatment B: 1000 mg metformin twice daily and 60 mg daclatasvir once daily. Toxicity grades were judged by the trial physician and graded using the Division of AIDS Table for Grading the Severity of Adult and Pediatric Adverse Events (DAIDS AE Grading Table 26
Discussion
We studied the potential interaction between the NS5A inhibitor daclatasvir and the biguanide metformin in healthy volunteers. We hypothesized that the exposure to metformin could possibly be increased owing to OCT1 and/or OCT2 inhibition by daclatasvir, with altered glucose plasma concentrations as a result.
The results of the PK analysis did not support this hypothesis: no interaction was observed when metformin was administered with daclatasvir. In addition, there was no difference in metformin renal secretion between treatments. Therefore, we concluded that daclatasvir does not affect systemic exposure to metformin. Similarly, the PD analysis showed no difference between treatments, so we concluded that there was no PD interaction between daclatasvir and metformin.
The apparent absence of an effect of daclatasvir on metformin PK was confirmed by in vitro studies that we carried out later. Comparing the maximum therapeutic concentration of daclatasvir (Cmax) of 1.85 mg l–1 found in the present study with the reported half‐maximum inhibitory concentration (IC50) showed that the in vivo unbound Cmax was indeed lower than the in vitro data, as daclatasvir is highly bound to plasma proteins (99%). The IC50 of daclatasvir for OCT2 was found to be 7.3 μM 28 and for OCT1 was 1.4 μM 29, representing plasma concentrations of ~5.4 mg l–1 and ~1.0 mg l–1, respectively, of unbound daclatasvir. We should note that, at the site of action (intestine, hepatocyte), the daclatasvir concentration might be different to the Cmax used, as the latter is the plasma concentration after systemic absorption. Daclatasvir concentrations might be higher in the intestine and portal vein, possibly inhibiting OCTs. This might be an explanation for the statistically significantly increased metformin plasma concentration when combined with daclatasvir (GMR and CI >100%). We argue that this increase is not clinically relevant for patients with normal metformin clearance but it might be clinically relevant in special populations with reduced metformin clearance, such as patients with renal impairment.
In daily practice, metformin is administered with food. In the present trial, we deviated from this recommendation, as subjects had to fast overnight for the execution of the OGTT. The systemic exposure of metformin is decreased in a fed state (Cmax: 40%; AUC: 25%) 30. In our study, Cmax and AUC were elevated when compared with a previous study in healthy volunteers where metformin was taken with food: Cmax 1.32 mg l–1 and AUC0–24 20.5 h.mg l–1 31. The high number of metformin‐related AEs could be explained by these increased metformin exposures. Intake of metformin without food might cause additional AEs 30.
We used an OGTT to study the PD effect of metformin on glucose regulation with and without daclatasvir. The OGTT was conducted because the PK drug interaction was only clinically relevant when the glucose regulation (PD) was also altered. In addition, we did not want to exclude the possibility that there was a PD effect without a PK effect. In the present study, we showed that both PK and PD were related, as neither the systemic metformin concentrations nor OGTT results were affected by daclatasvir. The relationship between the OGTT and metformin PD was shown previously in healthy volunteers, but the blood glucose levels were not found to be altered 21, 32, 33.
Daclatasvir PK was studied only in treatment group B, in the presence of metformin; therefore, the PK of daclatasvir was compared with values in the literature (Table 2). Daclatasvir was not studied separately, as metformin was thought not to influence any drug‐metabolizing enzymes or transporters, and therefore we did not expect metformin to influence daclatasvir PK 34. Daclatasvir exposure was increased compared with reference values, as shown in Figure 1B 27. In our study, subjects took daclatasvir while fasted, whereas daclatasvir was taken with food in the reference study. This might be an explanation for the elevated daclatasvir plasma concentrations because food decreases daclatasvir AUC by 23%, and Cmax by 28% 23. However, daclatasvir plasma concentrations were somewhat higher than we would expect based on the food effect alone. Daclatasvir PK is increased solely by CYP3A4 and/or P‐gp inhibitors, and metformin is neither of these. It could be that metformin induces other unidentified drug transporters or drug‐metabolizing enzymes that contribute to the metabolism or distribution of daclatasvir 35. Another explanation could be that the fasted healthy volunteers in our study had better absorption of daclatasvir, possibly caused by a more acidic gastric pH, increasing the solubility of daclatasvir.
No unexpected AEs or SAEs were reported in the present study. The study medication was well tolerated overall; however, almost all subjects reported diarrhoea and/or stomach ache/cramps, which were related to the use of metformin. One subject did not tolerate the glucose solution but, overall, the OGTT was well tolerated by the fasted participants. However, we should point out that the number of AEs was 76 with combined treatment of daclatasvir and metformin, vs. 53 when metformin was given alone. This might have been caused by the relatively high daclatasvir plasma concentrations combined with the small increase in metformin plasma concentrations. Therefore, our recommendation is that daclatasvir and metformin can be combined, although we recommend that physicians monitor for (altered) AEs during treatment.
The limitations of our study were that daclatasvir PK was not studied separately and that we included healthy, white subjects who might not completely have reflected the HCV/T2DM patient population that will use these drugs. Therefore, we included subjects with a wide range of age, BMI and insulin resistance (HOMA‐IR).
We did not determine OCT genotypes because all the PK curves for the subjects were in the same concentration range; we observed a low intersubject variability for metformin; and the sample size was limited.
In conclusion, the establishment of bioequivalence in the present study showed that daclatasvir did not influence the PK of metformin in healthy subjects. PD parameters were also comparable between treatments. An increased number of AEs was reported when daclatasvir was combined with metformin; however, no unexpected AEs were reported. We recommend monitoring for altered AEs during treatment when daclatasvir and metformin are combined in HCV‐infected patients with T2DM.
Competing Interests
E.J.S., A.C., C.T.M.M.deK., K.V.‐G., L.T.W., N.v.E.‐B.K., J.P.H.D., R.E.A. and C.J.T. declare that they have no conflicts of interest that are directly relevant to the content of this manuscript. D.M.B. is a member of advisory boards of AbbVie, Bristol‐Myers Squibb, Gilead, Janssen, Merck and ViiV Healthcare. He has received sponsorship and research grants from Bristol‐Myers Squibb, Janssen, Merck and ViiV Healthcare. However, this did not influence the content of this manuscript.
The authors thank the healthy volunteers for their participation in this trial, the study personnel at the Clinical Research Centre Nijmegen, Radboud university medical center, Nijmegen, the Netherlands, for conducting the study. They also thank the laboratory personnel of the Department of Pharmacy, Radboud university medical center, Nijmegen, the Netherlands, for development of the analytical methods and sample analysis, and L. H. te Brake, Radboud university medical center, Nijmegen, the Netherlands, for her support with preparation of the study protocol and manuscript. This project was funded by Bristol‐Myers Squibb Pharma EEIG .
Contributors
E.J.S. designed and executed the trial, analysed the data and prepared the manuscript. A.C. designed the trial, analysed the data, prepared the manuscript and supervised the study. C.T.M.M.K. critically revised the manuscript. K.V.‐G. developed and validated the bio‐analytical method for daclatasvir and supervised the sample analysis. L.T.W. carried out sample analysis for daclatasvir and metformin. N.E.‐B.K. developed and validated the bio‐analytical method for metformin and supervised sample analysis. J.P.H.D. critically revised the manuscript. R.E.A. critically revised the manuscript. C.J.T. designed the trial, critically revised the manuscript and interpreted the results. D.M.B. designed the trial, interpreted the results, critically revised the manuscript and supervised the study.
Smolders, E. J. , Colbers, A. , de Kanter, C. T. M. M. , Velthoven‐Graafland, K. , Wolberink, L. T. , van Ewijk‐Beneken Kolmer, N. , Drenth, J. P. H. , Aarnoutse, R. E. , Tack, C. J. , and Burger, D. M. (2017) Metformin and daclatasvir: absence of a pharmacokinetic–pharmacodynamic drug interaction in healthy volunteers. Br J Clin Pharmacol, 83: 2225–2234. doi: 10.1111/bcp.13323.
References
- 1. Southan C, Sharman JL, Benson HE, Faccenda E, Pawson AJ, Alexander SP, et al. The IUPHAR/BPS Guide to PHARMACOLOGY in 2016: towards curated quantitative interactions between 1300 protein targets and 6000 ligands. Nucleic Acids Res 2016; 44: D1054–D1068. [DOI] [PMC free article] [PubMed] [Google Scholar]
- 2. Alexander SP, Fabbro D, Kelly E, Marrion N, Peters JA, Benson HE, et al. The concise guide to PHARMACOLOGY 2015/16: Enzymes. Br J Pharmacol 2015; 172: 6024–6109. [DOI] [PMC free article] [PubMed] [Google Scholar]
- 3. Alexander SP, Kelly E, Marrion N, Peters JA, Benson HE, Faccenda E, et al. The concise guide to PHARMACOLOGY 2015/16: Transporters. Br J Pharmacol 2015; 172: 6110–6202. [DOI] [PMC free article] [PubMed] [Google Scholar]
- 4. Hammerstad SS, Grock SF, Lee HJ, Hasham A, Sundaram N, Tomer Y. Diabetes and hepatitis C: a two‐way association. Front Endocrinol (Lausanne) 2015; 6: 134. [DOI] [PMC free article] [PubMed] [Google Scholar]
- 5. World Health Organization . Global report on diabetes: executive summary. Available at http://www.who.int/diabetes/global-report/en/ (last accessed 23 May 2017).
- 6. World Health Organization . Hepatitis C: WHO fact sheet No. 164. 2014. Available at http://www.who.int/mediacentre/factsheets/fs164/en/ (last accessed 15 May 2016).
- 7. Lauer GM, Walker BD. Hepatitis C virus infection. N Engl J Med 2001; 345: 41–52. [DOI] [PubMed] [Google Scholar]
- 8. Zimmet P, Alberti KG, Shaw J. Global and societal implications of the diabetes epidemic. Nature 2001; 414: 782–787. [DOI] [PubMed] [Google Scholar]
- 9. Badar S, Khubaib B, Idrees M, Hussain A, Awan Z, Butt S, et al. Association of hepatitis C virus with insulin resistance: evidences from animal studies and clinical studies. Hep Month 2012; 12: 11–15. [PMC free article] [PubMed] [Google Scholar]
- 10. Torres DM, Harrison SA. Hepatitis C virus and insulin resistance/diabetes mellitus. Gastroenterol Hepatol (N Y) 2008; 4: 568–570. [PMC free article] [PubMed] [Google Scholar]
- 11. Antonelli A, Ferrari SM, Giuggioli D, Di Domenicantonio A, Ruffilli I, Corrado A, et al. Hepatitis C virus infection and type 1 and type 2 diabetes mellitus. World J Diabetes 2014; 5: 586–600. [DOI] [PMC free article] [PubMed] [Google Scholar]
- 12. Hui JM, Sud A, Farrell GC, Bandara P, Byth K, Kench JG, et al. Insulin resistance is associated with chronic hepatitis C and virus infection fibrosis progression. Gastroenterology 2003; 125: 1695–1704. [DOI] [PubMed] [Google Scholar]
- 13. Arase Y, Suzuki F, Suzuki Y, Akuta N, Kobayashi M, Kawamura Y, et al. Sustained virological response reduces incidence of onset of type 2 diabetes in chronic hepatitis C. Hepatology 2009; 49: 739–744. [DOI] [PubMed] [Google Scholar]
- 14. Gong L, Goswami S, Giacomini KM, Altman RB, Klein TE. Metformin pathways: pharmacokinetics and pharmacodynamics. Pharmacogenet Genomics 2012; 22: 820–827. [DOI] [PMC free article] [PubMed] [Google Scholar]
- 15. Muller J, Lips KS, Metzner L, Neubert RH, Koepsell H, Brandsch M. Drug specificity and intestinal membrane localization of human organic cation transporters (OCT). Biochem Pharmacol 2005; 70: 1851–1860. [DOI] [PubMed] [Google Scholar]
- 16. Wang L, Weinshilboum R. Metformin pharmacogenomics: biomarkers to mechanisms. Diabetes 2014; 63: 2609–2610. [DOI] [PMC free article] [PubMed] [Google Scholar]
- 17. Tzvetkov MV, Vormfelde SV, Balen D, Meineke I, Schmidt T, Sehrt D, et al. The effects of genetic polymorphisms in the organic cation transporters OCT1, OCT2, and OCT3 on the renal clearance of metformin. Clin Pharmacol Ther 2009; 86: 299–306. [DOI] [PubMed] [Google Scholar]
- 18. Xia L, Engel K, Zhou M, Wang J. Membrane localization and pH‐dependent transport of a newly cloned organic cation transporter (PMAT) in kidney cells. Am J Physiol Renal Physiol 2007; 292: F682–F690. [DOI] [PMC free article] [PubMed] [Google Scholar]
- 19. Tucker GT, Casey C, Phillips PJ, Connor H, Ward JD, Woods HF. Metformin kinetics in healthy subjects and in patients with diabetes mellitus. Br J Clin Pharmacol 1981; 12: 235–246. [DOI] [PMC free article] [PubMed] [Google Scholar]
- 20. Zong J, Borland J, Jerva F, Wynne B, Choukour M, Song I. The effect of dolutegravir on the pharmacokinetics of metformin in healthy subjects. J Int AIDS Soc 2014; 17: 19584. [DOI] [PMC free article] [PubMed] [Google Scholar]
- 21. Cho SK, Yoon JS, Lee MG, Lee DH, Lim LA, Park K, et al. Rifampin enhances the glucose‐lowering effect of metformin and increases OCT1 mRNA levels in healthy participants. Clin Pharmacol Ther 2011; 89: 416–421. [DOI] [PubMed] [Google Scholar]
- 22. EMA . Daklinza: Summary of product characteristics. 2015. Available at http://www.ema.europa.eu/docs/en_GB/document_library/EPAR_‐_Product_Information/human/003768/WC500172848.pdf (last accessed 15 February 2015).
- 23. EMA . Daklinza product information. 2014. Available at http://www.ema.europa.eu/docs/en_GB/document_library/EPAR_‐_Product_Information/human/003768/WC500172848.pdf (last accessed 29 February 2016).
- 24. EMA . Guideline on the investigation of bioequivalence. 2010. Available at http://www.emea.europa.eu/docs/en_GB/document_library/Scientific_guideline/2010/01/WC500070039.pdf (last accessed 25 May 2017).
- 25. Najib N, Idkaidek N, Beshtawi M, Bader M, Admour I, Alam SM, et al. Bioequivalence evaluation of two brands of metformin 500 mg tablets (Dialon & Glucophage)‐– in healthy human volunteers. Biopharm Drug Dispos 2002; 23: 301–306. [DOI] [PubMed] [Google Scholar]
- 26. Division of AIDS National Insititue of Allergy and Infectious Diseases, National Insituties of Healh, US department of health and Human services . Division of AIDS table for grading the severity of adult and pediatric adverse events; version 1.0. December, 2004.
- 27. Gandhi Y, Adamczyk R, Wang R, Stonier M, Kandoussi H, Hesney M , et al. Assessment of drug–drug interactions between daclatasvir and darunavir/ritonavir or lopinavir/ritonavir [abstract 80]. In: 16th International Workshop on Clinical Pharmacology of HIV and Hepatitis Therapy Washington, DC, 2015.
- 28. FDA . Daklinza: clinical pharmacology and biopharmaceutics review(s). 2015. Available at http://www.accessdata.fda.gov/drugsatfda_docs/nda/2016/206843Orig1s001,s003ClinPharmR.pdf (last accessed 1 June 2016).
- 29. Ministry of Health LaWJ . Daklinza tablets 60 mg. 2014. Available at https://www.pmda.go.jp/files/000209021.pdf (last accessed 14 September 2016).
- 30. EMA . Metformin Actavis: product information. 2013. Available at http://www.medicines.org.uk/emc/medicine/23244/SPC (last accessed 23 May 2016).
- 31. Timmins P, Donahue S, Meeker J, Marathe P. Steady‐state pharmacokinetics of a novel extended‐release metformin formulation. Clin Pharmacokinet 2005; 44: 721–729. [DOI] [PubMed] [Google Scholar]
- 32. Cho SK, Kim CO, Park ES, Chung J‐Y. Verapamil decreases the glucose‐lowering effect of metformin in healthy volunteers. Br J Clin Pharmacol 2014; 78: 1426–1432. [DOI] [PMC free article] [PubMed] [Google Scholar]
- 33. Stage TB, Pedersen RS, Damkier P, Christensen MMH, Feddersen S, Larsen JT, et al. Intake of St John's wort improves the glucose tolerance in healthy subjects who ingest metformin compared with metformin alone. Br J Clin Pharmacol 2015; 79: 298–306. [DOI] [PMC free article] [PubMed] [Google Scholar]
- 34. Stage TB, Brosen K, Christensen MM. A comprehensive review of drug‐drug interactions with metformin. Clin Pharmacokinet 2015; 54: 811–824. [DOI] [PubMed] [Google Scholar]
- 35. Stopfer P, Giessmann T, Hohl K, Sharma A, Ishiguro N, Taub ME, et al. Pharmacokinetic evaluation of a drug transporter cocktail consisting of digoxin, furosemide, metformin, and rosuvastatin. Clin Pharmacol Ther 2016; 100: 259–267. [DOI] [PMC free article] [PubMed] [Google Scholar]