Abstract
Atmospheric aerosol particles (especially particles with aerodynamic diameters equal to or less than 2.5 μm, called PM2.5) can affect the surface energy balance and atmospheric heating rates and thus may impact the intensity of urban heat islands. In this paper, the effect of fine particles on the urban heat island intensity in Nanjing was investigated via the analysis of observational data and numerical modelling. The observations showed that higher PM2.5 concentrations over the urban area corresponded to lower urban heat island (UHI) intensities, especially during the day. Under heavily polluted conditions, the UHI intensity was reduced by up to 1 K. The numerical simulation results confirmed the weakening of the UHI intensity due to PM2.5 via the higher PM2.5 concentrations present in the urban region than those in the suburban areas. The effects of the fine particles on the UHI reduction were limited to the lowest 500–1000 m. The daily range of the surface air temperature was also reduced by up to 1.1 K due to the particles’ radiative effects. In summary, PM2.5 noticeably impacts UHI intensity, which should be considered in future studies on air pollution and urban climates.
Introduction
The term urban heat island (UHI) refers to the increased surface temperatures in urban centres compared to those of their suburban surroundings. The phenomenon was first observed in London1 and was named by Manley2. The UHI phenomenon is a result of the differences in the surface roughnesses, surface albedos, anthropogenic activities and building densities between an urban centre and its suburban surroundings3–5, which cause differences in the local boundary layer characteristics and the underlying surface energy balance6, 7. For example, during the day, urban centres experience sensible heat convection efficiency reductions because urban areas are aerodynamically smoother than their surrounding suburban regions8. As such, the local UHI effect is distinct from large-scale global warming trends9–11.
The approaches for quantifying a UHI phenomenon include in situ observations9, 12, 13 and remote sensing4 as well as numerical modelling6, all of which typically compare a climate indicator, such as the surface air temperature, between a location representing an urban environment and another location representing a suburban environment. Previous studies found that UHIs are more pronounced at night than during the day and are larger in the winter than in the summer14.
Several studies have recognized the impacts of UHIs on local meteorology and air quality. Differential heating produces mesoscale winds, which help pollutants circulate and move upward, leading to air pollution issues in urban areas15. Thus, UHIs also have significant effects on pollutant concentrations, such as those of ozone and particles, due to their feedbacks on boundary layer stability, which decreases the intensity of vertical mixing16–18.
Urban centres are also the dominant sources of fine particles, which have important impacts on boundary layer development via their reduction of the amount of solar radiation reaching the earth surface. This reduction affects the surface radiation balance, leading to a decrease in the surface temperature19, 20. Numerical models have been used to quantify the radiative effects of aerosol particles. For example, the regional chemistry climate model COSMO-ART has been used in aerosol-climate studies over Europe21. This study found a correlation between the aerosol optical depths and changes in regional temperatures. Im et al.22 concluded that small differences in summer PM2.5 levels can cause changes in temperature of 1.5–4.5 K. The chemical speciation of PM2.5 matters in this context as it determines whether the particles only scatter light or also absorb light; sulfate aerosols have a strong cooling effect due to their scattering characteristics, which cause the surface temperatures to decrease as sulfate concentrations increase23–25. In contrast, the presence of black carbon may reduce the aerosol cooling effect since this particle is the main absorbing component in anthropogenic aerosols26. A large black carbon column burden was found to decrease the surface temperature by nearly 2 K in eastern China while warming the atmosphere at the top of the boundary layer27.
Although many investigations of fine particles’ radiative forcing and climate effects exist, only a few studies have focused on the impacts of fine particles on UHIs. The radiative forcings of fine particles are different in urban and suburban regions due to the inherently different PM2.5 loads28, thus causing differences in the surface temperature cooling effects. Our previous study showed that the UHI intensity was weakened by 0.1–0.2 K during the day due to the impacts of fine particles, based on the surface energy balance equation29. However, Chang et al.30 reported that the night-time UHI can be intensified due to increased incoming long-wave radiation, based on remote sensing temperature data from 39 cities in China.
This study uses one-year surface observations of PM2.5 concentrations and temperatures as well as numerical modelling to investigate how UHIs could be affected by fine particles, taking Nanjing, a mega city with spreading urbanization located in the Yangtze River Delta of China, as the target city.
Methodology
Observational data
The study period spanned from 1st January to 31st December, 2011. The hourly surface temperature data were collected from the Nanjing Meteorological Bureau, and the hourly PM2.5 concentration data came from the Nanjing Environmental Monitoring Center. The urban station is Beijige (118°48′37″ E, 31°59′59″N), while Pukou (118°36′7″E, 31°24′5″N) was selected as the suburban station. The Pukou station is situated in western Nanjing and is not influenced by mountains or the ocean. PM2.5 was not widely observed in China before 2013. In 2011 in Nanjing, only one urban site produced PM2.5 observations, and no suburban sites made PM2.5 observations.
However, in 2014, PM2.5 observations were available at both the urban site of Xinjiekou (118°47′26″E, 32°2′51″N) and the suburban site of Longtan (119°11′48″E, 32°11′58″N), both of which were used for the model experiments and have collocated surface temperature observation sites. We used these data to analyse the relationship between UHI intensities and the PM2.5 concentration differences between the urban and suburban sites.
Numerical experiments
An online modelling system, the Weather Research and Forecasting (WRF) Model, coupled with Chemistry Version 3.5.131, 32, was used to investigate the influences of fine particles on UHIs. The model system WRF-Chem uses a non-hydrostatic dynamical core and includes emissions of gas phase species and aerosols, gas phase chemical transformations, photolysis, aerosol chemistry and dynamics (including inorganic and organic aerosols) and the removal of gas phases and aerosol species by wet and dry deposition.
The physics scheme in this study was PBL with YSU33. The shortwave radiation parameterization was from NASA Goddard34, and the longwave parameterization was RRTM35. The chemical mechanism was RADM2 (Second Generation Regional Acid Deposition Model; Stockwell et al.36) with 158 reactions among the gas phases of 36 species. The MADE/SORGAM (Modal Aerosol Dynamics Model for Europe/Secondary Organic Aerosol Model; Ackermann et al.37; Schell et al.38) was used for the secondary inorganic and organic aerosols. The emission module included biogenic and anthropogenic contributions. Biogenic emissions were calculated online using Guenther’s scheme39, 40. Anthropogenic emissions were supplied from an offline resource, based on the work of MEIC (Multi-resolution Emission Inventory for China, http://www.meicmodel.org/dataset-meic.html), which included the species SO2, NOX, CO, NH3, NMVOC, PM2.5, PM10, BC, OC and CO2.
The model was configured with four one-way nested domains using grid resolutions of 81 km, 27 km, 9 km, and 3 km. The initial meteorological fields and boundary conditions were from the NCEP global reanalysis dataset with a 1° × 1° resolution.
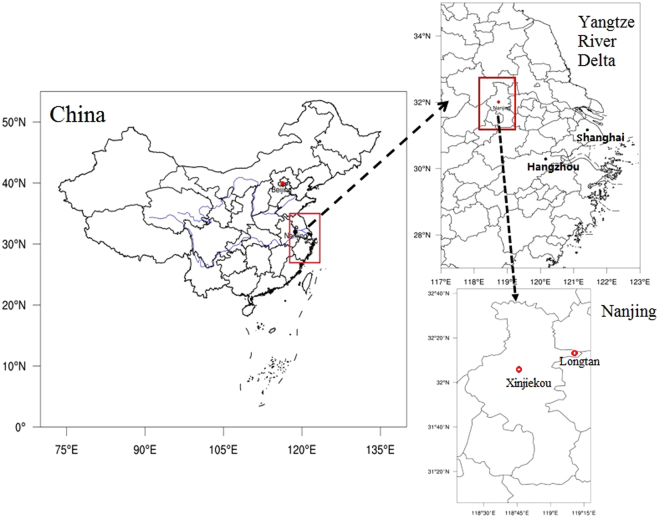
In the numerical experiments, Xinjiekou (118°47′26″E, 32°2′51″N) was chosen as the urban point, as shown in Fig. 1. Xinjiekou is in the central district of Nanjing, close to Beijige, and has no heavy industrial emission sources within 30 km. However, the station is close to major roads with heavy traffic and a large population aggregation. The suburban point is located in Longtan (119°11′48″E, 32°11′58″N), in an eastern district of Nanjing, nearly 40 km away from the city centre of Xinjiekou. Longtan is surrounded by crop fields and inhabited by a small population, similar to Pukou.
Figure 1.
Locations of the urban station (Xinjiekou) and the suburban station (Longtan) in Nanjing, China. The maps were generated using the NCAR Command Language (Version 6.2.0., https://www.ncl.ucar.edu, 2014).
To investigate the impact of fine particles on UHI intensities, two sets of numerical experiments were performed for January (winter), April (spring), July (summer) and October (fall), 2011. In the first experiment, the direct and indirect effects of aerosols were disabled. The second experiment included the direct and indirect effects of aerosols. Therefore, the differences of the UHI intensities of the two experiments quantify the effects of PM2.5 on the UHI.
In the following sections, the term surface UHI intensity, T UHI, refers to the difference in the surface temperatures at the urban and suburban stations. The larger T UHI is, the more intense the UHI effect. When investigating the PM2.5 effect on UHI intensity, we define ∆T UHI (the difference in T UHI between the simulations with and without the PM2.5 radiation effect) as the change in the UHI intensity due to the PM2.5. A negative value of ∆T UHI means that the UHI intensity is weakened by the presence of PM2.5. We use the variable ∆T to represent the surface temperature changes including and excluding the PM2.5 effect, with negative values of ∆T representing a lower surface temperature when PM2.5 is present. The daily temperature range difference due to PM2.5 is denoted by ∆T dr.
Data availability
The data that support the findings of this study are available from the corresponding author upon reasonable request.
Results
Observed PM2.5 effects on the UHI
Hourly surface air temperature data at the urban and suburban sites in Nanjing were used to estimate the hourly UHI intensities, T UHI. To quantify the fine particles’ effects on UHI intensities, we classified the hourly values of the UHI intensities into three groups according to the observed PM2.5 concentrations in the urban area, representing light (PM2.5 concentrations less than 35 μg/m3), medium (PM2.5 concentrations greater than or equal to 35 μg/m3 and less than or equal to 75 μg/m3) and heavy pollution (PM2.5 concentrations greater than 75 μg/m3).
Figure 2a compares the diurnal cycles of the T UHI of the three pollution levels. The light and medium pollution levels show similar characteristics, with maximum values occurring during the afternoons (1.3 K and 1.1 K for light and medium pollution levels, respectively), and minimum values occurring at night (0.3 K and −0.1 K for light and medium pollution levels, respectively). As the pollution levels increase from light to medium, the UHI intensity decreases for all hours during the day by an average of 0.2 K.
Figure 2.
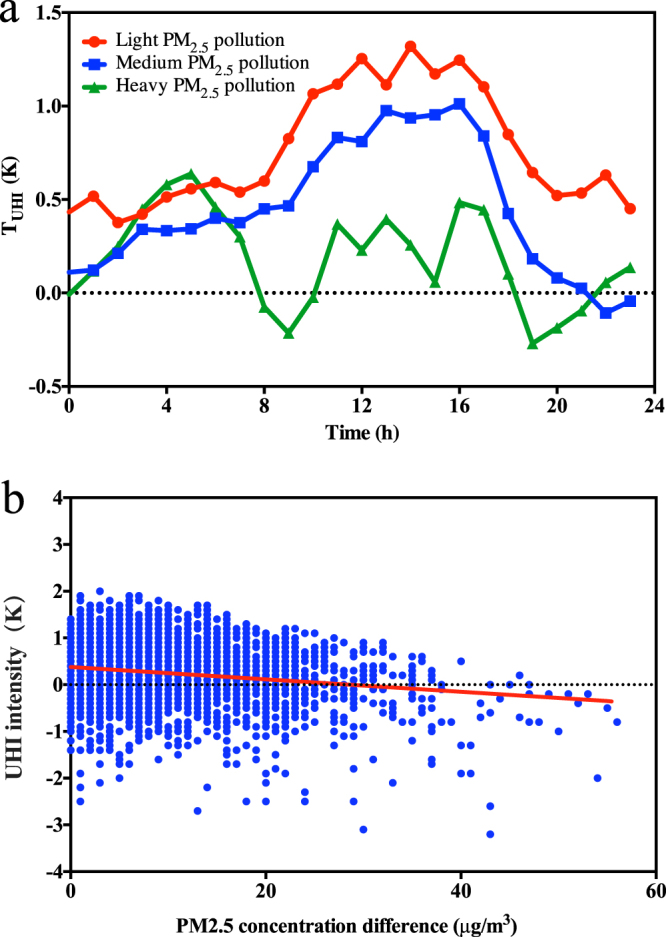
Observed correlations of UHI intensities and PM2.5 concentration differences between the urban centre and the suburban station. (a) Observed diurnal variations of UHI intensities for different PM2.5 levels in Nanjing, 2011. Red, blue and green lines indicate the UHI intensities with light pollution (PM2.5 < 35 μg/m3), medium pollution (35 μg/m3 ≤ PM2.5 ≤ 75 μg/m3) and heavy pollution (PM2.5 > 75 μg/m3), respectively. (b) Correlation between the observed UHI intensities and PM2.5 concentration differences of Nanjing, 2014. Blue dots indicate the UHI intensities and the red line is the linear regression of the UHI intensity and the PM2.5 concentration difference. The figure was produced using Prism 6.
The diurnal cycle of T UHI for the heavy pollution case differs from the other two cases, as it does not exhibit a maximum in the afternoon. In contrast, for the heavy pollution case, T UHI is larger at night and is approximately 1 K lower than the light and medium pollution cases during the day.
Figure 2b shows the relationship between the UHI intensities and PM2.5 concentration differences of the urban and suburban sites (∆PM2.5) of Nanjing in 2014. Each data point represents an hourly value of a UHI intensity and the corresponding PM2.5 concentration difference. The PM2.5 levels at the urban site were always equal to or higher than those at the suburban site, with the differences ranging from 0 to 55 μg/m3. A negative correlation between the UHI intensity and the PM2.5 difference was found; as ∆PM2.5 increased, the UHI intensity tended to decrease.
Chang et al.30 showed that PM2.5 strengthened the UHI at night because it increased longwave radiation. Our results confirm this finding when we compare the light and medium PM2.5 loadings to the heavy PM2.5 loading. However, when comparing the light and medium PM2.5 loading, we find a weakening of the UHI intensity for daytime and nighttime.
Simulated PM2.5 effects on surface temperature
As described in the methodology section, WRF-Chem simulations were carried out to investigate the effects of PM2.5 on the surface temperature. Two experiments, one with and one without the direct and indirect aerosol effects, were conducted. The differences of the surface temperatures of the two experiments were used to assess the role of PM2.5 on the surface temperature. As fine particles have negative surface radiative forcings, we expect the surface temperatures to become cooler with higher PM2.5 loadings22.
Figure 3a shows a comparison of the observed and simulated UHI intensities for the station pair Beijige and Pukou for the four months of January, April, July, and October. The monthly averages of the UHI intensities were well captured by the model, as the averages are the same for model and observations (1 K, 0.7 K, 0.2 K and 0.4 K in January, April, July and October, respectively). The model simulation tends to underpredict the range of UHI intensity values on an hourly basis, especially in January. Figure 3b shows a quantitative comparison of the daily observed and simulated PM2.5 concentrations at the urban site in Nanjing in 2011. Although the PM2.5 levels in July and October are overpredicted by approximately 20 μg/m3 and 15 μg/m3, the daily variations were well simulated compared to the observations of the four months.
Figure 3.
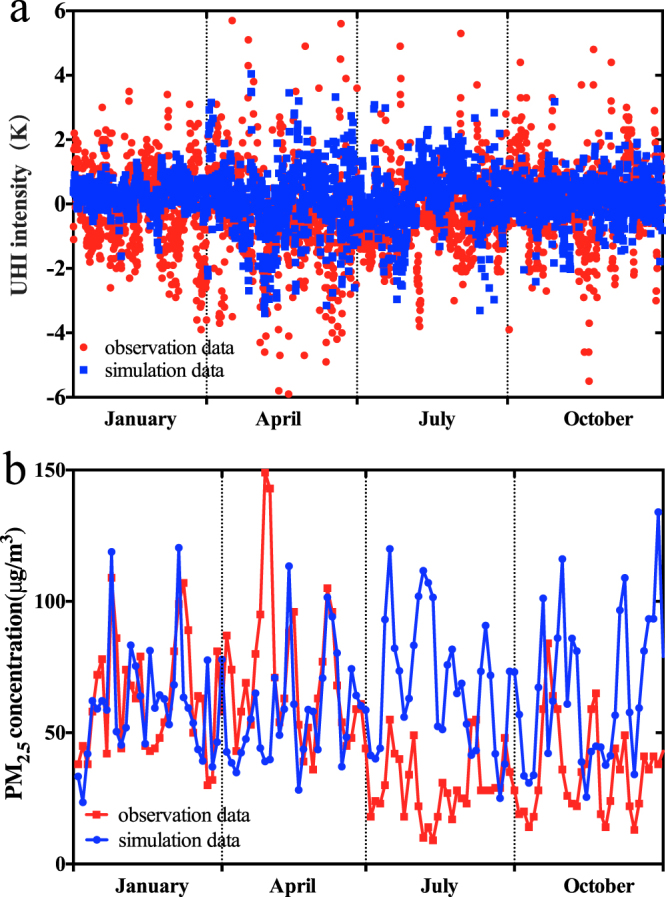
Comparison of observed and simulated UHI intensity and PM2.5 concentration in Nanjing, 2011. (a) Comparison of hourly observed and simulated UHI intensities between the urban and suburban site. Red dots indicate observational data and blue dots indicate simulation data. (b) Comparison of the daily average observed and simulated PM2.5 concentration data at the urban site. Red dots indicate the observational data and blue dots indicate the simulation data. The figure was produced using Prism 6.
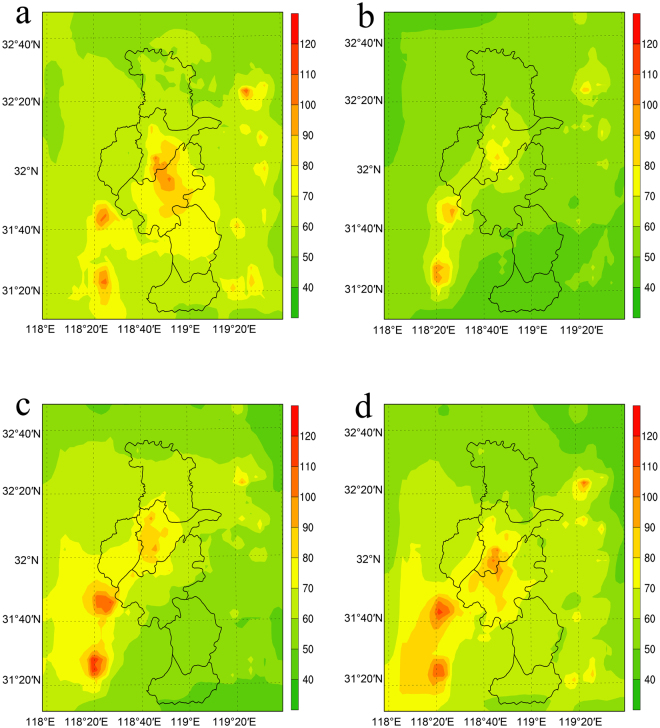
Figure 4 shows the horizontal distribution of the monthly averaged PM2.5 concentrations over Nanjing from the output of the lowest model layer. In the urban centre, the average PM2.5 concentration in 2011 was observed to be 40–50 μg/m3 in the summer (June, July, August) and 80–90 μg/m3 in the winter (December, January, February). In the suburban region, the average concentration was observed to be 30–40 μg/m3 in the summer and 60–80 μg/m3 in the winter, according to short-term observations29. The lower PM2.5 concentrations in the summer can be explained as being the result of the increased amount of precipitation and better diffusion conditions induced by more instable atmosphere during the summer, resulting in increased surface PM2.5 removal by wet deposition and vertical diffusion. Figure 4 shows that the simulations capture the seasonality of the PM2.5 concentration. The simulated PM2.5 concentration is highest in January (110–80 μg/m3 in the urban centre) and lowest in July (100–70 μg/m3 in the urban centre). Two other regions of high PM2.5 concentrations are apparent near southwestern Nanjing: the cities of Maanshan and Wuhu. The high PM2.5 concentrations of these two cities affect the southern suburban areas of Nanjing and do not impact the suburban stations of our numerical experiments.
Figure 4.
Monthly averaged simulated surface PM2.5 concentrations (μg/m3) for Nanjing. (a) January; (b) April; (c) July; (d) October, 2011. The maps were generated using NCAR Command Language (Version 6.2.0., https://www.ncl.ucar.edu, 2014).
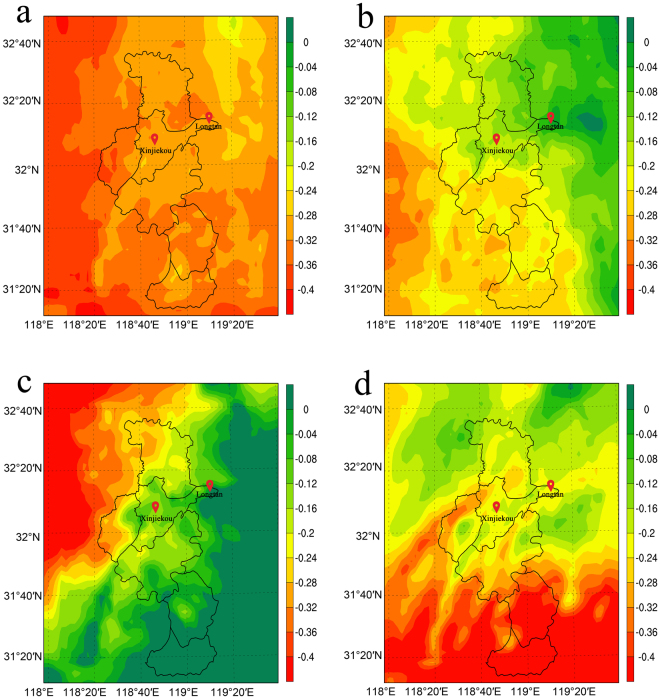
Figure 5 shows the horizontal distribution of the surface temperature differences caused by PM2.5. Owing to the seasonal variation of the PM2.5 concentration, the surface temperature change (∆T) over the area is generally highest in January and lowest in July. However, to determine the impact of PM2.5 on the UHI (quantified via ∆T UHI), we need to compare the ∆T of the urban area to the ∆T of the suburban area, as a simple correlation with the PM2.5 map cannot be expected. Aerosols both scatter and absorb solar radiation, thus cooling the surface. However, the simulated surface temperature is still dependent on other factors; when the aerosols cool the surface temperature, the atmosphere becomes more stable, which changes the moisture transport and results in cloud and precipitation feedbacks, which affect temperature again. Due to these complex feedbacks, the horizontal distribution of the surface temperature response is not always similar to the horizontal distribution of the PM2.5 differences. However, the surface temperature gradient around the PM2.5 source can be found in Figs 4 and 5.
Figure 5.
Monthly averaged surface temperature change ∆T (K) at a 2-m height due to PM2.5 in (a) January; (b) April; (c) July; and (d) October, 2011. The maps were generated using NCAR Command Language (Version 6.2.0., https://www.ncl.ucar.edu, 2014).
Simulated PM2.5 effects on the surface UHI
According to the observational results discussed in Section 3.1, the UHI intensity is weakened during the day as the PM2.5 concentrations increase. From the simulations, we learn that the surface temperature cooling is indeed inhomogeneous across the domain (Fig. 5). Higher reductions of the surface temperature, as large as 0.3 K, were found in the urban centre, especially in July, while the reduction of the surface temperature was only 0.2 K in the suburban region.
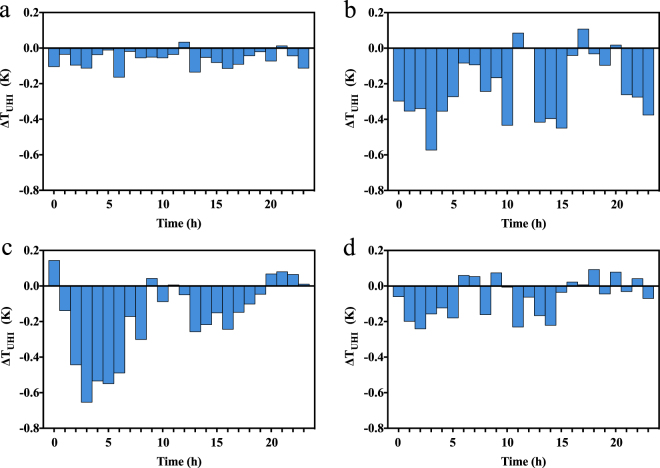
Next, we quantified the diurnal variations of the simulated changes in the UHI intensities due to the presence of PM2.5, ∆T UHI. Negative values of ∆T UHI correspond to weakened UHI intensities caused by the presence of PM2.5. Figure 6 shows the diurnal cycle of the changes in the UHI intensities caused by those of PM2.5 over the four different months. During the day, the surface temperature was reduced due to decreased solar radiation caused by the scattering and absorbing aerosols in both the urban and the suburban region. However, since the PM2.5 loading of the urban region is consistently larger than that in the suburban region, the temperature decrease was larger in the urban region, which explains the decreased UHI intensity when PM2.5 was included in the simulations. While ∆T UHI is positive at a few points, the magnitudes of these points are small. Thus, the strengthening of the night-time UHI intensity caused by heavy pollution conditions seen in the observational data (Fig. 2) is not found in the simulation results (Fig. 6) because we do not separate the low, middle and high pollution days when calculating the monthly average diurnal UHI intensity changes.
Figure 6.
Monthly averages of the diurnal cycles of the simulated changes in UHI intensities due to PM2.5 (∆T UHI ) for (a) January, (b) April, (c) July, (d) October, 2011. The shaded bars indicate the values of ∆T UHI. The figure was produced using Prism 6.
Figure 6 also shows that the magnitude of the ∆T UHI was larger in April and July than in January and October. Table 1 shows the monthly averaged T UHI values with and without the PM2.5 effects and the resulting ∆T UHI. The seasonal variations of ∆T UHI depend on both the available solar radiation and the differences of the PM2.5 levels of the urban centre and the suburban area. Without the PM2.5 effect, T UHI mainly depends on solar radiation, which varies according to the seasons. As a result, T UHI was highest in July and lowest in January. However, PM2.5 obviously weakened the UHI intensity, and the differences of the PM2.5 levels of the urban centre and the suburban area are larger in July (18.51 μg/m3) than in January (15.86 μg/m3). When including PM2.5 in the simulations, T UHI reached a lowest value of nearly 0.15 K in July and a highest value at nearly 0.3 K in January. In general, PM2.5 contributed to the ∆T UHI the most, with −0.27 K in July, and the least, with −0.08 K, in January, due to the seasonal variations of the PM2.5 concentrations and solar radiation.
Table 1.
Monthly averaged values of T UHI and ∆T UHI at 2-m heights affected by PM2.5.
| January | April | July | October | |
|---|---|---|---|---|
| T UHI without the PM2.5 effect (K) | 0.37 | 0.40 | 0.42 | 0.36 |
| T UHI with the PM2.5 effect (K) | 0.29 | 0.19 | 0.15 | 0.18 |
| ∆T UHI (K) | −0.08 | −0.21 | −0.27 | −0.18 |
Simulated PM2.5 effect on the UHI profile
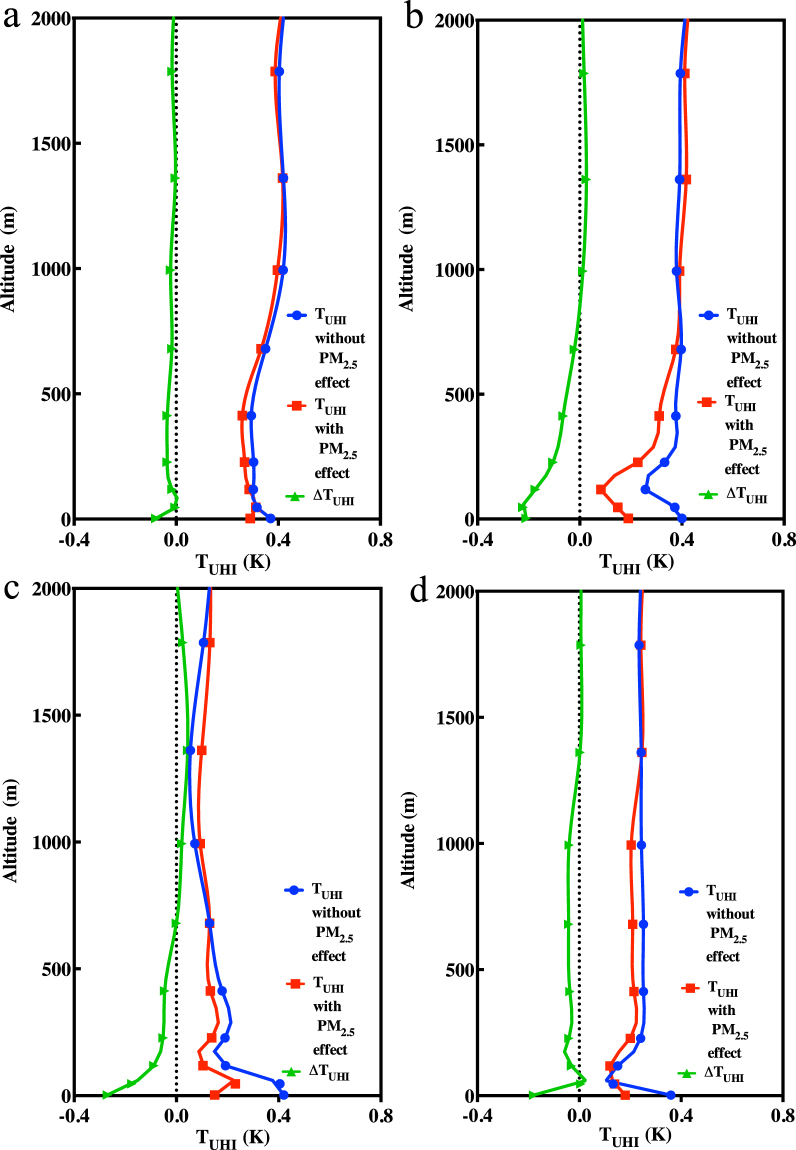
While we have discussed changes in the UHI intensities near the surface caused by PM2.5, the changes in temperature due to PM2.5 also exist in higher layers. Figure 7 shows the vertical profiles of the UHI intensities with and without including the effects of PM2.5, as well as the change due to PM2.5. In the four months studied, the T UHI values have similar vertical profiles, first declining from the surface up to 100 m, then increasing to a height of approximately 1000 m and remaining constant between 1000 m and 2000 m. This finding shows that the UHI intensity changes can be observed at well over 500 m41. The ∆T UHI profile shows that PM2.5 reduces the UHI intensity at lower altitudes, usually below 500–1000 m. For higher altitudes, the ∆T UHI values approach zero in January and October. In April (Fig. 7b) and July (Fig. 7c), the ∆T UHI values are larger than zero when the altitude is over 1000 m and decrease to zero at 2000 m. The UHI intensity was most weakened by PM2.5 near the surface, but the weakening effect decreases with height. Therefore, the ∆T UHI shown in Fig. 7b,c approach 0 K in the 600–700 m layer, with negative values below this height. The small positive values of ∆T UHI shown in Fig. 7b,c above 600–700 m mean that the UHI intensity was intensified by as little as 0.03 K, which may be the result of the aerosol warming effect, which is caused by the absorption of solar radiation in the upper levels of the boundary layer. This phenomenon is dependent on the chemical composition and vertical distribution of PM2.5, which should be addressed in more detail in a future study. This seasonal variation occurs because PM2.5 is mainly limited to the boundary layer, and the top of the boundary layer is higher in the spring and summer than in the fall and winter.
Figure 7.
Monthly average T UHI profile from 2 m to 2000 m in (a) January; (b) April; (c) July; (d) October. Blue, red and green lines indicate the UHI intensities without the PM2.5 radiation forcing, with the PM2.5 radiation forcing and the differences of the former two cases at different altitudes.
PM2.5 effect on the daily temperature range
The change of the daily temperature range (referred as ∆T dr in following text) is a useful metric to demonstrate the effects of PM2.5 in the urban centre and over the suburban area42. Table 2 shows the changes of the daily temperature ranges caused by PM2.5 over the four months. In each month, PM2.5 reduced the daily temperature range. Considering PM2.5’s cooling effect during the day and its weak warming effect at night, the reduction in the daily temperature range is caused by both maximum temperature decreases and the minimum temperature increases, which is true in both the urban and the suburban regions. The magnitude of the ∆T dr affected by PM2.5 is larger in the urban centre than in the suburban region.
Table 2.
Monthly variations of temperature daily ranges in 2011, Nanjing (K).
| With PM2.5 effect | January | April | July | Octo ber | ||
|---|---|---|---|---|---|---|
| Urban daily temperature range | Yes | 6.95 | 10.95 | 8.71 | 7.98 | |
| Urban daily temperature range | No | 7.04 | 11.47 | 9.81 | 8.05 | |
| Urban ∆T dr | — | −0.09 | −0.52 | −1.1 | −0.07 | |
| Suburban daily temperature range | Yes | 6.94 | 10.68 | 8.45 | 8.04 | |
| Suburban daily temperature range | No | 6.98 | 10.77 | 9.33 | 8.35 | |
| Suburban ∆T dr | — | −0.04 | −0.09 | −0.88 | −0.31 | |
Conclusions
Our study reveals that fine particles weakened the UHI intensities during the day using observational analysis and numerical modelling. Based on observations, the UHI intensity can be reduced by up to 1 K under heavily polluted conditions. According to our simulations, PM2.5 reduced the surface radiation and the surface temperature22, 27 by up to 0.3 K in the urban centre of Nanjing. The simulated PM2.5 concentrations were higher in the urban centre than those in the suburban area for all four studied months, thus affecting the UHI intensities. The simulated PM2.5 concentration differences between the urban and suburban sites were, on average, 15.86 μg/m3, 20.42 μg/m3, 18.51 μg/m3, 16.73 μg/m3 in January, April, July and October, respectively. The seasonal variations of the PM2.5 differences over the four months are consistent with those of ∆T UHI, where the UHI intensity is weakened less in January and October but more in April and July. The day-time UHI intensity reduction was strongest in July and weakest in January as both the PM2.5 concentration differences between the urban and suburban areas and the incoming solar radiation varied across different seasons. The reduction mainly occurred at altitudes below 500–1000 m. The response of the UHI intensity to the PM2.5 at night depended on the PM2.5 load. The night-time UHI intensity was weakened when the pollution levels were low to medium but was strengthened when the pollution levels were high.
PM2.5 also reduced the daily temperature ranges, according to the simulations. The daily temperature range values in the urban centre were greater than those in the suburban area for all four months, as was the reduction caused by PM2.5.
The UHI intensity and daily temperature range are significant reference signals of the urban climate. We showed that PM2.5 pollution reduces urban warming during the day but can intensify the warming at night when the pollution levels are high. Thus, pollution can mask the UHI effects, and pollution levels need to be considered when comparing the UHI intensities of different cities. In a future study, we will further investigate the impact of the PM2.5 compositions, as the scattering and absorbing aerosols cause different radiative forcings.
Acknowledgements
This work was supported by the National Natural Science Foundation of China (91544230, 41575145, 41621005), the National Key Basic Research Development Program of China (2016YFC0203303, 2016YFC0208504,2014CB441203), and the EU 7th Framework Marie Curie Actions IRSES Project: REQUA (PIRSES-GA-2013-612671). We appreciate the Nanjing Meteorological Bureau for the temperature data and the Nanjing Environmental Monitoring Center for the PM2.5 concentration data.We thank Prof. Xuhui Lee from Yale University for his useful comments.
Author Contributions
H.W. performed the numerical experiments and analysed the data. H.W. and T.W. conceived the research topic. H.W., T.W. and N.R. wrote the manuscript. P.L., M.L. and S.L. provided help for the numerical experiments.
Competing Interests
The authors declare that they have no competing interests.
Footnotes
Publisher's note: Springer Nature remains neutral with regard to jurisdictional claims in published maps and institutional affiliations.
References
- 1.Howard, L. The climate of London: deduced from meteorological observations made in the metropolis and at various places around it. Vol. 2 (Harvey and Darton, J. and A. Arch, Longman, Hatchard, S. Highley [and] R. Hunter, 1833).
- 2.Manley G. On the frequency of snowfall in metropolitan England. Quart. J. Roy. Meteor. Soc. 1958;84:70–72. doi: 10.1002/qj.49708435910. [DOI] [Google Scholar]
- 3.Chen X-L, Zhao H-M, Li P-X, Yin Z-Y. Remote sensing image-based analysis of the relationship between urban heat island and land use/cover changes. Remote. Sens. Environ. 2006;104:133–146. doi: 10.1016/j.rse.2005.11.016. [DOI] [Google Scholar]
- 4.Oke, T. R. Boundary layer climates. (Routledge, 2002).
- 5.Xia, X., Li, Z., Wang, P., Chen, H. & Cribb, M. Estimation of aerosol effects on surface irradiance based on measurements and radiative transfer model simulations in northern China. J. Geophys. Res. 112 D22 (2007).
- 6.Lin C-Y, et al. Urban heat island effect and its impact on boundary layer development and land–sea circulation over northern Taiwan. Atmos. Environ. 2008;42:5635–5649. doi: 10.1016/j.atmosenv.2008.03.015. [DOI] [Google Scholar]
- 7.Weng Q, Yang S. Managing the adverse thermal effects of urban development in a densely populated Chinese city. J. Environ. Manage. 2004;70:145–156. doi: 10.1016/j.jenvman.2003.11.006. [DOI] [PubMed] [Google Scholar]
- 8.Zhao L, Lee X, Smith RB, Oleson K. Strong contributions of local background climate to urban heat islands. Nature. 2014;511:216–219. doi: 10.1038/nature13462. [DOI] [PubMed] [Google Scholar]
- 9.Huang L, Zhao D, Wang J, Zhu J, Li J. Scale impacts of land cover and vegetation corridors on urban thermal behavior in Nanjing, China. Theor. Appl. Climatol. 2008;94:241–257. doi: 10.1007/s00704-007-0359-4. [DOI] [Google Scholar]
- 10.Jones P, et al. Assessment of urbanization effects in time series of surface air temperature over land. Nature. 1990;347:169–172. doi: 10.1038/347169a0. [DOI] [Google Scholar]
- 11.Peterson TC, et al. Global rural temperature trends. Geophys. Res. Lett. 1999;26:329–332. doi: 10.1029/1998GL900322. [DOI] [Google Scholar]
- 12.Gough W, Rozanov Y. Aspects of Toronto’s climate: heat island and lake breeze. Canadian Meteoro. Oceanogr. Soc. Bull. 2001;29:67–71. [Google Scholar]
- 13.Mohsin T, Gough WA. Trend analysis of long-term temperature time series in the Greater Toronto Area (GTA) Theor. App. Climatol. 2010;101:311–327. doi: 10.1007/s00704-009-0214-x. [DOI] [Google Scholar]
- 14.Parker DE. Urban heat island effects on estimates of observed climate change. Wiley Interdisciplinary Reviews: Climate Change. 2010;1:123–133. [Google Scholar]
- 15.Agarwal M, Tandon A. Modeling of the urban heat island in the form of mesoscale wind and of its effect on air pollution dispersal. Appl. Math. Model. 2010;34:2520–2530. doi: 10.1016/j.apm.2009.11.016. [DOI] [Google Scholar]
- 16.Fallmann, J., Emeis, S. & Suppan, P. Modeling of the Urban Heat Island and its effect on Air Quality using WRF/WRF-Chem – Assessment of mitigation strategies for a Central European city. (Springer International Publishing, 2014).
- 17.Fallmann J, Forkel R, Emeis S. Secondary effects of urban heat island mitigation measures on air quality. Atmos. Environ. 2016;125:199–211. doi: 10.1016/j.atmosenv.2015.10.094. [DOI] [Google Scholar]
- 18.Sarrat C, Lemonsu A, Masson V, Guedalia D. Impact of urban heat island on regional atmospheric pollution. Atmos. Environ. 2006;40:1743–1758. doi: 10.1016/j.atmosenv.2005.11.037. [DOI] [Google Scholar]
- 19.Kaufman YJ, Tanré D, Boucher O. A satellite view of aerosols in the climate system. Nature. 2002;419:215–223. doi: 10.1038/nature01091. [DOI] [PubMed] [Google Scholar]
- 20.Nabat P, et al. Direct and semi-direct aerosol radiative effect on the Mediterranean climate variability using a coupled regional climate system model. Climate. Dyn. 2014;44:1127–1155. doi: 10.1007/s00382-014-2205-6. [DOI] [Google Scholar]
- 21.Vogel B, et al. The comprehensive model system COSMO-ART–Radiative impact of aerosol on the state of the atmosphere on the regional scale. Atmos. Chem. Phys. 2009;9:8661–8680. doi: 10.5194/acp-9-8661-2009. [DOI] [Google Scholar]
- 22.Im U, et al. Summertime aerosol chemical composition in the Eastern Mediterranean and its sensitivity to temperature. Atmos. Environ. 2012;50:164–173. doi: 10.1016/j.atmosenv.2011.12.044. [DOI] [Google Scholar]
- 23.Booth BBB, Dunstone NJ, Halloran PR, Andrews T, Bellouin N. Erratum: Aerosols implicated as a prime driver of twentieth-century North Atlantic climate variability. Nature. 2012;484:228–232. doi: 10.1038/nature10946. [DOI] [PubMed] [Google Scholar]
- 24.Schmidt GA, Shindell DT, Tsigaridis K. Reconciling warming trends. Nat. Geos. 2014;7:158–160. doi: 10.1038/ngeo2105. [DOI] [Google Scholar]
- 25.Solomon S, et al. The persistently variable “background” stratospheric aerosol layer and global climate change. Science. 2011;333:866–870. doi: 10.1126/science.1206027. [DOI] [PubMed] [Google Scholar]
- 26.Schult I, Feichter J, Cooke WF. Effect of black carbon and sulfate aerosols on the global radiation budget. J. Geophys. Res. 1997;102:30107–30117. doi: 10.1029/97JD01863. [DOI] [Google Scholar]
- 27.Wu J, et al. Simulation of direct effects of black carbon aerosol on temperature and hydrological cycle in Asia by a Regional Climate Model. Meteor. Atmos. Phys. 2008;100:179–193. doi: 10.1007/s00703-008-0302-y. [DOI] [Google Scholar]
- 28.Zhuang B, et al. Optical properties and radiative forcing of urban aerosols in Nanjing, China. Atmos. Environ. 2014;83:43–52. doi: 10.1016/j.atmosenv.2013.10.052. [DOI] [Google Scholar]
- 29.Wu H, et al. Impact of aerosol on the urban heat island intensity in Nanjing. Trans. Atmos. Sci. 2014;37:425–431. [Google Scholar]
- 30.Chang, C. et al. Urban heat islands in China enhanced by haze pollution. Nat. Commun. 7 (2016). [DOI] [PMC free article] [PubMed]
- 31.Grell GA, et al. Fully coupled “online” chemistry within the WRF model. Atmos. Environ. 2005;39:6957–6975. doi: 10.1016/j.atmosenv.2005.04.027. [DOI] [Google Scholar]
- 32.Skamarock WC, Klemp JB. A time-split nonhydrostatic atmospheric model for weather research and forecasting applications. J. Comput. Phys. 2008;227:3465–3485. doi: 10.1016/j.jcp.2007.01.037. [DOI] [Google Scholar]
- 33.Hong S-Y, Noh Y, Dudhia J. A new vertical diffusion package with an explicit treatment of entrainment processes. Month. Weat. Rev. 2006;134:2318–2341. doi: 10.1175/MWR3199.1. [DOI] [Google Scholar]
- 34.Chou, M. D., Suarez, M. J., Liang, X. Z., Yan, M. H. & Cote, C. A Thermal Infrared Radiation Parameterization for Atmospheric Studies. Max J (2001).
- 35.Mlawer EJ, Taubman SJ, Brown PD, Iacono MJ, Clough SA. Radiative transfer for inhomogeneous atmospheres: RRTM, a validated correlated‐k model for the longwave. J. Geophy. Res. 1997;102:16663–16682. doi: 10.1029/97JD00237. [DOI] [Google Scholar]
- 36.Stockwell WR, Middleton P, Chang JS, Tang X. The second generation regional acid deposition model chemical mechanism for regional air quality modeling. J. Geophy. Res. 1990;95:16343–16367. doi: 10.1029/JD095iD10p16343. [DOI] [Google Scholar]
- 37.Ackermann IJ, et al. Modal aerosol dynamics model for Europe: Development and first applications. Atmos. Environ. 1998;32:2981–2999. doi: 10.1016/S1352-2310(98)00006-5. [DOI] [Google Scholar]
- 38.Schell B, Ackermann IJ, Hass H, Binkowski FS, Ebel A. Modeling the formation of secondary organic aerosol within a comprehensive air quality model system. J. Geophy. Res. 2001;106:28275–28293. doi: 10.1029/2001JD000384. [DOI] [Google Scholar]
- 39.Guenther ZP, Wildermuth M. Natural volatile organic compound emission rate estimates for US woodland landscapes. Atmos. Environ. 1994;28:1197–1210. doi: 10.1016/1352-2310(94)90297-6. [DOI] [Google Scholar]
- 40.Guenther AB, Zimmerman PR, Harley PC, Monson RK, Fall R. Isoprene and monoterpene emission rate variability: model evaluations and sensitivity analyses. J. Geophy. Res. 1993;98:12609–12617. doi: 10.1029/93JD00527. [DOI] [Google Scholar]
- 41.Bornstein RD. Observations of the urban heat island effect in New York City. J. Appl. Meteo. 1968;7:575–582. doi: 10.1175/1520-0450(1968)007<0575:OOTUHI>2.0.CO;2. [DOI] [Google Scholar]
- 42.Kalnay E, Cai M. Impact of urbanization and land-use change on climate. Nature. 2003;423:528–531. doi: 10.1038/nature01675. [DOI] [PubMed] [Google Scholar]
Associated Data
This section collects any data citations, data availability statements, or supplementary materials included in this article.
Data Availability Statement
The data that support the findings of this study are available from the corresponding author upon reasonable request.


