

Lampreys with rostral spinal cord injury (SCI) exhibited greater axonal regeneration of descending brain neurons and more rapid recovery of locomotor muscle activity below the lesion site compared with animals with caudal SCI. In addition, following rostral SCI, most injured reticulospinal (RS) neurons displayed the “injury phenotype,” whereas following caudal SCI, most injured neurons had normal electrical properties. We hypothesize that following caudal SCI, the spared synapses of injured RS neurons might limit axonal regeneration and behavioral recovery.
Keywords: locomotion, reticulospinal neurons, axotomy, neurotrophic factors
Abstract
Following rostral spinal cord injury (SCI) in larval lampreys, injured descending brain neurons, particularly reticulospinal (RS) neurons, regenerate their axons, and locomotor behavior recovers in a few weeks. However, axonal regeneration of descending brain neurons is mostly limited to relatively short distances, but the mechanisms for incomplete axonal regeneration are unclear. First, lampreys with rostral SCI exhibited greater axonal regeneration of descending brain neurons, including RS neurons, as well as more rapid recovery of locomotor muscle activity right below the lesion site, compared with animals with caudal SCI. In addition, following rostral SCI, most injured RS neurons displayed the “injury phenotype,” whereas following caudal SCI, most injured neurons displayed normal electrical properties. Second, following rostral SCI, at cold temperatures (~4–5°C), axonal transport was suppressed, axonal regeneration and behavioral recovery were blocked, and injured RS neurons displayed normal electrical properties. Cold temperatures appear to prevent injured RS neurons from detecting and/or responding to SCI. It is hypothesized that following rostral SCI, injured descending brain neurons are strongly stimulated to regenerate their axons, presumably because of elimination of spinal synapses and reduced neurotrophic support. However, when these neurons regenerate their axons and make synapses right below the lesion site, restoration of neurotrophic support very likely suppress further axonal regeneration. In contrast, caudal SCI is a weak stimulus for axonal regeneration, presumably because of spared synapses above the lesion site. These results may have implications for mammalian SCI, which can spare synapses above the lesion site for supraspinal descending neurons and propriospinal neurons.
NEW & NOTEWORTHY Lampreys with rostral spinal cord injury (SCI) exhibited greater axonal regeneration of descending brain neurons and more rapid recovery of locomotor muscle activity below the lesion site compared with animals with caudal SCI. In addition, following rostral SCI, most injured reticulospinal (RS) neurons displayed the “injury phenotype,” whereas following caudal SCI, most injured neurons had normal electrical properties. We hypothesize that following caudal SCI, the spared synapses of injured RS neurons might limit axonal regeneration and behavioral recovery.
in all vertebrates, reticulospinal (RS) neurons in a brain command system activate spinal central pattern generator (CPG) networks to initiate locomotor behavior (Orlovsky et al. 1999). Following severe, upper spinal cord injury (SCI) for higher vertebrates, including humans, the injured descending axons of RS neurons do not regenerate, resulting in permanent loss of locomotor and other functions below the lesion site (Bradbury and McMahon 2006). In contrast, following rostral spinal cord transections in lower vertebrates, such as lampreys, fish, and certain amphibians, RS neurons regenerate their axons, and locomotor functions gradually recover below the lesion site in a few weeks (reviewed in McClellan 1998, 2013). In normal lampreys, ~55–65% of the axons of RS neurons project for relatively long distances (Davis and McClellan 1994b) and can activate locomotor CPG networks along the length of the spinal cord (McClellan 1994a). At 32-wk recovery times following rostral spinal cord transections, most axons of RS neurons have regenerated for relatively short distances (Davis and McClellan 1994a, 1994b) and appear to make synapses mostly just below the injury site (Mackler and Selzer 1987; Wood and Cohen 1981; reviewed in McClellan 1994b, 2013). Various compensatory mechanisms make up for this incomplete axonal regeneration so that behavioral recovery is virtually complete by ~8 wk posttransection (reviewed in McClellan 1994b, 2013). Similar incomplete axonal regeneration has been described in other spinal cord-injured lower vertebrates (reviewed in McClellan 1998).
Following rostral spinal cord transections in the lamprey, injured (axotomized) RS neurons display dramatic changes in their properties that, together, are defined as the “injury phenotype” (reviewed in McClellan 2013). First, at ~2- to 3-wk recovery times, injured RS neurons fire a single short burst or short repetitive bursts of action potentials in response to a sustained depolarizing stimulus compared with uninjured RS neurons, which fire a smooth, continuous train of action potentials (McClellan et al. 2008). These and other results suggest that injured RS neurons display a decrease in electrical excitability compared with uninjured neurons (reviewed in McClellan 2013). Also, for uninjured RS neurons, action potentials are followed by three afterpotential components (McClellan et al. 2008): fast afterhyperpolarization (fAHP), afterdepolarization (ADP), and slow AHP (sAHP), which is due to calcium influx via high-voltage-activated (HVA) calcium channels and calcium-activated potassium (SK) channels. For injured RS neurons, the ADP and sAHP are absent or substantially reduced, and the fAHP is larger than normal. The substantial reduction in the sAHP appears to be due to a downregulation of mRNA for HVA calcium and SK channels (McClellan et al. 2008). We hypothesize that the injury phenotype contributes to a reduction in electrical excitability and reduced calcium influx, which provide intracellular conditions that are supportive for axonal regeneration (McClellan et al. 2008; Ryan et al. 2007; reviewed in McClellan 2013). Second, at long recovery times (12–16 wk), when most injured RS neurons have regenerated their axons through the healed spinal lesion site and presumably have made synaptic connections below the lesion site, these neurons display firing patterns and afterpotentials similar to those of uninjured neurons (McClellan et al. 2008).
Although neurotrophic factors can be supplied by sources near the soma or along axonal trajectories (Freidman et al. 1995), these factors also can be supplied by or near postsynaptic targets (i.e., target derived) and are retrogradely transported to the soma to regulate multiple aspects of neuronal function, including supporting neuronal survival, ion channel expression, axonal regeneration, axon guidance, and synaptogenesis (reviewed in de la Cruz et al. 1996; Hanz and Fainzilber 2006; Lykissas et al. 2007; Rishal and Fainzilber 2010; Titmus and Faber 1990; Zweifel et al. 2005). When axonal transport is blocked, uninjured neurons can display ultrastructural and electrophysiological properties that are similar to those of injured neurons (Pilar and Landmesser 1972; Pitman et al. 1972; Purves 1976). Also, when injured neurons regenerate their axons and innervate postsynaptic targets, presumably restoring neurotrophic support, some or all of the normal electrical properties of these cells are restored (Benítez-Temiño et al. 2002; Kelly et al. 1988). Thus synapses with postsynaptic targets can provide neurotrophic support that regulates the properties and regenerative responses of injured neurons.
Axotomy at different distances from the cell bodies of neurons can result in different numbers (proportions) of spared synapses these injured neurons make with postsynaptic targets and presumably the amount of target-derived neurotrophic support. For example, for goldfish Mauthner cells, which synapse with motoneurons along the contralateral spinal cord, the nerve cell body response of this RS neuron following SCI is substantially greater for close vs. distant axotomy (Zottoli et al. 1984).
For motoneurons (MNs), sensory neurons (SNs), sympathetic neurons, and retinal ganglion cells (RGCs), axonal injuries can test the effects of soma-axotomy distance alone without creating differences in the proportion of spared synapses. Although axotomy very close to the soma can trigger apoptosis (de la Cruz et al. 1996; Hanz and Fainzilber 2006; Zweifel et al. 2005), and more distant axotomy can delay responses for injured neurons (Kenney and Kocsis 1998), in many cases, the above types of neurons respond similarly to proximal and distal axonal injury (Cancalon 1987; Fernandes et al. 1999; Hyatt Sachs et al. 2007; Liabotis and Schreyer 1995; Törnqvist and Aldskogius 1994).
In the present study, experiments were performed to begin to investigate possible mechanisms for incomplete axonal regeneration following SCI in the lamprey. First, following spinal cord transections at different rostrocaudal locations, three issues were examined: 1) degree of axonal regeneration of descending brain neurons, particularly RS neurons; 2) rate and completeness of recovery of locomotor function below the lesion site; and 3) biophysical properties and expression of the injury phenotype in injured RS neurons (preliminary report in McClellan et al. 2005). Second, the above three issues were examined following SCI and recovery at cold temperatures (~4–5°C), which in other animals are known to reduce axonal transport and axonal regeneration (Brimijoin et al. 1979; Cancalon 1985; Edström and Hanson 1973). It is hypothesized that following SCI in the lamprey, the synapses that injured descending brain neurons make, either above or below a SCI, might provide target-derived neurotrophic support that regulates the degree to which these neurons regenerate their axons. Thus rostral spinal cord transections, which will eliminate most of the synapses descending brain neurons make with spinal neurons, are expected to be a strong stimulus for axonal regeneration. However, when these neurons regenerate their axons and make synapses right below the injury site, and neurotrophic support likely is restored, further axonal regeneration is expected to be suppressed, leading to incomplete axonal regeneration. In contrast, caudal spinal transections are expected to spare synapses above the lesion site and result in a weak stimulus for axonal regeneration. Individual lamprey RS neurons do appear to make synapses along the rostrocaudal extent of the spinal cord. For example, Mauthner cells and many Müller cells, which are large, identified RS neurons, make synapses with MNs and/or other spinal neurons distributed along the spinal cord (Brodin et al. 1994; Rovainen 1974). In addition, single lamprey RS neurons can influence spinal motor and locomotor activity along the entire extent of their descending axons (Zelenin et al. 2001, 2003). Results from the current study may have implications for mammalian SCI, which can spare synapses above the lesion site for supraspinal descending neurons and propriospinal neurons.
METHODS
Animal Care
Experiments were performed with larval sea lampreys (Petromyzon marinus; length 91 ± 14 mm) that were collected from streams and rivers in Michigan or Massachusetts. Animals were maintained in ~10-liter aquariums at ~23°C. The procedures in this study have been approved by the Animal Use and Care Committee at the University of Missouri. For all surgical procedures, animals were anesthetized in ~200 mg/l tricaine methanosulfonate (MS-222; Crescent Research Chemicals, Phoenix, AZ).
Retrograde Labeling of Descending Brain Neurons That Regenerated Their Axons
Anatomical experiments were performed to determine if the degree of axonal regeneration of descending brain neurons (see Zhang and McClellan 1999), particularly reticulospinal (RS) neurons, is dependent on the rostrocaudal location of spinal transections. For experimental animals, the spinal cord was exposed and transected with fine iridectomy scissors at one of three locations (Fig. 1A): 1) 10% body length (BL; relative distance from anterior head; n = 35 animals), 2) 30% BL (n = 38), or 3) 50% BL (n = 51). Following various recovery times (4, 6, 8, 16, or 32 wk), horseradish peroxidase (HRP; type VI; Sigma Chemical, St. Louis, MO) was applied to the transected spinal cord at 20%, 40%, or 60% BL for the animals in the three experimental groups (Fig. 1A), as previously described in detail (Davis and McClellan 1994a, 1994b; Shaw et al. 2010; Zhang and McClellan 1999; Zhang et al. 2002), to retrogradely label descending brain neurons that had regenerated their axons. In normal control animals, HRP was applied to the spinal cord at 20% BL (n = 9), 40% BL (n = 15), or 60% BL (n = 7). After a transport time of ~14–16 days, which is optimal for retrograde transport of HRP from the above tracer application sites (Davis and McClellan 1994a, 1994b), the brains were removed and histologically processed for HRP, as previously described (Shaw et al. 2010; Zhang et al. 2002).
Fig. 1.
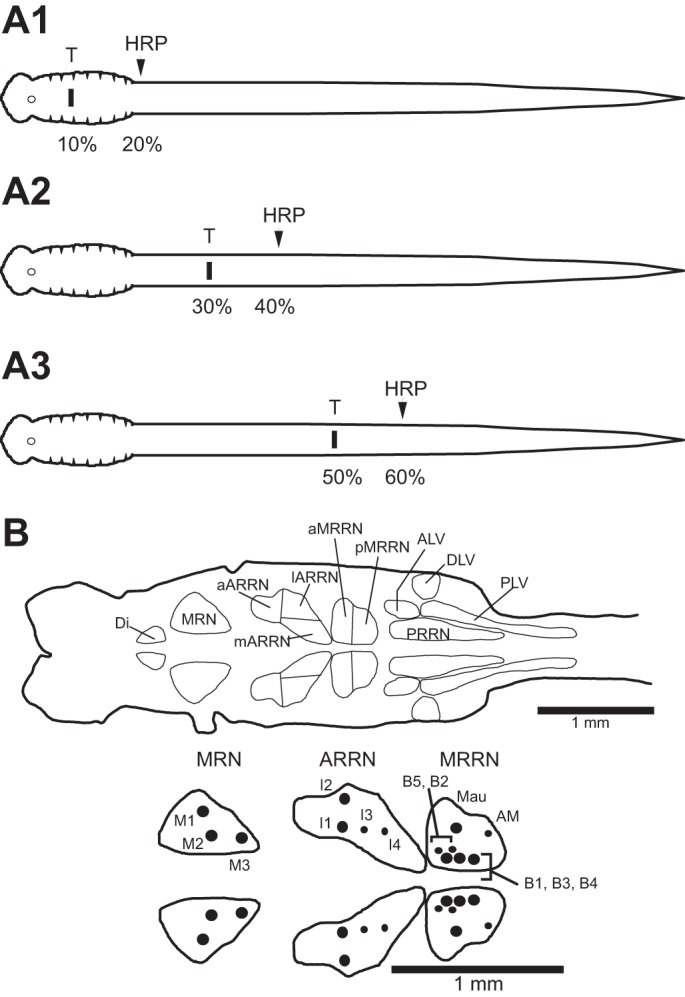
A: diagrams of 3 experimental animal groups for retrograde anatomical labeling experiments. At various recovery times following spinal transections (T) at 10% body length (BL; normalized distance from anterior head; A1), 30% BL (A2), or 50% BL (A3), HRP was applied to the spinal cords of experimental animals at 20%, 40%, or 60% BL, respectively. For normal animals, HRP was applied at 20%, 40%, and 60% BL (not shown). B, top: diagram of brain (left) and upper spinal cord (right) showing contours around 11 cell groups of descending brain neurons, of which ~80% are reticulospinal (RS) neurons (see Davis and McClellan 1994a for detailed description of cell groups). Reticular cell groups are mesencephalic reticular nucleus (MRN) and anterior (ARRN), middle (MRRN), and posterior (PRRN) rhombencephalic reticular nuclei. Non-reticular cell groups are diencephalic group (Di) and anterolateral (ALV), dorsolateral (DLV), and posterolateral (PLV) vagal groups. The aARRN, lARRN, and mARRN are the anterior, lateral, and medial subdivisions of the ARRN, respectively, whereas the aMRRN and pMRRN are the anterior and posterior subdivisions of the MRRN, respectively. Bottom, enlargement of several reticular nuclei showing large, identified RS neurons: M cells in MRN, I cells in ARRN, and B cells in MRRN are called Müller cells, which have ipsilateral descending axons, and Mauthner (Mau) and auxiliary Mauthner (AM) cells are located in MRRN and have contralateral projecting descending axons. In top and bottom diagrams, unidentified RS neurons and non-RS neurons are omitted for simplicity.
Descending brain neurons, including unidentified RS neurons, that were retrogradely labeled with HRP were counted in 11 cell groups (Fig. 1B, top) using a custom computer-based microscope marking-tracing system, as previously described (Davis and McClellan 1994a; Zhang et al. 2002; Shaw et al. 2010). In addition, HRP-labeled large, identified RS neurons were counted in several reticular nuclei (Fig. 1B, bottom), as previously described (Davis and McClellan 1994b; Shaw et al. 2010; Zhang et al. 2002).
For experimental animals in which HRP was applied to the spinal cord at 20% BL, the numbers (means ± SD) of HRP-labeled descending brain neurons (Fig. 2), numbers of labeled unidentified RS neurons in each reticular cell group (Table 1), and numbers of labeled identified RS neurons in each nucleus (Table 2) were normalized and expressed as a percentage of the corresponding mean numbers of labeled neurons in normal animals. Similar normalization procedures were done for animals in which HRP was applied to the spinal cord at 40% or 60% BL. For each recovery time, the percentages for labeled descending brain neurons for the three experimental groups (HRP applied at 20%, 40%, or 60% BL) were compared statistically (InStat, La Jolla, CA) using the nonparametric Kruskal-Wallis with Dunn’s multiple comparisons posttest, and the P values were further adjusted using the Holm family-wide error rate (FWER; http://astatsa.com/KruskalWallisTest/; Fig. 2). Similar analyses were performed for axonal regeneration of unidentified RS neurons (Table 1) and large, identified RS neurons, called Müller and Mauthner cells (Table 2). Statistical significance was assumed for P ≤ 0.05.
Fig. 2.
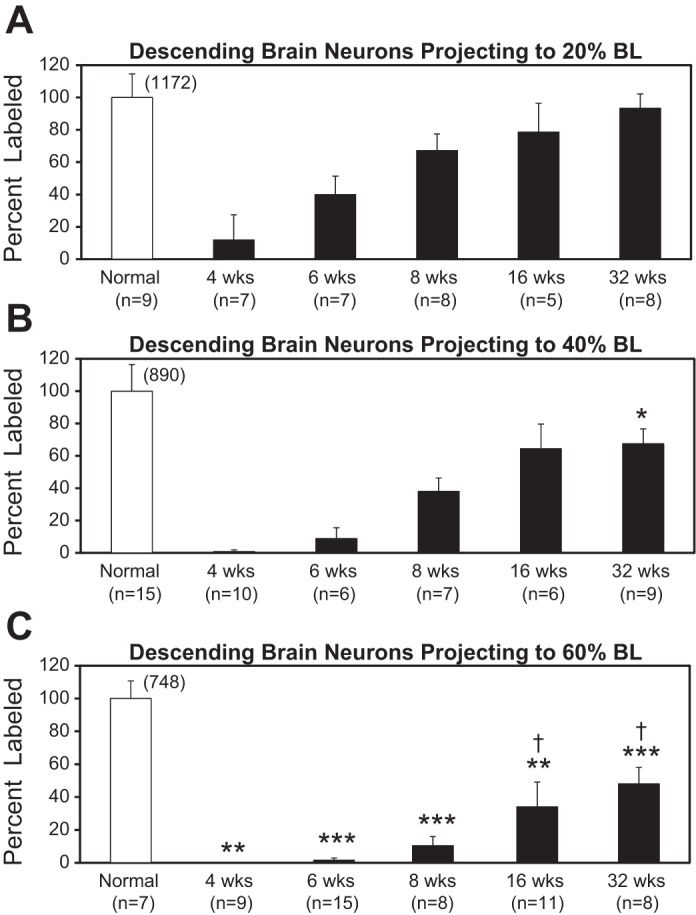
Percentages of retrogradely labeled descending brain neurons (means and SDs) for normal animals (open bars) and experimental animals (filled bars) at various recovery times following HRP application to the spinal cord at 20% BL (A), 40% BL (B), or 60% BL (C; see Fig. 1A). In experimental animals, spinal cord transections were made at 10% BL (A), 30% BL (B), or 50% BL (C). Percentages were determined by normalization to the mean numbers of labeled neurons for normal animals in the same group (see numbers above open bars). Statistics: *P ≤ 0.05; **P ≤ 0.01; ***P ≤ 0.001 compared with percent labeling at same recovery time in A. †P ≤ 0.05 compared with percent labeling at same recovery time in B (Kruskal-Wallis with Dunn’s multiple comparisons posttest).
Table 1.
Percent retrograde labeling for unidentified RS neurons following spinal transections at different rostrocaudal levels
| Normal | 4 wk | 6 wk | 8 wk | 16 wk | 32 wk | |
|---|---|---|---|---|---|---|
| MRN | ||||||
| 20% BL | 100.0 ± 52.1 (9) | 10.4 ± 12.2 (7) | 28.8 ± 17.4 (7) | 57.4 ± 10.2 (8) | 84.4 ± 18.3 (5) | 79.7 ± 18.2 (8) |
| 40% BL | 100.0 ± 44.3 (15) | 0.0 ± 0.0** (10) | 4.1 ± 5.2* (6) | 24.5 ± 10.8 (7) | 45.0 ± 3.7 (6) | 46.8 ± 11.0* (9) |
| 60% BL | 100.0 ± 56.4 (7) | 0.0 ± 0.0** (9) | 0.4 ± 1.4*** (15) | 2.6 ± 4.0*** (8) | 15.3 ± 9.3***† (11) | 34.9 ± 16.1*** (8) |
| aARRN | ||||||
| 20% BL | 100.0 ± 31.9 | 11.5 ± 17.4 | 44.5 ± 31.9 | 78.5 ± 56.6 | 93.7 ± 3.6 | 110.3 ± 23.2 |
| 40% BL | 100.0 ± 35.9 | 0.0 ± 0.0** | 9.0 ± 10.6 | 48.7 ± 16.3 | 56.0 ± 15.6 | 81.5 ± 11.5 |
| 60% BL | 100.0 ± 42.3 | 0.0 ± 0.0** | 0.5 ± 1.1*** | 16.1 ± 10.1***† | 31.0 ± 16.4*** | 42.6 ± 5.4***† |
| lARRN | ||||||
| 20% BL | 100.0 ± 39.9 | 9.2 ± 14.6 | 35.6 ± 15.7 | 66.8 ± 24.8 | 90.1 ± 38.0 | 88.0 ± 23.5 |
| 40% BL | 100.0 ± 21.5 | 0.0 ± 0.0* | 1.9 ± 2.4* | 31.9 ± 7.3 | 46.5 ± 13.3 | 51.8 ± 12.6* |
| 60% BL | 100.0 ± 16.1 | 0.0 ± 0.0* | 0.0 ± 0.0*** | 4.2 ± 5.0***† | 18.6 ± 15.0***† | 35.4 ± 20.0*** |
| mARRN | ||||||
| 20% BL | 100.0 ± 34.3 | 25.6 ± 44.3 | 55.0 ± 33.6 | 79.7 ± 22.4 | 112.4 ± 45.6 | 131.7 ± 13.8 |
| 40% BL | 100.0 ± 21.8 | 0.0 ± 0.0 | 9.6 ± 8.2 | 38.2 ± 12.5 | 55.1 ± 18.0 | 69.6 ± 15.9** |
| 60% BL | 100.0 ± 19.2 | 0.0 ± 0.0 | 0.2 ± 0.8***†† | 5.6 ± 8.8*** | 28.6 ± 13.9*** | 45.3 ± 23.9*** |
| aMRRN | ||||||
| 20% BL | 100.0 ± 39.8 | 11.0 ± 14.1 | 48.5 ± 23.8 | 61.0 ± 22.6 | 90.0 ± 21.1 | 94.5 ± 17.6 |
| 40% BL | 100.0 ± 14.4 | 0.0 ± 0.0** | 20.7 ± 29.9 | 77.1 ± 14.3 | 102.1 ± 29.3 | 97.4 ± 23.9 |
| 60% BL | 100.0 ± 22.9 | 0.0 ± 0.0** | 1.5 ± 2.2*** | 15.2 ± 10.8*††† | 41.4 ± 23.1*†† | 54.4 ± 21.4*† |
| pMRRN | ||||||
| 20% BL | 100.0 ± 20.1 | 11.0 ± 9.6 | 31.7 ± 16.7 | 44.1 ± 23.3 | 88.0 ± 17.6 | 69.9 ± 16.8 |
| 40% BL | 100.0 ± 22.2 | 2.8 ± 5.0* | 11.2 ± 12.4 | 38.0 ± 26.6 | 82.7 ± 23.9 | 69.8 ± 24.1 |
| 60% BL | 100.0 ± 26.4 | 0.3 ± 0.8** | 4.2 ± 6.2** | 21.6 ± 18.7 | 47.9 ± 22.8*† | 53.3 ± 22.9 |
| PRRN | ||||||
| 20% BL | 100.0 ± 12.9 | 12.0 ± 14.2 | 41.4 ± 10.4 | 65.3 ± 5.9 | 73.2 ± 23.0 | 98.4 ± 9.5 |
| 40% BL | 100.0 ± 18.0 | 1.4 ± 2.1 | 8.9 ± 7.3 | 42.6 ± 8.7 | 72.5 ± 21.6 | 73.5 ± 14.5* |
| 60% BL | 100.0 ± 12.3 | 0.1 ± 0.2** | 1.9 ± 2.0*** | 11.2 ± 6.7*** | 33.2 ± 14.0*† | 41.2 ± 19.7***† |
Percentages (means ± SD) in each row are normalized values relative to the corresponding numbers of retrogradely labeled neurons in normal animals (see methods). Locations at 20%, 40%, or 60% BL are HRP application sites in the spinal cords of normal animals as well as experimental animals at various recovery times following spinal transections at 10%, 30%, or 50% BL, respectively. Note that n values for MRN cell group apply to all other neuron cell groups, as well. Statistics (Kruskal-Wallis with Dunn’s multiple comparisons posttest):
P < 0.05;
P < 0.01;
P < 0.001 compared with percentages for HRP application at 20% BL.
P < 0.05;
P < 0.01;
P < 0.001 compared with percentages for HRP application at 40% BL.
Table 2.
Percent retrograde labeling for large identified RS neurons following spinal transections at different rostrocaudal levels
| Normal | 4 wk | 6 wk | 8 wk | 16 wk | 32 wk | |
|---|---|---|---|---|---|---|
| M cells | ||||||
| 20% BL | 100.0 ± 5.7 (9) | 4.9 ± 8.3 (7) | 19.4 ± 20.6 (7) | 46.7 ± 28.3 (8) | 50.9 ± 24.0 (5) | 67.9 ± 22.2 (8) |
| 40% BL | 100.0 ± 9.8 (15) | 0.0 ± 0.0 (10) | 8.2 ± 13.8 (6) | 23.5 ± 16.1 (7) | 52.2 ± 26.4 (6) | 47.6 ± 29.1* (9) |
| 60% BL | 100.0 ± 0.0 (7) | 0.0 ± 0.0 (9) | 3.3 ± 9.3* (15) | 10.4 ± 15.3** (8) | 42.4 ± 22.8 (11) | 45.8 ± 14.8 (8) |
| I cells | ||||||
| 20% BL | 100.0 ± 19.3 | 7.9 ± 15.7 | 31.6 ± 26.2 | 39.8 ± 11.6 | 55.4 ± 32.5 | 60.6 ± 10.3 |
| 40% BL | 100.0 ± 6.8 | 0.0 ± 0.0 | 2.1 ± 5.2* | 12.7 ± 24.3* | 38.1 ± 25.4 | 62.1 ± 17.3 |
| 60% BL | 100.0 ± 9.8 | 0.0 ± 0.0 | 1.7 ± 6.7** | 3.2 ± 6.0** | 36.5 ± 18.2 | 42.1 ± 18.0*† |
| B cells | ||||||
| 20% BL | 100.0 ± 11.9 | 8.0 ± 14.1 | 24.1 ± 13.7 | 47.8 ± 14.4 | 49.5 ± 6.2 | 59.1 ± 16.7 |
| 40% BL | 100.0 ± 7.2 | 0.0 ± 0.0 | 1.7 ± 4.2** | 5.9 ± 8.1** | 29.1 ± 18.9* | 38.8 ± 20.4* |
| 60% BL | 100.0 ± 3.8 | 0.0 ± 0.0 | 0.7 ± 2.6*** | 5.1 ± 10.8*** | 32.3 ± 22.6* | 41.8 ± 13.8* |
| Mau and AM | ||||||
| 20% BL | 100.0 ± 13.6 | 7.8 ± 13.3 | 23.4 ± 18.8 | 30.7 ± 17.5 | 54.5 ± 38.6 | 78.4 ± 22.8 |
| 40% BL | 100.0 ± 9.4 | 0.0 ± 0.0 | 4.2 ± 10.2* | 14.3 ± 19.7 | 41.7 ± 40.8 | 50.0 ± 17.7** |
| 60% BL | 100.0 ± 0.0 | 0.0 ± 0.0 | 0.0 ± 0.0*** | 2.8 ± 8.3** | 40.9 ± 32.2 | 43.8 ± 25.9** |
Percentages (means ± SD) in each row are normalized values relative to the corresponding numbers of retrogradely labeled neurons in normal animals (see methods). Locations at 20%, 40%, or 60% BL are HRP application sites in the spinal cords of normal animals as well as experimental animals at various recovery times following spinal transections at 10%, 30%, or 50% BL, respectively. Note that n values for MRN cell group apply to all other neuron cell groups, as well. Statistics (Kruskal-Wallis with Dunn’s multiple comparisons posttest):
P < 0.05; **P < 0.01; ***P < 0.001 compared with percent values for HRP application at 20% BL; percent values for HRP application at 60% BL were not significantly different from those for HRP application at 40% BL.
Test of Support for Axonal Regeneration in Different Spinal Cord Regions
Control experiments tested if possible differences in axonal regeneration following rostral or more caudal spinal cord transections were due, in part, to differences in the degree to which regeneration is supported by different spinal regions. The spinal cord was transected at 20% BL (n = 6 animals) or 50% BL (n = 14), and after a 6-wk recovery time, HRP was applied to the spinal cord at 30% or 60% BL, respectively (Fig. 3, A and B). In addition to counting the numbers of retrogradely labeled descending brain (B) neurons in the two experimental groups, descending propriospinal (PS) neurons were counted in a spinal cord region equal to 10% BL (~10 mm) above the lesion sites (i.e., 10–20% BL or 40–50% BL; shaded areas in Fig. 3, A and B). It should be noted that descending PS neurons are distributed along both of these regions of spinal cord (Rouse and McClellan 1997). The numbers of B and PS neurons in these experimental animals were expressed as a percentage of the corresponding numbers of labeled neurons in normal animals in which HRP was applied to the spinal cord at 30% BL (n = 5) or 60% BL (n = 7). The percentages for labeled B and PS neurons for spinal transections at 20% or 50% BL were compared using Kruskal-Wallis with Dunn’s multiple comparisons posttest, and the P values were further adjusted using the Holm FWER (see above).
Fig. 3.
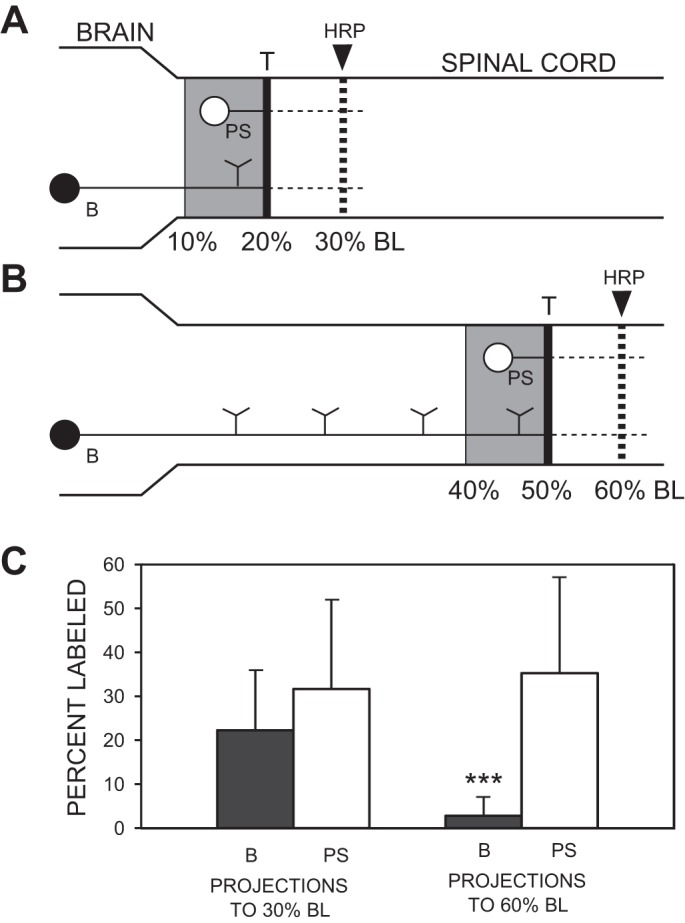
Comparison of axonal regeneration of descending brain (B) neurons and descending propriospinal (PS) neurons following rostral or caudal spinal transections (T). A and B: at 6-wk recovery times following spinal transections at 20% BL (rostral; A) or 50% BL (caudal; B), HRP was applied to the spinal cord at 30% or 60% BL, respectively. The PS neurons were counted in a spinal cord region equivalent to 10% BL (~10 mm) above the spinal transection sites (shaded areas: 10–20% BL for rostral spinal transections, 40–50% BL for caudal transections). Labeled neurons in these experimental animals are expressed as a percentage of the mean numbers of labeled B and PS neurons in normal animals in which HRP was applied at 30% or 60% BL. C: following spinal cord transections at 20% BL, 22.3 ± 13.7% and 31.7 ± 20.4% of the normal numbers of B neurons (filled bars) and PS neurons (open bars), respectively, were labeled that projected to 30% BL (left pair of bars), and these percentages were not statistically different (n = 6 animals). Following spinal transections at 50% BL, 2.8 ± 4.2% and 35.3 ± 21.7% of the normal numbers of B and PS neurons, respectively, were labeled that projected to 60% BL (right pair of bars), and these percentages were significantly different (n = 14 animals). Statistics: ***P < 0.001 (Kruskal-Wallis with Dunn’s multiple comparisons posttest).
Recordings of Locomotor Muscle Burst Activity
Muscle recording experiments were performed to determine if the rate and completeness of recovery of locomotor muscle burst activity are dependent on the rostrocaudal level of spinal cord transections. To maximize possible differences in experimental animals, the spinal cords were transected at 10% BL (rostral, n = 48 animals) or 50% BL (caudal, n = 57; Figs. 4A and 5A). At various recovery times (0–1, 2–3, 4–6, 7–8, or 11–24 wk), muscle recording electrodes (1–4 in Figs. 4A and 5A) were inserted bilaterally in body muscles at 20% and 40% BL for the animals with rostral spinal cord transections or at 40% and 60% BL for animals with caudal spinal transections, as previously described (Benthall et al. 2017; Davis et al. 1993; McClellan et al. 2016). In normal animals, muscle recording electrodes were inserted bilaterally at 20% BL and 40% BL (n = 17), or at 20% BL (bilaterally), 40% BL (right side), and 60% BL (right side) (n = 12).
Fig. 4.

Recovery of locomotor muscle burst activity following rostral spinal transections. A: diagram of larval lamprey with a rostral spinal transection at 10% BL (T) and muscle recording electrodes at 20% BL (channels 1 and 2) and 40% BL (channels 3 and 4). B1–B4: at 2-wk recovery times, there was some very weak muscle activity below the lesion site (channels 1 and 2; channel gains were increased to show this weak activity). With increasing recovery times (4–8 wk), swimming movements gradually recovered and were accompanied by recovery of locomotor muscle burst activity at progressively more caudal distances below the spinal lesion site. At 8-wk recovery times, muscle activity was characterized by left-right alternation (1↔2 and 3↔4) as well as a rostrocaudal phase lag (1→4 and 2→3; see Table 3), similar to those for normal animals (n = 29; not shown; see Benthall et al. 2017; Davis et al. 1993; McClellan et al. 2016).
Fig. 5.

Recovery of locomotor muscle burst activity following caudal spinal transections. A: diagram of animal with a caudal spinal transection at 50% BL (T) and muscle recording electrodes at 40% BL (channels 1 and 2) and 60% BL (channels 3 and 4). B1–B4: at 2-wk recovery times during swimming-like movements, left-right alternating muscle burst activity was present above the spinal lesion site (1↔2), but there was little or no muscle activity below the lesion site (channels 3 and 4). With increasing recovery times (4–8 wk), some locomotor muscle burst activity began to appear below the spinal lesion site (Fig. 6, Table 3). However, even at 8 wk, muscle burst activity below the lesion site was weak or absent. Note that the thicker traces for channels 3 and 4 indicate higher gains and weaker activity for these recording channels.
Following recovery from anesthesia, the oral hood (anterior head) was stimulated electrically with a handheld stimulating electrode probe (0.1–2.0 mA, 2-ms pulses at 100 Hz for 50 ms; electrode tips ~1–2 mm from oral hood) or mechanically (forceps) to elicit swimming muscle burst activity, which was recorded on tape, as previously described (Benthall et al. 2017; Davis et al. 1993; McClellan et al. 2016). Simultaneously, swimming movements were videotaped with an S-VHS camera, and a custom video frame counter synchronized the video recordings and muscle activity recordings, as previously described (Davis et al. 1993; McClellan et al. 2016). Following muscle recordings, animals were reanesthetized, the body lengths were measured, and the numbers of segments between ipsilateral recording electrodes were counted (1→4, 2→3; Figs. 4A and 5A).
The recorded muscle burst activity was played back and acquired using a custom data acquisition/analysis system, as previously described (Jackson et al. 2007; Shaw et al. 2010). The following parameters of locomotor activity were calculated, as previously defined and described in detail (Davis et al. 1993; McClellan and Hagevik 1997; McClellan et al. 2016): cycle times, burst proportions (BP1–BP4; 1–4 in Figs. 4A and 5A), intersegmental rostrocaudal phase lags (Φ2→3 or Φ1→4), and right-left phase values (Φ2–1 or Φ3–4).
Right and left burst proportions for a given level of the body (e.g., BP1 and BP2 at 20% BL in Fig. 4A) were averaged to yield BP20% BL, BP40% BL, and BP60% BL (Table 3), as previously described and justified (Benthall et al. 2017). In addition, right and left rostrocaudal phase lags for a given body region were averaged to yield Φ20–40% BL and Φ40–60% BL. A given locomotor parameter for normal animals was compared with those for experimental animals at various recovery times following spinal transections at 10% BL or 50% BL using a single ANOVA with Dunnett multiple comparisons posttest. Also, in animals with spinal transections at 50% BL, the percentage of cycles with burst activity below the lesion site was calculated and compared statistically to 100% (1-sample t-test or Wilcoxon rank sum test; Fig. 6).
Table 3.
Parameters of locomotor muscle burst activity in normal animals and in animals following spinal transections at different rostrocaudal levels
| n | T, ms | BP20% BL | BP40% BL | Φ20–40% BL | ΦRT-LT (20% BL) | ΦRT-LT (40% BL) | |
|---|---|---|---|---|---|---|---|
| Normal animals | |||||||
| 29 | 323 ± 81 | 0.330 ± 0.048 | 0.294 ± 0.037 | 0.0070 ± 0.0015 | 0.482 ± 0.036 | 0.503 ± 0.022 | |
| Spinal transections at 10% BL (rostral) | |||||||
| 0–1 wk | 6 | ||||||
| 2–3 wk | 8 | 341 ± 90 | 0.331 ± 0.026 | 0.250 ± 0.059 | 0.0077 ± 0.0020 | 0.466 ± 0.019 | |
| 4–6 wk | 6 | 297 ± 61 | 0.393 ± 0.025** | 0.289 ± 0.039 | 0.0073 ± 0.0012 | 0.495 ± 0.016 | 0.447 ± 0.036 |
| 7–8 wk | 12 | 293 ± 64 | 0.350 ± 0.035 | 0.273 ± 0.044 | 0.0073 ± 0.0018 | 0.477 ± 0.018 | 0.470 ± 0.032 |
| 11–24 wk | 12 | 311 ± 57 | 0.369 ± 0.048* | 0.293 ± 0.037 | 0.0082 ± 0.0024 | 0.497 ± 0.024 | 0.504 ± 0.029 |
| n | T, ms | BP40% BL | BP60% BL | Φ40–60% BL | ΦRT-LT (40% BL) | ΦRT-LT (60% BL) | |
|---|---|---|---|---|---|---|---|
| Spinal transections at 50% BL (caudal) | |||||||
| 0–1 wk | 8 | 276 ± 40 | 0.335 ± 0.031 | 0.503 ± 0.014 | |||
| 2–3 wk | 13 | 276 ± 67 | 0.284 ± 0.060 | 0.191 ± 0.076** | 0.0082 ± 0.0063 | 0.499 ± 0.021 | 0.516 ± 0.0 |
| 4–6 wk | 13 | 326 ± 189 | 0.317 ± 0.070 | 0.232 ± 0.041* | 0.0048 ± 0.0012 | 0.503 ± 0.020 | 0.482 ± 0.106 |
| 7–8 wk | 8 | 260 ± 41 | 0.300 ± 0.051 | 0.239 ± 0.035 | 0.0079 ± 0.0032 | 0.504 ± 0.017 | 0.476 ± 0.070 |
| 11–23 wk | 14 | 311 ± 40 | 0.357 ± 0.046** | 0.275 ± 0.051 | 0.0055 ± 0.0012 | 0.498 ± 0.013 | 0.495 ± 0.031 |
Locomotor parameters are means ± SD. No value is available for ΦRT-LT (40% BL) at 2–3 wk because right and left bursts were inconsistent and did not occur together in the same cycles. BP60% BL values were compared with mean value of 0.299 ± 0.069 (n = 12) for normal animals (not shown). Φ40–60% BL values were compared with mean value of 0.0068 ± 0.0018 (n = 12) for normal animals (not shown). ΦRT-LT (60% BL) was not measured in normal animals, but the values in experimental animals were not significantly different from 0.5 (1-sample t-test); there was only one animal with right-left burst activity at 60% BL at 2–3 wk. Statistics (ANOVA with Dunnett multiple comparisons posttest):
P < 0.05; **P < 0.01 (compared with normal animals).
Fig. 6.
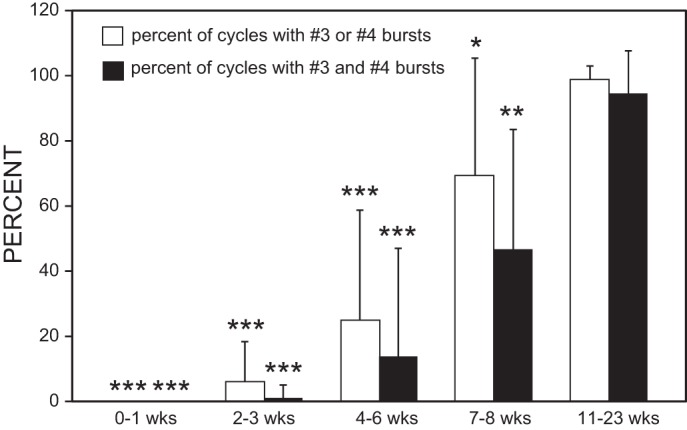
Plot of percentages of cycles (means and SD) that displayed locomotor muscle burst activity at 60% BL (recording channels 3 and 4 in Fig. 5A), below a caudal spinal lesion site at 50%, vs. recovery time. Open bars indicate the percentage of cycles in which there was locomotor burst activity on the right (channel 3) or left side (channel 4) at 60% BL. Filled bars indicate the percentage of cycles in which there was locomotor burst activity at 60% BL on both right and left sides in the same cycle. In contrast, at 3 wk following rostral spinal transections (Fig. 4A), right-left alternating burst activity was reliably present (i.e., 100%) right below the spinal lesion site (Table 3). Statistics: *P ≤ 0.05; **P ≤ 0.01; ***P ≤ 0.001 compared with 100% (1-sample t-test or Wilcoxon rank sum test).
Intracellular Recordings from Injured and Uninjured RS Neurons
These experiments determined if the biophysical properties and development of the “injury phenotype” (see Introduction) in injured RS neurons are dependent on the rostrocaudal location of SCIs. To maximize possible experimental differences, a right spinal cord hemi-transection (HT) was made at 10% BL or 50% BL. Because Müller cells have ipsilateral descending axons (Rovainen 1978; Shaw et al. 2010), right spinal HTs ideally will injure (axotomize) right identified RS neurons (Müller cells: M, I, and B cells in Fig. 1B, bottom) while leaving left neurons uninjured, as previously described (McClellan et al. 2008). Lamprey identified and unidentified RS neurons display similar electrical properties in response to rostral SCI (McClellan et al. 2008), and therefore in the present study identified RS neurons (Müller cells) were used as general representatives of lamprey RS neurons.
In the present study, after recovery times of 2 wk (n = 8 animals, HT at 10% BL; n = 5 animals, HT at 50% BL), 4 wk (n = 7; n = 5), or 6 wk (n = 10; n = 5), brains and rostral spinal cords were removed and transferred to a recording chamber containing lamprey Ringer’s solution (~6–8°C), as previously described (McClellan et al. 2008; Pale et al. 2013). A suction electrode was placed on the dorsal surface of the spinal cord above the HT (SC1), and a second suction electrode was placed around the caudal spinal cord below the HT (SC2; Figs. 7A and 8A). These spinal cord electrodes were used to monitor orthodromic responses elicited by action potentials in RS neurons and to test the injury status of the neurons (e.g., arrows in Fig. 7B3), as previously described (McClellan et al. 2008). Intracellular recordings were made from uninjured identified RS neurons (mostly left side of brain; see Fig. 1B, bottom, and Figs. 7A and 8A) and injured neurons (mostly right side) using micropipettes filled with 5 M K-acetate (~60–80 MΩ) that were attached to a probe box for an Axoclamp 2A amplifier (Molecular Devices, Sunnyvale, CA) (see McClellan et al. 2008). Neurons were considered “healthy” if they had resting potentials (Vrest) less than or equal to –65 mV and overshooting action potentials (>0 mV; however, the average action potential amplitude was >100 mV). Intracellular recording data initially were stored on tape and later acquired with a custom data acquisition/analysis system, as described above for the muscle activity data.
Fig. 7.

A: diagram (not to scale) of isolated brain (left) and upper spinal cord (right) showing right spinal hemi-transection (HT) at 10% BL, intracellular recording micropipette (IC), and extracellular recording electrodes above (SC1) and below (SC2) the HT. Because Müller cells have ipsilateral descending axons, most identified RS neurons on the right side of the brain (filled circle) were injured due to the HT, whereas most left neurons (open circle) were uninjured (see McClellan et al. 2008). B and C: recordings from uninjured “B1” neuron (B; see Fig. 1B) and injured B1 neuron (C) in the same brain at 2 wk following a right spinal HT. B1 and C1: the uninjured B1 neuron fired a smooth train of action potentials (Vm) in response to depolarizing current pulses (Im), whereas the injured B1 neuron fired short repetitive bursts. Freq, instantaneous firing frequency. B2 and C2: evoked action potentials. B3 and C3: for the uninjured B1 neuron, the main depolarizing phase of action potentials was followed by 3 sequential afterpotentials: fAHP, ADP, and sAHP (arrowhead; see methods). In contrast, action potentials in the injured B1 neuron were followed by only the fAHP. Action potentials in the uninjured B1 neuron elicited orthodromic responses (arrows) above (SC1) and below (SC2) the spinal HT, whereas the injured B1 neuron did not elicit orthodromic responses, possibly because of axonal dieback. Scale bars: 50 mV/6.5 nA/32 Hz and 3 s (B1, C1); 40 mV/3 ms (B2, C2); and 5.5 mV/80 ms (B3, C3).
Fig. 8.

A: diagram (not to scale) of isolated brain (left) and upper spinal cord (right) showing right spinal HT at 50% BL (see legend for Fig. 7). Most identified RS neurons (Müller cells) on the right side of the brain (filled circle) were injured due to the HT, whereas most left RS neurons (open circle) were uninjured (see McClellan et al. 2008). B and C: recordings from uninjured (B) and injured (C) “B1” neurons in the same brain at 2 wk following right spinal HT. B1 and C1: uninjured and injured B1 neurons both fired a smooth train of action potentials (Vm) in response to depolarizing current pulses (Im). Freq, instantaneous firing frequency. B2 and C2: evoked action potentials. B3 and C3: for both uninjured and injured B1 neurons, the main depolarizing phase of action potentials was followed by 3 sequential afterpotentials: fAHP, ADP, and sAHP (arrowheads; see methods). Action potentials in the uninjured B1 neuron elicited orthodromic responses (arrows) above (SC1) and below (SC2) the spinal HT, whereas the injured B1 neuron elicited orthodromic responses (arrow) only above (SC1) the HT. Scale bars: 50 mV/6.5 nA/32 Hz and 3 s (B1, C1); 40 mV/3 ms (B2, C2); and 2.6 mV/80 ms (B3, C3).
With the continuous current-clamp (“Bridge”) mode, individual RS neurons were stimulated (1–10 ms, +10-nA pulses) to elicit action potentials. The resting membrane potentials (Vrest) and amplitudes of action potentials (VAP) were measured, as previously described (McClellan et al. 2008; Pale et al. 2013). In addition, the amplitudes of three sequential afterpotential components were measured (Fig. 7B3), as previously described (McClellan et al. 2008; Pale et al. 2013): fAHP; ADP; and sAHP (see Introduction). With the discontinuous current-clamp mode (DCC; fs ≥ 6 kHz), 2-s depolarizing current pulses (+1–10 nA) were applied to examine repetitive firing patterns. In addition, 200-ms hyperpolarizing and depolarizing current pulses were applied to measure membrane input resistance (Rin = ΔVm/ΔIm) and the threshold for action potentials (Vth), respectively. The electrical parameters for uninjured RS neurons at 2 wk following spinal HTs at 10% or 50% BL were pooled together (control; first row in Table 4). Each neurophysiological parameter (Vrest, Rin, VAP, Vth, VfAHP, VADP, and VsAHP) for uninjured RS neurons was compared with those for injured neurons at the three recovery times (2, 4, and 6 wk) following spinal HTs at 10% or 50% BL using a single ANOVA with Dunnett multiple comparisons posttest or Kruskal-Wallis with Dunn’s multiple comparisons posttest. Statistical significance was assumed for P ≤ 0.05.
Table 4.
Biophysical properties of RS neurons at different recovery times following rostral (10% BL) or caudal (50% BL) spinal cord HTs
| N | Vrest, mV | Rin, MΩ | Vth, mV | VAP, mV | VfAHP, mV | VADP, mV | VsAHP, mV | |
|---|---|---|---|---|---|---|---|---|
| Control (uninjured, 2 wk) | 34 | −75.7 ± 4.5 | 7.84 ± 3.36 | 16.4 ± 6.6 | 103.3 ± 7.0 | −4.24 ± 3.95 | 2.02 ± 1.58 | −1.57 ± 1.31 |
| 10% BL HT | ||||||||
| 2 wk | 57 | −74.2 ± 5.2 | 7.39 ± 3.72 | 24.9 ± 8.2** | 105.9 ± 9.6 | −11.92 ± 4.63*** | 0.03 ± 0.16*** | −0.27 ± 1.13*** |
| 4 wk | 21 | −74.6 ± 5.2 | 8.35 ± 3.51 | 28.3 ± 10.6** | 106.0 ± 12.3 | −9.36 ± 4.74** | 0.03 ± 0.13*** | −0.21 ± 0.54*** |
| 6 wk | 35 | −73.4 ± 4.9 | 8.26 ± 4.21 | 24.6 ± 9.4** | 105.3 ± 8.9 | −9.85 ± 4.80*** | 0.35 ± 1.12*** | −0.28 ± 0.61*** |
| 50% BL HT | ||||||||
| 2 wk | 32 | −76.4 ± 5.0 | 6.84 ± 2.75 | 19.7 ± 5.5 | 100.8 ± 11.7 | −3.89 ± 4.27 | 2.43 ± 2.41 | −1.38 ± 1.07 |
| 4 wk | 20 | −73.6 ± 3.4 | 6.83 ± 3.47 | 18.1 ± 5.1 | 102.0 ± 9.9 | −3.39 ± 2.97 | 1.81 ± 1.95 | −1.08 ± 1.19 |
| 6 wk | 37 | −76.2 ± 4.9 | 8.56 ± 3.22 | 18.1 ± 5.7 | 103.5 ± 7.0 | −3.06 ± 2.31 | 2.20 ± 1.53 | −1.80 ± 1.14 |
Values are means ± SD; N is no. of neurons (each group includes uninjured or injured RS neurons, regardless of side of brain). Control values are pooled data for uninjured RS neurons (mostly left side of brain) at 2-wk recovery times following right spinal HTs at 10% or 50% BL. Remaining values are for injured RS neurons (mostly right side of brain) following right spinal HTs at 10% or 50% BL. Statistics (ANOVA with Dunnett multiple comparisons posttest or Kruskal-Wallis with Dunn’s multiple comparisons posttest):
P < 0.01; ***P < 0.001 compared with properties of uninjured neurons in control group.
After a review of the repetitive firing patterns (Vm) and instantaneous firing frequencies of RS neurons (Figs. 7B1, 7C1, 8B1, and 8C1), we divided the firing patterns into the following four categories (Fig. 9) (see Benes 2006): 1) regular, smooth firing: firing frequency displayed a gradual decrease of no more than 40%, and only one instantaneous firing frequency was below 60% of the maximum; 2) irregular firing: two or more instantaneous firing frequencies were below 60% of the maximum frequency; 3) high spike frequency adaptation (high SFA): neurons fired several action potentials at the beginning of the 2-s depolarizing current pulse and then stopped firing during the remainder of the pulse; and 4) bursting: some instantaneous firing frequencies were below 50% of the maximum frequency and were then followed by spike frequencies that were 75–100% of the maximum. To be assigned to one of the four categories, neurons had to consistently display the same firing pattern for at least two above-threshold depolarizing current pulses.
Fig. 9.

A: animals with right spinal HTs at 10% BL (rostral; see Fig. 7A). Graphs show percentages of uninjured and injured RS neurons displaying different firing patterns (regular, irregular, high SFA, or bursting; see methods) at recovery times of 2 (A1), 4 (A2), and 6 wk (A3). B: animals with right spinal HTs at 50% BL (caudal; see Fig. 8A). Graphs show percentages of uninjured and injured RS neurons displaying different firing patterns at recovery times of 2 (B1), 4 (B2), and 6 wk (B3). Numbers above each bar indicate the total number of neurons for each condition: recovery times (2, 4, or 6 wk) and locations of right spinal HT (10% or 50% BL).
Temperature Dependence of Axonal Transport and Recovery Following SCI
For spinal cord-injured lampreys, recovery at ~12°C results in a significant decrease in the restoration of coordination of locomotor activity compared with recovery at room temperature (~22°C) (Cohen et al. 1999). In addition, it is well known that HRP is transported actively in axons (Meller 1992), and that axonal transport and axonal regeneration are substantially reduced at cold temperatures (Edström and Hanson 1973; Brimijoin et al. 1979; Cancalon 1985). First, in the present study, experiments were performed to determine the extent to which cold temperatures (~4–5°C) affect retrograde axonal transport in the lamprey. Second, following rostral SCI, the effects of cold temperatures (~4–5°C) on behavioral recovery, axonal regeneration of descending brain neurons, and development of the altered electrical properties of injured RS neurons (i.e., injury phenotype; see Introduction) were tested.
Retrograde axonal transport.
For animals that were acclimated to room temperature (~23°C), the spinal cords were exposed and transected at 40% BL (n = 5 animals) or 60% BL (n = 7), and HRP was applied to the spinal transection site, as described above. Animals recovered for a few hours at room temperature before being transferred to ~4–5°C, which is in the lower range of temperatures experienced by larval sea lampreys in the wild. Following a tracer transport time of 14–21 days, brains and spinal cords were removed, reacted for HRP, and analyzed to determine the numbers of retrogradely labeled descending brain neurons, as described above.
Behavioral and histological procedures.
For animals that had acclimated to room temperature, the spinal cords were exposed and transected at 10% BL. A few hours following spinal transections, animals were transferred to ~4–5°C and recovered for 2 wk (n = 3 animals), 4 wk (n = 4), 8 wk (n = 4), or 16 wk (n = 4). At each recovery time, a few animals were gradually acclimated to room temperature over the course of 1–2 days and then were used for behavioral evaluation and histological procedures.
Animals for each of the recovery times were placed individually in a swim chamber (24 × 44 cm) and videotaped with an S-VHS camera. Because these animals displayed virtually no locomotor recovery, electrical stimulation was applied to the head or tail (1–10 mA, 2-ms pulses at 100 Hz for 50 ms) in an attempt to elicit responses and assess the behavioral capabilities of the animals. Subsequently, HRP was applied to the spinal cord at 20% BL. After a ~14-day retrograde transport time, the brains and rostral spinal cords were removed, reacted for HRP, and analyzed to determine the numbers of retrogradely labeled descending brain neurons that had regenerated their axons, as described above.
Intracellular recordings from RS neurons.
Animals that had acclimated to room temperature (n = 8 animals) received right spinal cord HTs at 10% BL, as described above, and then recovered at ~4–5°C for 2–17 wk. Following recovery, isolated brain-spinal cord preparations were set up (Fig. 10A), and intracellular recordings were made from uninjured RS neurons (left neurons; N = 7 neurons) and injured neurons (right neurons; N = 30). Firing patterns and electrical properties were determined, as described above. Following recovery at ~4–5°C, the electrical properties of uninjured and injured RS neurons (Vrest, Vth, VAP, VfAHP, VADP, and VsAHP) did not vary significantly with recovery time (P > 0.05, regression analysis; see results), and therefore the data were pooled into single “uninjured” and “injured” data sets (Table 5). Each electrical parameter for uninjured and injured RS neurons was compared using an unpaired t-test (Table 5).
Fig. 10.

A: diagram of isolated brain/spinal cord preparation from an animal that recovered at ~4–5°C for 4 wk following a right spinal HT at 10% BL showing intracellular micropipette (IC) and extracellular electrodes above (SC1) and below (SC2) the HT. Identified RS neurons on the right side of the brain (filled circle) were injured due to the HT, whereas left neurons (open circle) were uninjured (see McClellan et al. 2008). B1 and C1: uninjured and injured RS neurons, respectively, in the same brain both fired a smooth train of action potentials (Vm) in response to depolarizing current pulses (Im). Freq, instantaneous firing frequency. B2 and C2: action potentials, recorded from the same neurons as in B1 and C1, were followed by 3 similar sequential afterpotentials: fAHP, ADP, and sAHP. For the uninjured RS neuron (B2), orthodromic responses (arrows) were recorded above (SC1) and below (SC2) the spinal HT, whereas for the injured RS neuron (C2), orthodromic responses (arrow) only occurred above the HT.
Table 5.
Biophysical properties of uninjured and injured RS neurons following right spinal HTs at 10% BL and recovery at ~4–5°C
| N | Vrest, mV | Vth, mV | VAP, mV | VfAHP, mV | VADP, mV | VsAHP, mV | |
|---|---|---|---|---|---|---|---|
| Uninjured | 7 | −78.3 ± 4.9 | 14.9 ± 3.4 | 108.8 ± 5.0 | −3.39 ± 2.07 | 3.96 ± 1.20 | −2.09 ± 0.74 |
| Injured | 30 | −77.3 ± 6.7 | 15.6 ± 3.9 | 105.8 ± 8.2 | −3.71 ± 2.09 | 3.80 ± 1.80 | −1.87 ± 0.67 |
Values are means ± SD for uninjured RS neurons (left side of brain) and injured RS neurons (right side of brain). Following a right spinal HT at 10% BL and recovery at ~4–5°C for 2–17 wk (see methods), the properties of injured RS neurons were not significantly different from those for uninjured RS neurons (unpaired t-test). Also, the above parameters for injured RS neurons did not appear to differ substantially from those of uninjured lamprey RS neurons reported in a previous study (not shown; N = 31 neurons, McClellan et al. 2008).
RESULTS
Axonal Regeneration Following Spinal Transections at Different Rostrocaudal Locations
Descending brain neurons.
With increasing recovery times following spinal cord transections at 10%, 30%, or 50% body length (BL; normalized distance from anterior head; Fig. 1A), there was a gradual increase in the percentages for retrogradely labeled descending brain neurons projecting to 20%, 40%, or 60% BL, respectively (Fig. 2). Similar results previously have been described for spinal transections at 10% BL in larval lampreys (Davis and McClellan 1994a). In the current study, at all recovery times (4–32 wk) following spinal transections at 50% BL, the percentages for labeled descending brain neurons were significantly less than those for spinal transections at 10% BL (Kruskal-Wallis with Dunn’s multiple comparisons posttest; Fig. 2, A and C). For spinal transection at 30% BL, although all the mean percentages for labeling were less than those for transections at 10% BL, only the percent labeling for 32 wk was significantly less (Fig. 2, A and B). However, for 10% BL vs. 30% BL comparisons, the P values for 4-, 6-, and 8-wk recovery times were between 0.05 and 1.0. In summary, spinal transections at 10% BL appeared to be a stronger stimulus for and resulted in greater axonal regeneration of descending brain neurons, in general, than spinal cord injury at 50% BL.
Unidentified RS neurons.
Following spinal transections at the three rostrocaudal levels, virtually all reticular cell groups (MRN, ARRN, MRRN, and PRRN; Fig. 1B, top) displayed a gradual increase in the percentages for labeled unidentified RS neurons with increasing recovery times (Table 1). The percentages for labeled neurons in the 10% and 50% BL experimental groups were significantly different for almost all (32 of 35) of the statistical comparisons (Kruskal-Wallis with Dunn’s multiple comparisons posttest; Table 1). It should be noted that for experimental animals, the few percentage values greater than 100% at long recovery times (e.g., aARRN, mARRN) very likely indicated that these RS neurons projected for greater distances than in normal animals (see similar results in Fig. 7A, B, and F in Davis and McClellan 1994a). In the present study, the percentages for labeled neurons in the 10% BL and 30% BL experimental groups were significantly different for about one-third (11 of 35) of the statistical comparisons (Table 1). However, for an additional 7 of 35 of these comparisons, the P values were between 0.05 and 0.10. Thus spinal cord transections at 10% BL appeared to be a stronger stimulus for axonal regeneration of unidentified RS neurons than spinal transections at 50% BL.
Identified RS neurons.
Following spinal transections at the three rostrocaudal levels, virtually all groups of identified RS neurons (M, I, B, and Mauthner cells; Fig. 1B, bottom) displayed a gradual increase in the percent labeling with increasing recovery times (Table 2). Similar results previously have been described for spinal transections at 10% BL in larval lampreys (Davis and McClellan 1994b). In general, the smaller identified RS neurons (I3, I4, B2, B5, AM) had higher percent regeneration values, indicative of higher intrinsic regeneration capacities, than the larger identified RS neurons, as previously described (Davis and McClellan 1994b). For rostral SCI (10% BL), the percent regeneration values were, for the most part, in a range similar to those we have previously published (Davis and McClellan 1994b; Zhang et al. 2002). In the present study, the percentages for labeled identified RS neurons following spinal transections at 50% were significantly less than those for transections at 10% BL for 12 of 20 of the statistical comparisons (Kruskal-Wallis with Dunn’s multiple comparisons posttest; Table 2). The percentages for labeled neurons in the 10% and 30% BL experimental groups were significantly different for 9 of 20 of the statistical comparisons (Table 2), but the P values were between 0.05 and 0.10 for an additional 2 comparisons. In summary, spinal cord transections at 10% BL appeared to be a stronger stimulus for axonal regeneration of identified RS neurons than spinal cord injury at 50% BL.
Support of Axonal Regeneration in Different Rostrocaudal Levels of the Spinal Cord
Although rostral spinal cord transections resulted in greater axonal regeneration of descending brain neurons than caudal lesions (Fig. 2; Tables 1 and 2), in theory this may have been due to differences in environmental support for regeneration in different spinal cord regions. This possibility was tested for transections at two different rostrocaudal levels of the spinal cord and by comparing axonal regeneration of descending brain (B) neurons as well as regeneration of descending propriospinal (PS) neurons that were located within a 10% BL region (~10 mm) above the lesion sites (shaded areas in Fig. 3, A and B; see methods). At 6 wk following rostral spinal cord transections at 20% BL, the percent labeling of descending B neurons was not significantly different than that for descending PS neurons (Kruskal-Wallis with Dunn’s multiple comparisons posttest; Fig. 3C, left pair of bars). In contrast, following more caudal spinal transections at 50% BL, the percent labeling of descending B neurons was significantly less than that for PS neurons (Fig. 3C, right pair of bars; P < 0.001). Also, the percent labeling of descending brain neurons was significantly greater for rostral vs. caudal spinal cord injury (P < 0.05), whereas the percent labeling for PS neurons was not significantly different for the two spinal lesion sites. Thus differences in axonal regeneration following rostral or caudal SCI (Fig. 2; Tables 2 and 3) probably were not due to environmental differences in the support for axonal regeneration along the spinal cord.
Locomotor Recovery following Rostral or Caudal Spinal Cord Injury
For normal larval lampreys, muscle burst activity during swimming was characterized by two features (n = 29, not shown; see Benthall et al. 2017; Davis et al. 1993; McClellan et al. 2016): left-right alternation of activity at each level of the body, and a rostrocaudal phase lag for ipsilateral activity. In addition, locomotor muscle burst activity is reliably present all along the body. Following rostral (10% BL) or caudal (50% BL) spinal cord transections, the time course and completeness of recovery of locomotor muscle burst activity was quite different. First, for rostral spinal transections at 10% BL (Fig. 4A), at short recovery times (0–1 wk) there was no swimming behavior and virtually no coordinated muscle burst activity below the lesion site (Table 3), as previously described (Davis et al. 1993). Between 2 and 3 wk, swimming behavior and muscle burst activity began to recover (Fig. 4B). At 2-wk recovery times, coordinated muscle burst activity was present at 20% BL in only 1 of 4 animals, whereas for recovery times ≥3 wk, burst activity was reliably present at 20% BL for all animals. For recovery times of 3–8 wk, the probability of muscle burst activity at 40% and 60% BL gradually increased to 100% and 83% of the cycles, respectively, as previously shown (Davis et al. 1993). Following spinal transections at 10% BL, almost all of the parameters of the locomotor muscle burst patterns that were present at the various positions along the body were not significantly different compared with those for normal animals (Table 3).
Second, for caudal spinal transections at 50% BL (Fig. 5A), at all recovery times animals could swim due to muscle burst activity above the lesion site (channels 1 and 2 in Fig. 5B). At the shortest recovery times (0–1 wk), no muscle burst activity was present below the lesion site (Fig. 6; channels 3 and 4 in Fig. 5A). At longer recovery times (≥2 wk), there was a gradual increase in the percentage of cycles in which locomotor muscle burst activity was present below the caudal lesion site (Fig. 6; see channels 3 and 4 in Fig. 5B). However, even at recovery times up to 8 wk, locomotor muscle burst activity below the caudal spinal lesion site often was inconsistent (Fig. 6) and weak or absent (note that the thicker traces for channels 3 and 4 in Fig. 5B indicate higher gains for these channels). At the longest recovery times (11–23 wk), locomotor muscle burst activity recorded at 60% BL, below the caudal spinal lesion site, occurred for most cycles (Fig. 6). Thus, for all recovery times except 11–23 wk, the percentage of cycles with burst activity below the spinal lesion site was significantly less than 100% (1-sample t-test or Wilcoxon rank sum test; Fig. 6). Following spinal transections at 50% BL, almost all of the parameters of the locomotor muscle burst patterns that were present at the various positions along the body were not significantly different compared with those for normal animals (Table 3).
In summary, at 3-wk recovery times following spinal transections at 10% BL, locomotor muscle burst activity was reliably present below the spinal lesion site but was not reliably present below spinal transections at 50% BL until ~11–23 wk. Thus locomotor muscle burst activity recovered much more quickly and more completely right below a rostral spinal transection at 10% BL than right below a caudal transection at 50% BL.
Electrical Properties of RS Neurons Following Rostral or Caudal SCI
For rostral right spinal cord hemi-transections (HTs) at 10% BL (Fig. 7A), at 2-wk recovery times almost all uninjured RS neurons (mostly on left side of brain; see McClellan et al. 2008) displayed smooth repetitive firing in response to depolarizing current pulses (Figs. 7B1 and 9A1). In addition, the main depolarizing phase of action potentials for these neurons (Fig. 7B2) was followed by three sequential afterpotentials (fAHP, ADP, and sAHP; Fig. 7B3; Table 4), as previously described (McClellan et al. 2008). In contrast, virtually all injured RS neurons (~98%, 56 of 57 neurons mostly on right side) displayed the “injury phenotype,” including firing a single, short burst (i.e., “high SFA”; see methods; ~67% of neurons) or short repetitive bursts (i.e., “bursting”; 32% of neurons) of action potentials in response to depolarizing current pulses (Figs. 7C1 and 9A1). In addition, following the main depolarizing phase of action potentials for these injured neurons (Fig. 7C2), the ADP and sAHP usually were absent or substantially reduced, and the fAHP was significantly larger than that for normal, uninjured neurons (Fig. 7C3; Table 4). At 4- and 6-wk recovery times, injured RS neurons displayed firing patterns similar to those at 2-wk recovery times, although at the longer recovery times, a few injured neurons began to fire smoothly in response to depolarizing current pulses (Fig. 9A). Finally, at all recovery times, Vrest, Rin, and VAP were not significantly different for injured vs. uninjured RS neurons, but Vth was significantly larger for injured neurons (Table 4). The elevated threshold for injured RS neurons is one of several mechanisms that contributes to a decrease in electrical excitability of these neurons (Hough R and McClellan AD, unpublished observations).
For caudal spinal HTs at 50% BL (Fig. 8A), at 2-wk recovery times all uninjured RS neurons and the majority of injured neurons (~80%; 25 of 32 neurons) displayed smooth, continuous firing of action potentials in response to depolarizing current pulses (Fig. 8B1, 8C1, and 9B1). For injured RS neurons, Vrest, Rin, Vth, and VAP were not significantly different compared with those for normal, uninjured neurons (Table 4). In addition, the main depolarizing phase of action potentials for uninjured and most injured RS neurons (Fig. 8, B2 and C2) was followed by three sequential afterpotentials (fAHP, ADP, sAHP), each of which was not significantly different for uninjured vs. injured neurons (Fig. 8, B3 and C3; Table 4). For 4- and 6-wk recovery times, the firing patterns and electrical properties of injured RS neurons, as a whole, were similar to those at 2-wk recovery times (Fig. 9, B2 and B3; Table 4). However, the few injured RS neurons in animals with spinal HTs at 50% BL (~15%; 5 of 32 neurons) that fired single bursts or multiple short bursts of action potentials had elevated values for the fAHP and very small values for the ADP and sAHP, similar to those for injured RS neurons in the 10% BL group (Fig. 7C3).
In summary, rostral spinal cord HTs at 10% BL altered the biophysical properties of injured (axotomized) RS neurons and induced the injury phenotype to a significantly greater degree than caudal spinal lesions at 50% BL. For a few additional animals, right spinal HTs were performed at 30% BL, and the firing patterns and electrical properties for the injured RS neurons appeared to be more similar to those for spinal HTs at 50% BL than at 10% BL (Benes 2006).
Low Temperatures Reduce Axonal Transport and Prevent Recovery Following SCI
Effects of low temperatures on retrograde axonal transport.
For animals in which HRP was applied to the spinal cord at 60% BL followed by a 14- to 21-day tracer transport time at ~4–5°C (n = 7; see methods), no descending brain neurons, including identified or unidentified RS neurons, were labeled (data not shown). For similar animals in which HRP was applied at 40% BL (n = 5), there was no labeling in the brains of four animals and labeling of one Mauthner cell in one animal. Because HRP is actively transported (Meller 1992), the results from the above experiments suggest that ~4–5°C temperatures, which are in the lower range normally experienced by larval sea lampreys in the wild, reduce retrograde axonal transport of HRP in the lamprey, at least for the 2- to 3-wk transport times used in the present study.
Effects of cold temperatures on recovery following SCI.
Normal uninjured larval lampreys as well as spinal cord-injured animals that have recovered for ≥8 wk at room temperature (~23°C; not shown; see Davis et al. 1993) generate well-coordinated swimming movements in which S waves propagate caudally toward the tail with increasing amplitude. In contrast, in the present study following spinal cord transection at 10% BL, recovery at cold temperatures (~4–5°C) for 2–16 wk (n = 15 animals total; see methods), and subsequent relatively brief acclimation to room temperature (~23°C), none of the animals displayed locomotor function or forward progression (data not shown). Thus cold temperatures (~4–5°C) prevented or substantially reduced behavioral recovery following SCI.
Following behavioral testing for the above animals (n = 15 animals), HRP was applied to the spinal cord at 20% BL. Following a 14- to 16-day transport time at room temperature, no descending brain neurons were retrogradely labeled in any of the animals at any of the recovery times (data not shown), except for a single “B1” RS neuron in one brain at the 2-wk recovery time. Thus, following SCI, cold temperatures (~4–5°C) prevented or substantially reduced axonal regeneration of descending brain neurons. For a few additional anatomical experiments, spinal cord-transected animals recovered at 12°C, and under these conditions no labeling of descending brain neurons was observed at 2-, 4-, and 8-wk recovery times, but a moderate degree of labeling was seen at 16 wk.
Following right spinal cord HTs at 10% BL and recovery for ~2–3 wk at room temperature (~23°C), virtually all injured RS neurons display the injury phenotype, including dramatic changes in their firing patterns in response to depolarizing current pulses (Figs. 7C1 and 9A1; also see McClellan et al. 2008). In contrast, following right spinal HTs and recovery for 2–17 wk at ~4–5°C, all uninjured RS neurons (left side of brain; N = 7 neurons) and all injured neurons (right side; N = 30) displayed similar smooth firing in response to depolarizing current pulses (Fig. 10, B1 and C1). In addition, action potentials for both uninjured and injured RS neurons were followed by similar sequential afterpotential components (Fig. 10, B2 and C2): fAHP; ADP; and sAHP. Because the electrical properties of uninjured and injured RS neurons (Vrest, Vth, VAP, VfAHP, VADP, and VsAHP) did not vary significantly with recovery time (P > 0.05, regression analysis), the data were pooled into single “uninjured” and “injured” data sets (see methods). For injured RS neurons in animals that recovered at ~4–5°C, the various electrical properties were not significantly different compared with those for uninjured neurons (unpaired t-tests; Table 5). In addition, the electrical properties for injured RS neurons in animals that recovered at ~4–5°C (present study) did not appear to differ substantially from those of uninjured lamprey RS neurons reported in a previous study (N = 31 neurons; McClellan et al. 2008). Thus, following rostral SCI and recovery at cold temperatures, injured RS neurons did not appear to detect and/or respond to injury and failed to develop the injury phenotype.
DISCUSSION
Rostrocaudal Location of SCI Regulates Axonal Regeneration and Recovery
In the present study it was shown in lampreys that rostral SCI (10% BL) resulted in greater axonal regeneration of descending brain neurons, including RS neurons, than that for caudal lesions (50% BL), supporting previous preliminary findings (Croop et al. 1988; Snedeker and Selzer 1986). In addition, following rostral SCI, locomotor muscle burst activity recovered more quickly and completely below the spinal lesion site than below a caudal lesion site. These differences did not appear to be due to differences in the support of axonal regeneration in rostral and caudal spinal cord. Interestingly, for spinal transections at 10% BL, at 3- to 4-wk recovery times when locomotor muscle activity was reliably present below the lesion site, an average of only ~15–140 descending brain neurons (~1–9% of normal) had regenerated their axons from 10% to 20% BL (Fig. 2A and Davis and McClellan 1994a). In contrast, for spinal transections at 50% BL, at 11- to 23-wk recovery times when locomotor muscle activity reliably occurred below the lesion site, an estimated ~150–300 descending brain neurons (~20–40% of normal) had regenerated their axons from 50% to 60% BL (Fig. 2C). Thus recovery of locomotor function apparently is not solely due to the numbers of descending brain neurons that have regenerated their axons across the spinal injury site but presumably also is dependent on the numbers and strengths of synapses made by these neurons below the injury site.
Following rostral SCI, most injured RS neurons displayed the “injury phenotype,” including altered firing patterns and changes in the afterpotential components, whereas following caudal spinal lesions, most injured neurons displayed normal firing patterns and normal afterpotential components. Because injured unidentified and identified RS neurons both displayed the injury phenotype in response to rostral SCI (McClellan et al. 2008), it is likely that injured unidentified RS neurons would also display normal electrical properties in response to caudal SCI.
Rostral SCI is expected to eliminate most of the synapses RS neurons make with spinal neurons and result in a reduction of target-derived neurotrophic factors, which we hypothesize induces injured RS neurons to alter their expression of ion channels and electrical properties. These changes in properties are thought to reduce or limit calcium influx in injured RS neurons and provide supportive conditions for axonal regeneration, leading to recovery of locomotor function (McClellan et al. 2008; Ryan et al. 2007; reviewed in McClellan 2013). Further studies are needed to determine the specific mechanisms by which synapses and target-derived neurotrophic factors might regulate axonal regeneration following SCI. Determining these mechanisms could have important implications for understanding how axonal regeneration is regulated following SCI in lower vertebrates and possibly how it might be improved in higher vertebrates, including perhaps humans.
In contrast, caudal SCI in the lamprey is expected to spare synapses that RS neurons make with spinal neurons above the lesion site. Individual RS neurons do appear to make synapses along the rostrocaudal extent of the spinal cord. For example, several identified RS neurons make synapses with MNs and/or other spinal neurons distributed along the spinal cord (Brodin et al. 1994; Rovainen 1974). In addition, single lamprey RS neurons can influence spinal motor and locomotor activity along the entire extent of their descending axons (Zelenin et al. 2001, 2003). Thus caudal SCI might preserve sufficient neurotrophic support such that most of these injured neurons do not develop the injury phenotype and do not mount a full regenerative response. As a result, there is little or no recovery of locomotor muscle burst activity below the lesion site at most recovery times, and nearly full recovery does not occur until 11–23 wk (Fig. 6).
Possible Mechanisms for Incomplete Axonal Regeneration Following Rostral SCI
The above results support the hypothesis that following spinal cord transections in the lamprey, the synapses that regenerating RS neurons make, either above or below a spinal lesion site, regulate, in part, the degree to which these neurons are stimulated to regenerate their axons. Thus rostral SCI, which would greatly reduce target-derived neurotrophic support supplied by postsynaptic spinal neurons, is expected to be a strong stimulus for axonal regeneration of RS neurons. However, when these neurons regenerate their axons and make synapses, mostly just caudal to the spinal lesion site (Mackler and Selzer 1987; Wood and Cohen 1981), target-derived neurotrophic support presumably is partly restored, and further regeneration for most RS neurons is expected to be suppressed. Thus this mechanism potentially could explain why following rostral SCI, axonal regeneration of injured RS neurons initially is robust but ultimately is incomplete and limited to mostly short distances below the spinal lesion site (Davis and McClellan 1994a, 1994b). Preliminary results from our other studies suggested that following spinal transections at 10% BL and prevention of synapse formation by physically blocking axonal regeneration with Gelfoam during an 8-wk recovery period, the majority of injured RS neurons that satisfied the “healthy” criteria (see methods) continued to express the injury phenotype (Benes 2006). However, many of the RS neurons were swollen, and only some of the neurons satisfied the “healthy” criteria and could be analyzed. These results suggest that RS neurons require connections with postsynaptic targets for the expression of normal electrical properties.
Implications for Mammalian SCI
The current study suggests that following SCI, spared synapses of injured neurons may provide neurotrophic support and suppress axonal regeneration of these neurons. In mammals, including humans, various types of SCIs are likely to spare synapses of supraspinal descending neurons as well as some long-axon propriospinal neurons. Thus, following these types of injuries, additional therapeutic treatments might be necessary to induce particular injured neurons with spared synapses to mount a full regenerative response, provided that the central nervous system can be made sufficiently permissive for axonal outgrowth (Bradbury and McMahon 2006).
Recovery at Cold Temperatures Following SCI
In the lamprey, cold temperatures (~4–5°C) suppressed retrograde axonal transport of HRP, at least for the 2- to 3-wk transport times used in the present study. In addition, following SCI and recovery at cold temperatures for 2–16 wk, axonal regeneration of descending brain neurons and behavioral recovery were prevented. Because ~4–5°C temperatures are in the range that larval sea lampreys normally experience, axonal regeneration and behavioral recovery probably do not occur to a significant extent at cold temperatures following SCI in the wild. The current study also demonstrates that for a wide range of recovery times (~2–17 wk) at cold temperatures, injured RS neurons retained normal electrical properties and never displayed the injury phenotype. Thus it appears that cold temperatures not only reduce axonal transport but also prevent injured RS neurons from detecting and/or responding to axotomy. In contrast, our preliminary results suggest that for normal larval lampreys maintained at room temperature (~23°C), a pharmacological block of axonal transport with vinblastine applied to the ventral spinal cord at ~15% BL can reduce or block retrograde transport of HRP and can induce uninjured RS neurons to express the injury phenotype (Pale 2015).
Comparison to Other Studies
Soma-axotomy distance and neurotrophic support.
Neurotrophic factors often are supplied by or near postsynaptic targets (i.e., target derived) and are retrogradely transported along axons to the soma to regulate multiple neuronal functions (de la Cruz et al. 1996; Hanz and Fainzilber 2006; Liu et al. 2011; Lykissas et al. 2007; Rishal and Fainzilber 2010; Titmus and Faber 1990; Zweifel et al. 2005). For example, when axonal transport is blocked, uninjured neurons can display ultrastructural and electrophysiological properties that are similar to those of injured neurons (Pilar and Landmesser 1972; Pitman et al. 1972; Purves 1976). For uninjured sensory or sympathetic neurons, interruption of or blocking nerve growth factor (NGF) induces axotomy-like changes, whereas exogenous NGF can delay or prevent injured neurons from responding to axotomy (Gold 1997; Kelly et al. 1989; Shadiack et al. 2001). Finally, when injured neurons regenerate their axons and innervate postsynaptic targets, presumably restoring neurotrophic support, some or all of the normal electrical properties of these cells are restored (Benítez-Temiño et al. 2002; Kelly et al. 1988). Thus synapses with postsynaptic targets can provide neurotrophic support that regulates the properties and regenerative responses of injured neurons.
In addition to the specific effects of soma-axotomy distance on the properties of injured neurons, for certain neurons this lesion paradigm can also vary the degree to which synapses are spared with postsynaptic targets and presumably the degree to which target-derived neurotrophic support is preserved. First, following cervical SCI in rat, which eliminates many synapses of injured rubrospinal neurons, these neurons display significant increases in expression of GAP-43, tubulin, and NF-M, whereas neuronal responses are much less for thoracic spinal injury (Fernandes et al. 1999), which spares many of the synapses of these neurons above the injury site. Similarly, for rat corticospinal neurons, intracortical axotomy results in upregulation of several growth-associated genes, whereas spinal axotomy does not (Mason et al. 2003), possibly in the latter case because of spared synapses of corticobulbar projections. Finally, for goldfish Mauthner cells, which synapse with motoneurons along the contralateral spinal cord, the nerve cell body response is substantially greater for close vs. distant axotomy (Zottoli et al. 1984).
Second, for motoneurons (MNs), sensory neurons (SNs), sympathetic neurons, and retinal ganglion cells (RGCs), axonal injuries can be made to test the effects of soma-axotomy distance alone without varying the proportion of spared synapses. Although axotomy very close to the soma can trigger apoptosis, in most cases the above types of neurons respond similarly following proximal or distal axonal injury. For example, GAP-43 and NF-M expression increase equally for rat MNs following either distal or proximal axonal injuries (Fernandes et al. 1999). Likewise, expression of GAP-43 is similar in SNs following proximal or distal peripheral axotomy (Liabotis and Schreyer 1995). Also, the rate of axonal regeneration of olfactory neurons appears to be relatively independent of cell body-axotomy distance (Cancalon 1987). For rat sympathetic neurons, ATF3 expression increases similarly for close or more distant axotomy (Hyatt Sachs et al. 2007), and survival of rat hypoglossal MNs is similar for close vs. more distant axotomy (Törnqvist and Aldskogius 1994). In contrast, for rat RGCs, GAP-43 expression and the number of regenerating axons are greater for shorter soma-axotomy distances (Doster et al. 1991; You et al. 2000).
Temperature effects.
Following axotomy, cold temperatures have a negative impact on axon sealing (Shi and Pryor 2000) as well as axonal regeneration and axonal transport (Cancalon 1985). First, for spinal cord-injured larval lampreys, recovery at cold temperatures (12°C) results in a significant decrease in the restoration of coordination of spinal locomotor activity compared with recovery at room temperature (Cohen et al. 1999). Following sciatic nerve transection in frogs and recovery at cold temperatures (15°C), spinal MNs still regenerate their axons, despite suppression of the cell body response, but regeneration is not sustained (Carlsen et al. 1982; Carlsen 1983). Following optic nerve crush in the goldfish, axonal regeneration and recovery of function are markedly decreased by lowering the temperature from 30°C to 20°C. Likewise, following SCI in weakly electric fish, recovery of function is significantly less at 22°C compared with 30°C (Sîrbulescu and Zupanc 2010).
Second, axonal transport is strongly dependent on temperature (Cancalon 1985). For example, in the frog, the rate of fast axonal transport is substantially reduced when the temperature is lowered from ~23–25°C to ~5–10°C (Brimijoin et al. 1979; Edström and Hanson 1973). Following a crush injury of garfish olfactory nerves, a similar relationship is seen for the rate of slow axonal transport and axonal regeneration vs. temperature (Cancalon 1979, 1983).
Summary
Lampreys with rostral spinal transections exhibited greater axonal regeneration of descending brain neurons, including RS neurons, as well as more rapid and complete recovery of locomotor muscle activity below the lesion site compared with animals with caudal spinal lesions. In addition, following rostral SCI, most injured RS neurons displayed the “injury phenotype,” whereas following caudal SCI, most injured neurons had electrical properties similar to those of uninjured neurons. Cold temperatures reduced axonal transport in the lamprey, and following SCI and recovery at cold temperatures, axonal regeneration of descending brain neurons and recovery of locomotor function were prevented. In addition, recovery at cold temperatures prevented injured RS neurons from developing the injury phenotype. Thus cold temperatures appear to reduce axonal transport as well as prevent injured RS neurons from detecting and/or fully responding to SCI. We hypothesize that the synapses injured RS neurons make, either above or below a spinal lesion site, provide neurotrophic support that determines, in part, the degree to which these neurons regenerate their axons. Thus rostral SCI initially is a strong stimulus for axonal regeneration of RS neurons, but when these neurons make synapses right below the lesion site, neurotrophic support likely is restored and presumably suppresses further regeneration, leading to incomplete axonal regeneration. In the lamprey, various compensatory mechanisms make up for this incomplete axonal regeneration so that locomotor recovery is robust several weeks after SCI. In mammals, including humans, SCIs that spare some of the synapses of supraspinal descending neurons and propriospinal neurons may require additional therapeutic treatments to induce these neurons to mount a full regenerative response, provided that the CNS can be made sufficiently permissive for axonal outgrowth.
GRANTS
This research was supported by National Institute of Neurological Disorders and Stroke Grant NS29043, a University of Missouri (MU) A&S Alumni Faculty Incentive Grant, and a MU Research Council Grant (to A. D. McClellan).
DISCLOSURES
No conflicts of interest, financial or otherwise, are declared by the authors.
AUTHOR CONTRIBUTIONS
J.A.B. and A.D.M. conceived and designed research; J.A.B., K.N.H., F.N.B., K.P.C., D.P.J., J.P.D., M.A.I., and A.D.M. performed experiments; J.A.B., K.N.H., F.N.B., K.P.C., D.P.J., J.P.D., M.A.I., and A.D.M. analyzed data; J.A.B., K.N.H., F.N.B., K.P.C., D.P.J., J.P.D., M.A.I., and A.D.M. interpreted results of experiments; J.A.B., K.N.H., F.N.B., K.P.C., D.P.J., J.P.D., M.A.I., and A.D.M. prepared figures; J.A.B. and A.D.M. edited and revised manuscript; J.A.B., K.N.H., F.N.B., K.P.C., D.P.J., J.P.D., M.A.I., and A.D.M. approved final version of manuscript; A.D.M. drafted manuscript.
ACKNOWLEDGMENTS
We thank Lené Holland and Ryan Hough for very useful comments on an earlier version of this manuscript, and David Schulz for statistical advice. We are grateful to Lamprey Services, Northwoods Custom Products & Services, and Acme Lamprey for lamprey collection. Also, we thank Dylan Lacewell for writing the data acquisition/analysis program and Carl Groat for expert machining. Finally, we appreciate Lefei Li for analyzing some of the neurophysiological data.
REFERENCES
- Benes JA. The Effects of Axotomy on the Biophysical Properties of Reticulospinal Neurons in Larval Lamprey (Dissertation). Columbia, MO: University of Missouri, 2006. [Google Scholar]
- Benítez-Temiño B, De La Cruz RR, Pastor AM. Firing properties of axotomized central nervous system neurons recover after graft reinnervation. J Comp Neurol 444: 324–344, 2002. doi: 10.1002/cne.10147. [DOI] [PubMed] [Google Scholar]
- Benthall KN, Hough RA, McClellan AD. Descending propriospinal neurons mediate restoration of locomotor function following spinal cord injury. J Neurophysiol 117: 215–229, 2017. doi: 10.1152/jn.00544.2016. [DOI] [PMC free article] [PubMed] [Google Scholar]
- Bradbury EJ, McMahon SB. Spinal cord repair strategies: why do they work? Nat Rev Neurosci 7: 644–653, 2006. doi: 10.1038/nrn1964. [DOI] [PubMed] [Google Scholar]
- Brimijoin S, Olsen J, Rosenson R. Comparison of the temperature-dependence of rapid axonal transport and microtubules in nerves of the rabbit and bullfrog. J Physiol 287: 303–314, 1979. doi: 10.1113/jphysiol.1979.sp012660. [DOI] [PMC free article] [PubMed] [Google Scholar]
- Brodin L, Shupliakov O, Pieribone VA, Hellgren J, Hill RH. The reticulospinal glutamate synapse in lamprey: plasticity and presynaptic variability. J Neurophysiol 72: 592–604, 1994. [DOI] [PubMed] [Google Scholar]
- Cancalon P. Influence of temperature on the velocity and on the isotope profile of slowly transported labeled proteins. J Neurochem 32: 997–1007, 1979. doi: 10.1111/j.1471-4159.1979.tb04586.x. [DOI] [PubMed] [Google Scholar]
- Cancalon P. Regeneration of three populations of olfactory axons as a function of temperature. Brain Res 9: 265–278, 1983. doi: 10.1016/0165-3806(83)90024-X. [DOI] [PubMed] [Google Scholar]
- Cancalon P. Influence of temperature on various mechanisms associated with neuronal growth and nerve regeneration. Prog Neurobiol 25: 27–92, 1985. doi: 10.1016/0301-0082(85)90022-X. [DOI] [PubMed] [Google Scholar]
- Cancalon PF. Survival and subsequent regeneration of olfactory neurons after a distal axonal lesion. J Neurocytol 16: 829–841, 1987. doi: 10.1007/BF01611989. [DOI] [PubMed] [Google Scholar]
- Carlsen RC. Regeneration of sciatic nerve in frogs maintained at 15°C: failure to sustain regeneration after initiation. Exp Neurol 82: 159–171, 1983. doi: 10.1016/0014-4886(83)90251-0. [DOI] [PubMed] [Google Scholar]
- Carlsen RC, Kiff J, Ryugo K. Suppression of the cell body response in axotomized frog spinal neurons does not prevent initiation of nerve regeneration. Brain Res 234: 11–25, 1982. doi: 10.1016/0006-8993(82)90469-3. [DOI] [PubMed] [Google Scholar]
- Cohen AH, Kiemel T, Pate V, Blinder J, Guan L. Temperature can alter the function outcome of spinal cord regeneration in larval lampreys. Neuroscience 90: 957–965, 1999. doi: 10.1016/S0306-4522(98)00502-8. [DOI] [PubMed] [Google Scholar]
- Croop RS, Snedeker JA, Selzer ME. Unequal probabilities of regeneration among lamprey reticulospinal neurons. Abstr Soc Neurosci 14: 656, 1988. [Google Scholar]
- Davis GR Jr, McClellan AD. Extent and time course of restoration of descending brainstem projections in spinal cord-transected lamprey. J Comp Neurol 344: 65–82, 1994a. doi: 10.1002/cne.903440106. [DOI] [PubMed] [Google Scholar]
- Davis GR Jr, McClellan AD. Long distance axonal regeneration of identified lamprey reticulospinal neurons. Exp Neurol 127: 94–105, 1994b. doi: 10.1006/exnr.1994.1083. [DOI] [PubMed] [Google Scholar]
- Davis GR Jr, Troxel MT, Kohler VJ, Grossmann EM, McClellan AD. Time course of locomotor recovery and functional regeneration in spinal-transected lamprey: kinematics and electromyography. Exp Brain Res 97: 83–95, 1993. doi: 10.1007/BF00228819. [DOI] [PubMed] [Google Scholar]
- de la Cruz RR, Pastor AM, Delgado-García JM. Influence of the postsynaptic target on the functional properties of neurons in the adult mammalian central nervous system. Rev Neurosci 7: 115–149, 1996. doi: 10.1515/REVNEURO.1996.7.2.115. [DOI] [PubMed] [Google Scholar]
- Doster SK, Lozano AM, Aguayo AJ, Willard MB. Expression of the growth-associated protein GAP-43 in adult rat retinal ganglion cells following axon injury. Neuron 6: 635–647, 1991. doi: 10.1016/0896-6273(91)90066-9. [DOI] [PubMed] [Google Scholar]
- Edström A, Hanson M. Temperature effects on fast axonal transport of proteins in vitro in frog sciatic nerves. Brain Res 58: 345–354, 1973. doi: 10.1016/0006-8993(73)90006-1. [DOI] [PubMed] [Google Scholar]
- Fernandes KJL, Fan D-P, Tsui BJ, Cassar SL, Tetzlaff W. Influence of the axotomy to cell body distance in rat rubrospinal and spinal motoneurons: differential regulation of GAP-43, tubulins, and neurofilament-M. J Comp Neurol 414: 495–510, 1999. doi:. [DOI] [PubMed] [Google Scholar]
- Freidman B, Wong V, Lindsay RM. Axons, Schwann cells, and neurotrophic factors. Neuroscientist 1: 192–199, 1995. doi: 10.1177/107385849500100403. [DOI] [Google Scholar]
- Gold BG. Axonal regeneration of sensory nerves is delayed by continuous intrathecal infusion of nerve growth factor. Neuroscience 76: 1153–1158, 1997. doi: 10.1016/S0306-4522(96)00416-2. [DOI] [PubMed] [Google Scholar]
- Hanz S, Fainzilber M. Retrograde signaling in injured nerve—the axon reaction revisited. J Neurochem 99: 13–19, 2006. doi: 10.1111/j.1471-4159.2006.04089.x. [DOI] [PubMed] [Google Scholar]
- Hyatt Sachs H, Schreiber RC, Shoemaker SE, Sabe A, Reed E, Zigmond RE. Activating transcription factor 3 induction in sympathetic neurons after axotomy: response to decreased neurotrophin availability. Neuroscience 150: 887–897, 2007. doi: 10.1016/j.neuroscience.2007.10.008. [DOI] [PubMed] [Google Scholar]
- Jackson AW, Pino FA, Wiebe ED, McClellan AD. Movements and muscle activity initiated by brain locomotor areas in semi-intact preparations from larval lamprey. J Neurophysiol 97: 3229–3241, 2007. doi: 10.1152/jn.00967.2006. [DOI] [PubMed] [Google Scholar]
- Kelly ME, Bisby MA, Lukowiak K. Regeneration restores some of the altered electrical properties of axotomized bullfrog B-cells. J Neurobiol 19: 357–372, 1988. doi: 10.1002/neu.480190404. [DOI] [PubMed] [Google Scholar]
- Kelly ME, Traynor P, Smith PA. Amphibian sympathetic ganglia as a model system for investigating regeneration in the vertebrate peripheral nervous system. Comp Biochem Physiol A 93: 133–140, 1989. doi: 10.1016/0300-9629(89)90200-4. [DOI] [PubMed] [Google Scholar]
- Kenney AM, Kocsis JD. Peripheral axotomy induces long-term c-Jun amino-terminal kinase-1 activation and activator protein-1 binding activity by c-Jun and junD in adult rat dorsal root ganglia in vivo. J Neurosci 18: 1318–1328, 1998. [DOI] [PMC free article] [PubMed] [Google Scholar]
- Liabotis S, Schreyer DJ. Magnitude of GAP-43 induction following peripheral axotomy of adult rat dorsal root ganglion neurons is independent of lesion distance. Exp Neurol 135: 28–35, 1995. doi: 10.1006/exnr.1995.1063. [DOI] [PubMed] [Google Scholar]
- Liu K, Tedeschi A, Park KK, He Z. Neuronal intrinsic mechanisms of axon regeneration. Annu Rev Neurosci 34: 131–152, 2011. doi: 10.1146/annurev-neuro-061010-113723. [DOI] [PubMed] [Google Scholar]
- Lykissas MG, Batistatou AK, Charalabopoulos KA, Beris AE. The role of neurotrophins in axonal growth, guidance, and regeneration. Curr Neurovasc Res 4: 143–151, 2007. doi: 10.2174/156720207780637216. [DOI] [PubMed] [Google Scholar]
- Mackler SA, Selzer ME. Specificity of synaptic regeneration in the spinal cord of the larval sea lamprey. J Physiol 388: 183–198, 1987. doi: 10.1113/jphysiol.1987.sp016609. [DOI] [PMC free article] [PubMed] [Google Scholar]
- Mason MR, Lieberman AR, Anderson PN. Corticospinal neurons up-regulate a range of growth-associated genes following intracortical, but not spinal, axotomy. Eur J Neurosci 18: 789–802, 2003. doi: 10.1046/j.1460-9568.2003.02809.x. [DOI] [PubMed] [Google Scholar]
- McClellan AD. Time course of locomotor recovery and functional regeneration in spinal cord-transected lamprey: in vitro preparations. J Neurophysiol 72: 847–860, 1994a. [DOI] [PubMed] [Google Scholar]
- McClellan AD. Functional regeneration and restoration of locomotor activity following spinal cord transection in the lamprey. Prog Brain Res 103: 203–217, 1994b. doi: 10.1016/S0079-6123(08)61137-1. [DOI] [PubMed] [Google Scholar]
- McClellan AD. Spinal cord injury: Lessons from locomotor recovery and axonal regeneration in lower vertebrates. Neuroscientist 4: 250–263, 1998. doi: 10.1177/107385849800400414. [DOI] [Google Scholar]
- McClellan AD. Spinal cord injury–the lamprey model. In: Animal Models of Spinal Cord Repair (Neuromethods), edited by Aldskogius H. New York: Humana, 2013, vol 76, chapt. 4, p. 63–108. doi: 10.1007/978-1-62703-197-4_4. [DOI] [Google Scholar]
- McClellan AD, Benes JA, Burks F. Factors that regulate axonal regeneration following spinal cord injury in larval lamprey. Abstr Soc Neurosci 31: 838.14, 2005. [Google Scholar]
- McClellan AD, Hagevik A. Descending control of turning locomotor activity in larval lamprey: neurophysiology and computer modeling. J Neurophysiol 78: 214–228, 1997. [DOI] [PubMed] [Google Scholar]
- McClellan AD, Kovalenko MO, Benes JA, Schulz DJ. Spinal cord injury induces changes in electrophysiological properties and ion channel expression of reticulospinal neurons in larval lamprey. J Neurosci 28: 650–659, 2008. doi: 10.1523/JNEUROSCI.3840-07.2008. [DOI] [PMC free article] [PubMed] [Google Scholar]
- McClellan AD, Pale T, Messina JA, Buso S, Shebib A. Similarities and differences for swimming in larval and adult lampreys. Physiol Biochem Zool 89: 294–312, 2016. doi: 10.1086/686893. [DOI] [PubMed] [Google Scholar]
- Meller K. Axoplasmic transport of horseradish peroxidase in single neurons of the dorsal root ganglion studied in vitro by microinjection. Cell Tissue Res 270: 139–148, 1992. doi: 10.1007/BF00381888. [DOI] [PubMed] [Google Scholar]
- Orlovsky GN, Deliagina TG, Grillner S. Neuronal Control of Locomotion. New York: Oxford University Press, 1999. doi: 10.1093/acprof:oso/9780198524052.001.0001 [DOI] [Google Scholar]
- Pale T. Changes in Properties of Lamprey Reticulospinal Neurons Following Spinal Cord Injury (PhD thesis). Columbia, MO: University of Missouri, 2015. [Google Scholar]
- Pale T, Frisch EB, McClellan AD. Cyclic AMP stimulates neurite outgrowth of lamprey reticulospinal neurons without substantially altering their biophysical properties. Neuroscience 245: 74–89, 2013. doi: 10.1016/j.neuroscience.2013.04.016. [DOI] [PMC free article] [PubMed] [Google Scholar]
- Pilar G, Landmesser L. Axotomy mimicked by localized colchicine application. Science 177: 1116–1118, 1972. doi: 10.1126/science.177.4054.1116. [DOI] [PubMed] [Google Scholar]
- Pitman RM, Tweedle CD, Cohen MJ. Electrical responses of insect central neurons: augmentation by nerve section or colchicine. Science 178: 507–509, 1972. doi: 10.1126/science.178.4060.507. [DOI] [PubMed] [Google Scholar]
- Purves D. Functional and structural changes in mammalian sympathetic neurones following colchicine application to post-ganglionic nerves. J Physiol 259: 159–175, 1976. doi: 10.1113/jphysiol.1976.sp011459. [DOI] [PMC free article] [PubMed] [Google Scholar]
- Rishal I, Fainzilber M. Retrograde signaling in axonal regeneration. Exp Neurol 223: 5–10, 2010. doi: 10.1016/j.expneurol.2009.08.010. [DOI] [PubMed] [Google Scholar]
- Rouse DT Jr, McClellan AD. Descending propriospinal neurons in normal and spinal cord-transected lamprey. Exp Neurol 146: 113–124, 1997. doi: 10.1006/exnr.1997.6511. [DOI] [PubMed] [Google Scholar]
- Rovainen CM. Synaptic interactions of reticulospinal neurons and nerve cells in the spinal cord of the sea lamprey. J Comp Neurol 154: 207–223, 1974. doi: 10.1002/cne.901540207. [DOI] [PubMed] [Google Scholar]
- Rovainen CM. Müller cells, Mauthner cells, and other reticulospinal neurons in the lamprey. In: Neurobiology of the Mauthner Cell, edited by Faber D, Korn H. New York: Raven, 1978, p. 245–269. [Google Scholar]
- Ryan SK, Shotts LR, Hong S-K, Nehra D, Groat CR, Armstrong JR, McClellan AD. Glutamate regulates neurite outgrowth of cultured descending brain neurons from larval lamprey. Dev Neurobiol 67: 173–188, 2007. doi: 10.1002/dneu.20335. [DOI] [PubMed] [Google Scholar]
- Shadiack AM, Sun Y, Zigmond RE. Nerve growth factor antiserum induces axotomy-like changes in neuropeptide expression in intact sympathetic and sensory neurons. J Neurosci 21: 363–371, 2001. [DOI] [PMC free article] [PubMed] [Google Scholar]
- Shaw AC, Jackson AW, Holmes T, Thurman S, Davis GR, McClellan AD. Descending brain neurons in larval lamprey: spinal projection patterns and initiation of locomotion. Exp Neurol 224: 527–541, 2010. doi: 10.1016/j.expneurol.2010.05.016. [DOI] [PMC free article] [PubMed] [Google Scholar]
- Shi R, Pryor JD. Temperature dependence of membrane sealing following transection in mammalian spinal cord axons. Neuroscience 98: 157–166, 2000. doi: 10.1016/S0306-4522(00)00096-8. [DOI] [PubMed] [Google Scholar]
- Sîrbulescu RF, Zupanc GKH. Effect of temperature on spinal cord regeneration in the weakly electric fish, Apteronotus leptorhynchus. J Comp Physiol A Neuroethol Sens Neural Behav Physiol 196: 359–368, 2010. doi: 10.1007/s00359-010-0521-9. [DOI] [PubMed] [Google Scholar]
- Snedeker JA, Selzer ME. Probability of regeneration as a function of distance of axotomy from the cell body in lamprey brain neurons. Abstr Soc Neurosci 12: 1575, 1986. [Google Scholar]
- Titmus MJ, Faber DS. Axotomy-induced alterations in the electrophysiological characteristics of neurons. Prog Neurobiol 35: 1–51, 1990. doi: 10.1016/0301-0082(90)90039-J. [DOI] [PubMed] [Google Scholar]
- Törnqvist E, Aldskogius H. Motoneuron survival is not affected by the proximo-distal level of axotomy but by the possibility of regenerating axons to gain access to the distal nerve stump. J Neurosci Res 39: 159–165, 1994. doi: 10.1002/jnr.490390206. [DOI] [PubMed] [Google Scholar]
- Wood MR, Cohen MJ. Synaptic regeneration and glial reactions in the transected spinal cord of the lamprey. J Neurocytol 10: 57–79, 1981. doi: 10.1007/BF01181745. [DOI] [PubMed] [Google Scholar]
- You SW, So KF, Yip HK. Axonal regeneration of retinal ganglion cells depending on the distance of axotomy in adult hamsters. Invest Ophthalmol Vis Sci 41: 3165–3170, 2000. [PubMed] [Google Scholar]
- Zelenin PV, Grillner S, Orlovsky GN, Deliagina TG. Heterogeneity of the population of command neurons in the lamprey. J Neurosci 21: 7793–7803, 2001. [DOI] [PMC free article] [PubMed] [Google Scholar]
- Zelenin PV, Pavlova EL, Grillner S, Orlovsky GN, Deliagina TG. Comparison of the motor effects of individual vestibulo- and reticulospinal neurons on dorsal and ventral myotomes in lamprey. J Neurophysiol 90: 3161–3167, 2003. doi: 10.1152/jn.00555.2003. [DOI] [PubMed] [Google Scholar]
- Zhang L, McClellan AD. Axonal regeneration of descending brain neurons in larval lamprey demonstrated by retrograde double labeling. J Comp Neurol 410: 612–626, 1999. doi:. [DOI] [PubMed] [Google Scholar]
- Zhang L, Palmer R, McClellan AD. Increase in descending brain-spinal cord projections with age in larval lamprey: implications for spinal cord injury. J Comp Neurol 447: 128–137, 2002. doi: 10.1002/cne.10208. [DOI] [PubMed] [Google Scholar]
- Zottoli SJ, Hangen DH, Faber DS. The axon reaction of the goldfish Mauthner cell and factors that influence its morphological variability. J Comp Neurol 230: 497–516, 1984. doi: 10.1002/cne.902300403. [DOI] [PubMed] [Google Scholar]
- Zweifel LS, Kuruvilla R, Ginty DD. Functions and mechanisms of retrograde neurotrophin signalling. Nat Rev Neurosci 6: 615–625, 2005. doi: 10.1038/nrn1727. [DOI] [PubMed] [Google Scholar]