

Cortical processing serving visual perception prioritizes information according to current task requirements. We provide evidence in favor of a dimension-based attentional mechanism addressing all neurons that process visual information in the task-relevant feature domain. Behavioral tasks required monkeys to attend either color or motion, causing modulations of response strength, variability, latency, and baseline activity of motion-selective monkey area MT neurons irrespective of the attended motion direction but specific to the attended feature dimension.
Keywords: attention, response latency, baseline shift, motion processing, task
Abstract
Nonspatially selective attention is based on the notion that specific features or objects in the visual environment are effectively prioritized in cortical visual processing. Feature-based attention (FBA), in particular, is a well-studied process that dynamically and selectively addresses neurons preferentially processing the attended feature attribute (e.g., leftward motion). In everyday life, however, behavior may require high sensitivity for an entire feature dimension (e.g., motion), but experimental evidence for a feature dimension-specific attentional modulation on a cellular level is lacking. Therefore, we investigated neuronal activity in macaque motion-selective mediotemporal area (MT) in an experimental setting requiring the monkeys to detect either a motion change or a color change. We hypothesized that neural activity in MT is enhanced when the task requires perceptual sensitivity to motion. In line with this, we found that mean firing rates were higher in the motion task and that response variability and latency were lower compared with values in the color task, despite identical visual stimulation. This task-specific, dimension-based modulation of motion processing emerged already in the absence of visual input, was independent of the relation between the attended and stimulating motion direction, and was accompanied by a spatially global reduction of neuronal variability. The results provide single-cell support for the hypothesis of a feature dimension-specific top-down signal emphasizing the processing of an entire feature class.
NEW & NOTEWORTHY Cortical processing serving visual perception prioritizes information according to current task requirements. We provide evidence in favor of a dimension-based attentional mechanism addressing all neurons that process visual information in the task-relevant feature domain. Behavioral tasks required monkeys to attend either color or motion, causing modulations of response strength, variability, latency, and baseline activity of motion-selective monkey area MT neurons irrespective of the attended motion direction but specific to the attended feature dimension.
neuronal processing of visual information strongly depends on the observer’s perceptual requirements (Chen et al. 2008; Huk and Heeger 2000; Jack et al. 2006). Among the several mechanisms involved in this selective, goal-directed processing, feature-based attention (FBA) plays a key role by facilitating the processing of a specific feature in the visual environment, independent of the spatial focus of attention (Bisley 2011; Maunsell and Treue 2006). Evidence from human neuroimaging and electroencephalography (EEG) studies shows that attending to, for example, a specific color hue elevates the neuronal response to an object at a remote, unattended location if its color matches the currently attended hue, but not if this object is composed of another, unattended hue (Saenz et al. 2002; Störmer and Alvarez 2014). Corresponding findings have been reported for attention directed to a specific motion direction, shape, or orientation (Corbetta et al. 1991; Liu et al. 2007; Saenz et al. 2002).
Monkey neurophysiological studies investigating the neuronal substrate of this feature-specific response facilitation found that at the level of single cells, FBA is characterized by a firing rate (FR) change of neurons well tuned to the attended feature attribute. For example, attending toward a specific motion direction globally increases the response of direction-selective MT neurons with a tuning preference for the attended direction (Treue and Martínez Trujillo 1999). The same neurons’ responses might be unmodulated (or even weakened) if attention is allocated on a motion direction that is significantly deviating from their preferred direction (Martínez Trujillo and Treue 2004). This feature-similarity gain (FSG), along with its spatially global effectiveness, has been suggested to underlie our ability to actually focus on the portion of the visual input that is behaviorally relevant, and, at the same time, disregard irrelevant, distracting information (Bisley 2011; Carrasco 2011; Maunsell and Treue 2006).
In a rapidly changing perceptual environment, however, successful behavior critically depends on the ability to quickly perceive abrupt changes of sensory input. In area MT, abrupt changes in motion induce strong, transient firing rate changes (Price and Born 2010, 2013), which in turn correlate with measures of perceptual performance (Galashan et al. 2013; Herrington and Assad 2009; Masse and Cook 2008; Traschütz et al. 2015). On the population level, these transients are carried substantially by neurons that are suboptimally tuned to the stimulus feature preceding the feature change (Traschütz et al. 2015); hence, the population response relies significantly on neurons not addressed, or even suppressed, by FSG. We hypothesized, therefore, that under behavioral conditions requiring detection of changes in visual input, attentional facilitation is unlikely to be limited to the subclass of neurons well tuned to the currently attended feature attributes (which provide only minor information about the change) but will address all neurons processing information about the attended feature dimension, including those without a tuning preference for the currently attended feature attributes. Such a feature dimension-specific weighting of neural responses is supported by evidence from psychophysics (Found and Müller 1996; Müller et al. 1995), human EEG (Gledhill et al. 2015; Gramann et al. 2007; 2010; Pollmann et al. 2000; Töllner et al. 2008), and neuroimaging studies (Chawla et al. 1999; Pollmann et al. 2006; Weidner et al. 2002) but has not gained experimental support by single-cell studies (Chen et al. 2012; Katzner et al. 2009) such that its underlying neuronal mechanisms remain unknown.
To address this issue, we trained monkeys on two variants of a change detection task and performed extracellular recordings in area MT. In the first task, monkeys were required to detect speed changes, a feature for which MT neurons are highly sensitive (Nover et al. 2005; Traschütz et al. 2015). In the second task, monkeys were required to detect color changes, a feature for which MT is only weakly sensitive (Croner and Albright 1999; Thiele et al. 1999). When comparing the neuronal representation to physically identical motion and motion change stimuli as a function of spatial attention, motion direction, and task requirements, we found that MT neurons were responding significantly differently in the speed and in the color task, at the level of both evoked and spontaneous activity. Notably, this modulation was not only independent of the spatial focus of attention but also independent of the relation between the attended and the preferred motion direction of a neuron, affecting neurons also when they were not tuned to the attended motion direction or speed. These results suggest a highly flexible, task-dependent shaping of motion processing.
MATERIALS AND METHODS
Electrophysiological recordings.
All surgical and experimental procedures followed the Regulation for the Welfare of Experimental Animals issued by the Federal Government of Germany and were approved by the local authorities. Extracellular recordings were obtained from two male adult rhesus monkeys (Macaca mulatta) using tungsten microelectrodes (0.8–5 MΩ, 125-μm shank diameter; Frederic Haer, Bowdoin, ME). Surgery was performed under propofol/fentanyl anesthesia and strictly aseptic conditions, as previously reported in detail (Wegener et al. 2004). The recording chamber was placed over the middle temporal sulcus; coordinates for electrode penetrations were estimated from structural magnetic resonance imaging scans. During recordings, area MT was identified by the high proportion of direction-selective neurons, the size-to-eccentricity ratio of receptive fields (RFs), and the depth of the recording site (Desimone and Ungerleider 1986; Maunsell and Van Essen 1983; Mikami et al. 1986). The amplified electrode signal was sampled at a frequency of 25 kHz and bandpass filtered between 0.7 and 5 kHz, using either a custom-made hardware filter or an equiripple finite impulse response filter in forward and reverse direction. Online detection of spikes was achieved by thresholding. At the beginning of each recording session, one or two electrodes were lowered through a guide tube penetrating the dura mater until the electrode’s tip reached the desired depth in area MT. Before cell recordings began, the tissue was allowed to settle for ~30 min.
Visual stimulation.
Visual stimuli were presented on a 22-in. cathode ray tube monitor (1,280 × 1,024 pixels, 100-Hz refresh rate), placed 80 cm from the animal. Stimuli were shown on a gray background (luminance: 10 cd/m2) and consisted of two high-contrast, drifting Gabors (spatial frequency: 2 cycles/deg), enveloped by a Gaussian with 0.75° at half height. Gabors had a mean luminance of 10 cd/m2 and drifted with 2.17°/s. Speed and color changes were achieved by abruptly increasing the speed to 4.17°/s or changing the color to an isoluminant pale yellow. Eye movements were monitored with a custom-made eye-tracking device with a spatial resolution of 0.2°. Before cell recordings were begun in the behavioral paradigms, monkeys performed a dimming task at fixation to determine basic response characteristics of each unit. RF size and location were mapped manually using a moving bar. If two electrodes were used simultaneously, we searched for units with largely overlapping RFs. Each unit’s direction tuning was measured using Gabor gratings moving into 1 of 24 different directions, and preferred direction was estimated before recordings were begun in the main experiment by calculating the mean response vector of the unclustered data.
Behavioral task.
Monkeys were trained to perform two variants of a feature-change detection task (see Fig. 1A). They had to attend either inside or outside the RF or the recorded unit, and were required to detect either a speed or a color change. This 2 × 2 design allowed gathering of data under the four experimental conditions illustrated by the inset in Fig. 2A. The monkey initiated a trial by maintaining fixation on a central fixation point (0.14° side length) and pressing a lever. The color of the fixation point indicated the task type (red, speed-change detection; yellow, color-change detection). At 1,050 ms after lever press (or 350 ms for some recording sessions), a rectangular spatial cue indicating the location of the behaviorally relevant stimulus was displayed for 500 ms and outside the RF of the recorded neuron(s), followed by a 500-ms delay period. Subsequently, two static Gabor gratings appeared simultaneously. One grating was placed inside the RF and the other one at a mirror-inverted position in the opposite hemifield. Two hundred milliseconds later, both gratings started to move intrinsically. If we recorded from two electrodes at the same time, the stimulus was placed in the joint RF of the units and motion direction of the RF stimulus was chosen to drive one of the recorded units with its preferred direction. If neurons had very different preferred motion directions, we chose a motion direction capable to drive both units efficiently. Thus, for a number of neurons, we obtained data following stimulation with motion directions deviating to some degree from their preferred motion direction. Motion direction of the stimulus outside the RF was in opposite direction. Thus, when the monkey attended to the Gabor outside the RF, the recorded neuron responded to a stimulus that was unattended in terms of both spatial and feature-based attention (because the attended direction was 180° away from the direction presented to the neuron). As a consequence, when the neurons’ responses are compared depending on whether attention was directed toward or away from the RF, the response difference is likely due to both attended spatial location and attended motion direction. In the remainder of the article, we refer to this as to the spatial condition (SC). In contrast, task-related response differences not explained by SC (responses to the same spatial location and the same motion direction in the speed- and color-change task) are referred to as the task condition (TC).
Fig. 1.

Behavioral paradigm and performance. A and B: example trials of the speed-change task (A) and the color-change task (B). Task type was indicated by the color of the fixation point. Monkeys were required to detect a change of either the speed or the color at the cued location and to ignore any other change. Fixation had to be kept until 300 ms after the lever was released (see materials and methods for detailed information). Circle, RF of the recorded neuron; black arrow, preferred direction; white dashed arrow, motion direction at base speed; white solid arrow, motion direction at increased speed; thin black dashed line, gaze direction; thick black dashed line, direction of spatial attention. Note that visual stimulation is identical across tasks until the first change (shown: RF stimulus speed-up, 4th panel from left in both tasks), and only this period was used for data analysis. C and D: mean performance [correct responses/sum(correct responses, false alarms, misses)] of monkey 1 (M1) and monkey 2 (M2) regarding task type (C) and spatial condition (D). Note that with attention directed to the RF stimulus, the monkey attended toward the preferred motion direction of the recorded neuron, whereas with attention directed away from the RF, the monkey attended a motion direction 180° opposite to it. E: cumulative reaction time (RT) distributions of all trials, sorted by task type (left) and spatial condition (right). n.s., No significant difference.
Fig. 2.
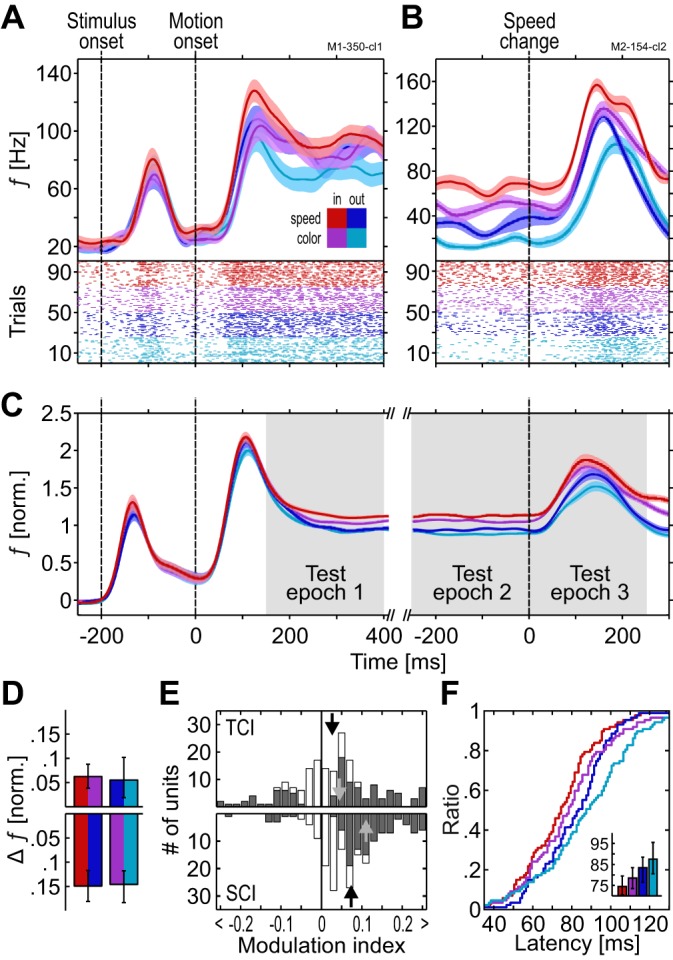
Task-specific modulation of firing rates. A and B: spike-density function (SDF) and corresponding scatter plot of 2 example units. Color scheme indicated by the inset in A is used throughout the figures: in, attend inside RF; out, attend outside RF; speed, detect speed change; color, detect color change. In the scatter plots, each mark at the bottom of the SDFs represents the time of a single spike. For illustration purposes, trials were sorted by condition. C: population SDF (n = 187) during all trial periods in each of the 4 conditions. Shaded areas represent SE. D: firing rate (FR) difference between conditions. Top, task effect (TCI); bottom, combined effect of spatial and direction attention (SCI). Left and right colors in each bar indicate the attentional conditions that were subtracted from each other. E: distribution of TCIs (top) and SCIs (bottom). Open bars, all units; gray bars, significantly modulated units; black arrows, median modulation indexes (MI) of all units; gray arrows, median MI of significantly modulated units. F: cumulative distribution of response latencies during test epoch 3. Inset: median latencies (error bars, 95% CI). f, Frequency; norm., normalized.
Following motion onset, monkeys had to attend the cued location and feature dimension and to signal detection of the target event (either a speed or a color change) by releasing the lever within 150 to 750 ms after the stimulus change. Target events occurred pseudorandomly between 660 and 5,500 ms after motion onset. Prior to these changes, up to three distractor events may have occurred, all of which had to be ignored. These distractor events consisted of a change in the currently relevant feature dimension at the uncued location and/or a change in the irrelevant feature dimension at the cued and/or the uncued location. Their number and sequence varied pseudorandomly. These trials increased the attentional demand for the monkeys and allowed us to verify that they were following the cue instructions. Throughout the trial and until 300 ms after the lever release, monkeys had to keep fixation within a circular eye window of 2° in diameter, centered on the fixation point. To support selective attention to the relevant feature dimension (instead of more global attention to any change at the attended object), the speed-change task and the color-change task were presented blockwise. The task order was alternated between recording sessions. Within a block, the two spatial conditions of each task type were fully interleaved. We aimed to collect 25 successful trials for each of the 4 experimental conditions during which the speed change at the RF location was the first change event. This was behaviorally relevant only in the attend-in condition of the motion task, but irrelevant during the color task and the two attend-out conditions. Because they allowed comparison of the different attention conditions in response to identical visual stimulation, only these trials entered data analysis. About 30% of all trials were catch trials. These were disregarded for analysis.
Data analysis.
Data were analyzed with the use of MATLAB R2011b and later releases (The MathWorks, Natick, MA), using both in-built and custom-made functions. Spikes were detected and sorted semiautomatically, as previously described in detail (Galashan et al. 2011). Spike thresholds were set by four times the median of the absolute values of the high-pass filtered signal (Quiroga et al. 2004), where applicable, and otherwise by three times the signal’s SD. Occasionally, these thresholds had to be corrected manually. Preferred motion direction and significant direction tuning of the spike-sorted data were estimated offline using a response reliability approach (Grabska-Barwińska et al. 2012).
We collected data from 303 units, for which we obtained a sufficient visual response (>1 SD above spontaneous activity and >10 Hz) and at least 10 trials per experimental condition (mean: 25.1); 61 (20%) of these were excluded from data analysis due to slow electrode drifts over the course of the session. Electrode drifts were identified on basis of laboratory notes during recordings and careful visual inspection of the data, as well as by semiautomated procedures taking the mean FR over the course of the session into account. From the 243 remaining units, another 56 were not analyzed because they did not fulfill all of the following inclusion criteria: 1) behavioral performance in both tasks above 75% (14%), 2) significant direction tuning (5%), and 3) deviation between stimulating and preferred motion direction below 90° (3%). The final data set consisted of 187 units gathered in 130 recording sessions. For 116 of these units, their preferred direction was within 15° of the stimulating motion direction (mean deviation: 7.1°), estimated by offline analysis of the spike-sorted data. For the remaining units, preferred and stimulating motion direction differed between 15.4° and 72.5° (mean: 30.9°, n = 71). All results derived from the entire database hold true if only units stimulated within 15° of their preferred motion direction are considered.
Spike-density functions (SDF) were calculated within a 100-ms time window, shifted by 1 ms and smoothed by a Gaussian kernel (σ = 20 ms). Population responses were computed by subtracting each neuron’s mean baseline activity from its response, normalizing the response to the mean FR of all conditions during the period 400 ms before the speed change, and averaging over the normalized responses of all individual units. Modulation indexes (MI) were defined as
where cond1 and cond2 relate to each unit’s pool of trials from the speed-change and the color-change task, respectively, for investigating task-specific response differences (task condition index, TCI), and, analogously, to each unit’s pool of trials from the attend-in and attend-out conditions for investigating the combined effect of spatial and direction attention (spatial condition index, SCI).
Response latencies were calculated as the point in time at which the transient FR increase following the speed change reached 75% of its maximal peak (Galashan et al. 2013). Peak responses were required to occur between 20 and 300 ms after the speed change. Latencies were only calculated for units responding with a significant FR increase to the acceleration of the motion stimulus in each of the four experimental conditions (Wilcoxon signed rank, α < 0.05, n = 87). To investigate whether systematic differences in response latencies were independent of the magnitude of the transient speed-change response, we performed a rate-matching procedure by randomly searching for combinations of 10 trials per unit having the same transient peak rate in each of the two conditions to be compared (e.g., same peak rate in the speed and color task with attention allocated toward the RF). We found such trial combinations for 84–86 of the 87 neurons with significant post-change transients in each experimental condition.
Trial-to-trial variability was measured by calculating the Fano factor (FF; mean normalized variance of spike counts) in successive, nonoverlapping time windows during the 250 ms before the speed change. Window width varied between 5 and 125 ms, increased stepwise by 1 ms. For each width, the FF is reported as the mean of all windows. To investigate whether FF effects depended on FR differences between conditions, we performed another rate-matching procedure by searching for groups of 10 trials per experimental condition and unit for which the mean absolute FR did not differ by more than 1 Hz. This was done for successive, nonoverlapping 50-ms windows during the 250-ms period starting before the speed change. For each of the windows, we found such trial combinations for at least 174 of 187 units, and 182 neurons were considered for the statistical analysis of the pre-change epoch, during which FRs were relatively stationary.
Spike-count correlations (SCC) were computed for 38 pairs of simultaneously recorded units, using the same integration windows as for the FF. We only considered units recorded at different electrodes. For each pair, the raw spike counts were converted to z scores, and the SCC was calculated as the Pearson correlation of z scores across trials. Because this measure is sensitive to outliers, we excluded data segments that were >3 SD of the mean for a given window and unit.
To investigate whether response differences between the four experimental conditions depended on the similarity between the neurons’ preferred features and the actual stimulus properties, we extracted the 50% of neurons from our database for which stimulus motion direction and speed were least optimal. To this end, we first calculated the deviation Δϕ between stimulus direction ϕstim and a unit’s preferred direction ϕpref as their absolute difference:
For speed preference, we considered the transient FR change following the speed-up of the stimulus as an indicator for the mismatch between stimulus speed and preferred speed. Large positive transients only occur for neurons with a preferred speed clearly above the stimulating speed before the change (Traschütz et al. 2015), thus indicating neurons with a speed preference substantially deviating from the speed of the stimulus. The transient’s amplitude for each neuron was calculated by dividing the mean FR during the 250 ms after the speed change by the mean FR during the 250 ms before the speed change, taken from the attend-in speed task:
For the identification of neurons with nonmatching feature preferences, neurons were ranked according to both their Δϕ value and their ΤΑ value. We then sorted all neurons by the sum of their ranks and distributed them to two groups of “units with least-matching tuning” and “remaining units” by splitting across the median.
To quantify the amount of explained variance for the relevant response variables (time, spatial condition, task condition, and interaction of spatial and task condition) and to reconstruct the time course of task-specific response modulation, we performed demixed principal component analysis (dPCA; Brendel et al. 2011; Kobak et al. 2016). dPCA was run using the original MATLAB code as provided by the authors (https://github.com/machenslab/dPCA). In contrast to standard PCA, dPCA considers the data labels such that principal components depend on stimulus and task parameters, and allows demixing of data with arbitrary combinations of parameters. In our experiments, these parameters correspond to the stimulus-dependent neuronal response over time T, the two spatial conditions SC, and the two task conditions TC. The number of available data points X can be thought of as a SC-by-TC dimensional trajectory of length T in n-dimensional space, where n corresponds to the number of recorded units. By considering the labels of each data point, dPCA decomposes X into independent parts to estimate the variance attributable to one of the parameters T, SC, and TC. Thus XT captures the variance due to stimulation over time, independent of spatial and task condition, whereas XSC captures the variance due to spatial condition that cannot be explained by XT. In turn, XTC describes the variance due to task conditions that cannot be explained by time and spatial condition, and XSC/TC describes the variance due to interaction between spatial and task condition that is not explained by the previous parameters. Because dPCA requires the same number of time bins T for all trials, the steady-state response between 200 ms after motion onset and 200 ms before the speed change was restretched to 260 time bins for each trial (cf. Kobak et al. 2016). For the shortest trials, this conformed to the original SDF resolution of 1 ms/bin; for the longest trials, each bin represents the SDF over a period of 4.4 ms. After they were restretched, each trial was described by a vector of 910 bins, lasting from motion onset to 250 ms after the speed change. To avoid overfitting, dPCA on each of the data sets was performed by adding a regularization term λ, as described in Kobak et al. (2016).
Statistics.
Statistical analysis was performed using nonparametric tests (balanced Friedman test, 2-sided Wilcoxon signed-rank test). Confidence intervals (CI) were obtained by bootstrapping the data with 5,000 resamples using the bias-corrected and accelerated percentile method (DiCicio and Efron 1996; Efron and Tibshirani 1993). For dPCA, periods of significant classification were computed by 100 iterations of stratified Monte Carlo leave-group-out cross-validation, as implemented in Kobak et al. (2016).
RESULTS
Behavioral task and performance.
Monkeys were trained on two variants of a feature-change detection task, and neuronal processing in area MT was investigated as a function of task requirements, attended motion direction, and spatial deployment of attention (Fig. 1, A and B). In both variants of the task, stimuli consisted of two gray Gabor patches with inherent motion. One Gabor was placed inside the RF of the recorded unit while the other one was inversely mirrored across the fixation point. The monkeys’ task was to detect either an instant 100% speed change or a sudden isoluminant color change to yellow. Each trial started with the appearance of a fixation point, indicating the task type by color (yellow, color task; red, speed task), followed by a spatial cue to signal target location (0.5 s). With a delay of 0.5 s, the two Gabors appeared simultaneously and started to move 0.2 s later. The Gabor within the RF moved approximately in the preferred direction of the recorded unit, and the other one moved in the opposite direction. Color and speed changes occurred at pseudorandom points in time 0.66 to 5.5 s after motion onset. They had to be ignored by the monkeys unless they were cued. The rationale of this 2 × 2 design was to implement two different task conditions that direct attention either toward or away from the motion domain, at a location inside or outside the neuron’s RF. Because of the opposite motion directions, the RF stimulus was unattended in terms of both spatial location and motion direction when monkeys attended outside the RF, allowing to investigate an experimental condition for which FSG does not apply. The speed- and the color-change tasks were presented blockwise, and the order of blocks was balanced over recording sessions, whereas spatial conditions were fully interleaved. Monkey 1 (M1) performed both tasks with 87% accuracy, with no statistical difference between tasks [Friedman test, χ2(1) = 0.88, P = 0.35, n = 53]. Monkey 2 (M2) made extremely few errors and performed the speed and the color task with 99% and 97% accuracy, respectively, which nevertheless was a statistical difference [χ2(1) = 15.03, P < 10−3, n = 77; Fig. 1C]. For neither monkey was there a significant performance difference with respect to the attended location [both animals: χ2(1) < 2.77, P > 0.096; Fig. 1D]. Regarding reaction times, monkeys detected color changes significantly more quickly than speed changes [χ2(1) = 121.94, P < 10−27, n = 130], with color change detection leading by 31 ms, on average (Fig. 1E). This is to be expected, due to the faster sensory processing of color, and in line with the processing time differences previously described (Arnold et al. 2001; Linares and López-Moliner 2006; Moutoussis and Zeki 1997). Attending toward or away from the RF yielded no significant difference between reaction time distributions [χ2(1) = 0.05, P = 0.82]. Overall alertness was tested by calculating the time interval between fixation point onset and trial initiation by lever press, assuming that increased or reduced alertness would lead to accelerated or delayed trial initiation, respectively. M1 initiated trials equally fast in both tasks (488 vs. 475 ms, Z = 1.17, P = 0.117), whereas M2 was slightly slower in the speed task (631 vs. 610 ms, Z = 2.86, P = 0.004). No changes in trial initiation time were observed during the course of the recording sessions (linear regression fits for both monkeys and tasks, all F < 3.61, all P > 0.06). Taken together, the behavioral data show no, or only minor, nonsystematic differences regarding both task type and attended location/direction.
Task-specific firing rate modulation.
We investigated task-related modulations of MT responses by comparing neuronal activity depending on whether motion was relevant or irrelevant for the task. Visual stimulation was identical across tasks until the first feature change (Fig. 1, A and B) such that for each of the two spatial conditions, neuronal activity is expected to be the same in the speed and the color task unless dependent on task requirements. Specifically, for attention directed to the RF, the motion direction of the attended Gabor usually matched, or was close to, the preferred direction of the recorded neuron. If FBA spreads to task-irrelevant target features (Katzner et al. 2009), the recorded neuron should receive about the same attentional gain in both tasks. In turn, for attention directed to the stimulus outside the RF, the motion direction of the attended Gabor is ~180° away from the stimulating, preferred motion direction of the recorded neuron. Under this condition, the neuron should receive no motion direction-related gain in any of the tasks (Martínez Trujillo and Treue 2004). However, for many of the recorded neurons, we found a significant response difference between tasks, with attention directed toward or away from the RF stimulus. Figure 2 provides two examples. For the single-unit shown in Fig. 2A (with responses aligned to motion onset), recorded from M1, FRs were considerably higher when the monkey performed the motion task compared with the color task, even during the attend-out condition, when attended motion direction was opposite to the motion inside the RF. Likewise, the multiunit shown in Fig. 2B (with responses aligned to the speed change), recorded from M2, was more active in the speed task throughout the period before the speed change as well as during the transient response following the speed-up of the RF stimulus, again independent of the spatial focus of attention and attended motion direction. In all trials contributing to these SDFs, the speed change was the first change event; i.e., visual stimulation was identical across the four experimental conditions. In addition to this task-specific response difference, neurons were more active when attention was directed toward the RF. Note that the difference between the two spatial conditions reflects the combined effect of spatial and feature-based attention, because the Gabor outside the RF moved opposite to the preferred motion direction of the recorded neuron.
The units shown in Fig. 2, A and B, are representative of the population of MT neurons (187 units: M1, 24 single units, 46 multiunits; M2, 57 single units, 60 multiunits), calculated as the mean of the normalized, baseline-corrected responses of individual units. In both spatial conditions, FRs were consistently higher in the speed task than in the color task (Fig. 2C). This task-specific response difference was of smaller magnitude than the difference between spatial conditions but evident throughout the trial, affecting the steady-state response during stimulation with base speed as well as the transient response representing the speed change. Neurons responded strongest during the attend-in condition of the speed task and weakest during the attend-out condition of the color task. Statistical testing was carried out by a nonparametric ANOVA applied to the collapsed data of three 250-ms test epochs (gray-shaded areas in Fig. 2C, referring to the sustained response after the motion onset transient, the sustained response before the speed change, and the transient response following the speed change). Both the factor task condition and the factor spatial condition had a highly significant influence on the FR of the MT population [Friedman tests, task: χ2(1) = 11.85, P < 10−3; spatial condition: χ2(1) = 86.59, P < 10−19]. Individual testing of the single epochs confirmed this finding [Friedman tests, all χ2(1) > 5.34, all P < 0.0209]. To test whether response differences between tasks depended on the spatial condition and, likewise, whether differences between spatial conditions depended on task, we compared the FRs between the tasks and spatial conditions separately (Fig. 2D). Significant response differences between the two spatial conditions were evident in both tasks (Wilcoxon signed-rank test: both Z > 8.81, P < 10−17), and a significant task effect was evident for the attend-in condition (Z = 3.78, P < 10−3). More importantly, however, we found significantly higher FRs in the speed task for attention directed outside the RF, i.e., to a motion direction opposite to the stimulating, preferred direction of the neuron (Z = 3.12, P = 0.0018). This effect was evident also if restricted to the mere population of single units (Z = 3.23, P = 0.0012, n = 81), as well as for the individual animals (M1: all Z > 2.15, all P < 0.0313, n = 70; M2: all Z > 2.31, all P < 0.0206, n = 117). Thus neuronal responses where consistently higher in the speed task, independent of both the spatial location of attention and the relation between the attended motion direction and the neurons’ preferred motion direction.
We next investigated how many of the individual units carried the task-specific response difference seen in the population. We found that 55% of all units had significantly different FRs between tasks (Friedman tests, P < 0.05), and 71% of these were more active in the speed task. To further test the sign and strength of this modulation, we converted the firing rate differences into a modulation index for response differences dependent on task condition (TCI), ranging from −1 to 1. The TCI is positive for neurons having higher activity during the speed task (see materials and methods). Collapsed over the three 250-ms time epochs, the median TCI of the entire population was 0.031 (significantly modulated units only: 0.059), and the distribution of index values was significantly greater than zero (Wilcoxon signed-rank test, Z = −3.65, P < 10−3; Fig. 2E, top). The median TCI of the individual epochs 1–3 was 0.011, 0.037, and 0.03, respectively, and all distributions were significantly different from zero (Z < −2.3, P < 0.0217), independent of whether the monkeys started with the speed or the color task (Z < −2.091, P < 0.0365). For comparison, we also calculated an index for the spatial condition (SCI). We found that 57% of all neurons had a significantly modulated SCI, and 92% of these were more active during the attend-in conditions. The collapsed median SCI of all neurons was 0.07 (significantly modulated units only: 0.106; Fig. 2E, bottom), and the median SCI of the individual epochs was 0.049, 0.075, and 0.076. All distributions were significantly different from zero (Z < −6.74, P < 10−10).
Task-dependence of neuronal latencies.
As shown in Fig. 2, B and C, firing rate increments following the speed change of the RF stimulus not only differed in amplitude but also seemed to vary in latency. Recently, we and others have shown that response latencies are significantly modulated by spatial attention (Galashan et al. 2013; Khayat and Martinez-Trujillo 2015; Sundberg et al. 2012) and closely correlate with reaction times (Galashan et al. 2013; Traschütz et al. 2015). Hence, because psychophysically reaction times for speed changes are faster in a speed task than in a color task (Wegener et al. 2008; 2014), we hypothesized that MT response latencies to speed changes will depend on task conditions as well, and will be shorter if speed is behaviorally relevant. We therefore analyzed the latency of the transient FR increase in response to the speed change (test epoch 3, cf. Figure 2C) of all neurons for which their speed tuning promoted an identifiable response peak in each of the four conditions (n = 87). Cumulative latency distributions were in line with our previous result on the influence of spatial attention (Galashan et al. 2013) and revealed an attention-dependent leftward shift of the curves in the speed task, both with attention directed to the RF and away from it (Fig. 2F). In the attend-in conditions of the speed and the color task, the median latencies were 75 and 79 ms, respectively, and in the corresponding attend-out conditions, they were 84 and 88 ms, respectively (Fig. 2F, inset). A Friedman test on the factors task and spatial condition revealed a significant influence of each factor [task effect: χ2(1) = 5.08, P = 0.0242; spatial condition: χ2(1) = 14.3, P < 10−3]. Post hoc Wilcoxon signed-rank tests confirmed the task effect both with attention directed toward the RF and away from it, and also confirmed the combined influence of spatial and direction attention on MT neuronal response latencies for both tasks (all Z > 2.14, all P < 0.0326). To further investigate whether this latency reduction is a native effect of attention or, alternatively, a consequence of higher firing rates during the post-change response, we rate-matched the transients of the four experimental conditions (see materials and methods). However, latencies in the four comparisons (task-dependent effect inside and outside RF, spatial condition effect in speed and color task) were still significantly different (Wilcoxon signed-rank tests, all Z > 1.97, all P < 0.04, n = 84, 85, 86, and 85). This result suggests that, like spatial attention (Galashan et al. 2013), task-dependent, dimension-based attentional modulation forces a leftward shift of the latency distribution within the speed task, independent of differences in the magnitude of the speed change response.
Task requirements and neuronal variability.
Because the signal-to-noise ratio of a population of neurons depends on both signal strength and variability, we next investigated neuronal response fluctuations. We calculated the Fano factor (FF) of each unit and the spike-count correlation (SCC) of 38 simultaneously recorded pairs of units. Because independent and correlated response variability fluctuates on a range of timescales, both FF and SCC depend on the width of the integration window over which spikes are counted (Smith and Kohn 2008). To obtain an unbiased estimate, we used multiple window sizes (5- to 125-ms bin width, increased stepwise by 1 ms).
We applied this analysis to the last 250 ms before the speed change (during which FRs were relatively stationary). Both the FF and SCC varied significantly as a function of behavioral condition (Fig. 3, A and C). For example, for a window size of 50 ms, we found significantly different FFs between tasks both for attention directed toward the RF and away from it (Wilcoxon signed rank tests, Z > 2.29, P < 0.0222, n = 187). Likewise, the SCC of both spatial conditions was significantly smaller in the speed task (Z > 2.94, P < 0.0033, n = 38). Testing other window sizes demonstrated that the statistical outcome of the FF was consistent among most widths below 100 ms, indicating a reduced trial-to-trial variability in the speed task (Fig. 3B). For the SCC, statistical differences were found for the majority of integration windows, independent of the spatial condition (Fig. 3D). For comparison, we also compared the two spatial conditions and found a corresponding and very robust influence, in line with previous results on spatial attention (Cohen and Maunsell 2009; Cohen and Newsome 2008; Galashan et al. 2013). FF differences were highly significant (Z > 5.1, P < 10−4) for all window sizes, and SCC results were consistent among most windows (Fig. 3, B and D). The combination of spatial and direction attention had a stronger influence on the FF than the task type, but their effect on the SCC was about equally strong. We also tested whether the FF modulation was mainly due to differences in FR or, alternatively, independent of these. We applied a mean-matching procedure to 5 nonoverlapping 50-ms time windows and estimated the FF for an integration window of 50 ms. FFs were smaller during the speed task [Friedman test, χ2(1) = 4.77, P = 0.029, n = 186] and for attention directed to the RF [χ2(1) = 33.21, P < 10−8]. Post hoc tests revealed a significant task effect inside the RF (Wilcoxon signed rank, Z = 2.37, P = 0.0177), but not so for attention directed away (Z = 1.08, P = 0.2821). The modulation between spatial conditions was significant in both tasks (Z > 4.22, P < 10−4). Thus the task-dependent reduction in trial-to-trial variability occurs independently of changes in FR, yet presumably restricted to the task-relevant visual stimulus.
Fig. 3.
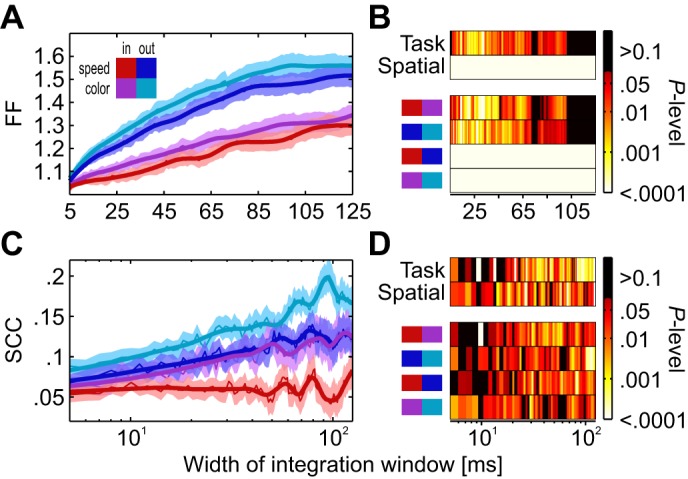
Variability of responses depending on attentional condition. A and B: Fano factor (FF) of spike counts for integration windows between 5 and 125 ms in width (A) and color-coded P values for Friedman tests (B, top rows) investigating the factors task and spatial condition and for Wilcoxon tests (B, bottom rows) comparing single conditions. Color coding ranges between P values of 10−4 and 10−1. Larger and smaller values are colored black and white, respectively. C: spike-count correlation of 38 pairs of simultaneously recorded neurons for different integration windows. D: statistical outcome for different integration window widths. Conventions are as in B.
Relation between feature preference and magnitude of response modulation.
The various analyses described earlier provide evidence for a robust influence of the specific change detection requirements on various parameters of the neuronal population response in MT. The finding of a significant, task-dependent response difference when the RF stimulus was unattended in terms of both spatial and feature-based attention (attend-out conditions) suggests a top-down signal to area MT affecting neurons independent of the similarity between attended and preferred motion direction. To further test this hypothesis, we applied a control analysis to investigate whether the strength of this dimension-based modulation relates to the neurons’ specific tuning properties or, alternatively, is independent of these. Because stimulus direction sometimes deviated from the neurons’ preferred direction (mostly due to paired recordings) and stimulus speed was not matched to the neurons’ speed-tuning properties, we isolated those units for which the stimulus was least matching with their tuning preferences. To this end, we sorted all neurons according to 1) the difference Δϕ between their preferred motion direction and the actual stimulus direction (Fig. 4, A and B), and 2) the size of the transient ΤΑ following the speed change (to identify neurons for which the speed before the change was clearly away from their preferred speed; see materials and methods; Fig. 4, C and D). On this basis, we ranked all neurons according to their Δϕ value and to their ΤΑ value, and used the sum of these ranks to identify the 50% of neurons with the least-matching tuning (n = 93; Fig. 4, E and F). The population SDFs of these neurons reveal the same pattern in firing rate differences as the entire population (Fig. 4G), with significant FR differences regarding both task type [Friedman tests: χ2(1) = 6.76, P = 0.009, n = 93] and spatial condition [χ2(1) = 72.87, P < 10−16, n = 93]. Post hoc Wilcoxon tests confirmed the results for both the task effect in the two spatial conditions (Z > 1.97, P < 0.049) and the modulation between spatial conditions in the two tasks (Z > 5.41, P < 10−7). For comparison, we also investigated the group of remaining neurons, consisting of many units with best-fitting direction tuning and likely also some neurons with appropriate speed tuning (Fig. 4H). As to be expected from the main analyses, both the effect of task type [Friedman tests: χ2(1) = 12.1, P < 10−3, n = 93] and spatial condition [χ2(1) = 74.23, P < 10−17, n = 93] were significant, as confirmed by post hoc testing (Wilcoxon signed-rank tests, all Z > 1.99, all P < 0.048). However, these effects had about the same strength as for the least-matching neurons. The median TCI was 0.031 and 0.034 for the least-matching and the remaining units, respectively, and the median SCI was 0.075 and 0.077. A statistical analysis did not reveal significant differences between the TCI and SCI distributions of the two pools of units (Wilcoxon rank sum tests, Z < 0.56, P > 0.57), but all distributions were significantly different from zero (Wilcoxon signed-rank test, all Z > 2.66, all P < 0.008). As a further control, we separately investigated the task effect for the 50% of neurons with the largest deviation from preferred direction (highest Δϕ) and the 50% of neurons with the largest deviation from preferred speed (highest ΤΑ values), and again found a significant task effect in both cases [Friedman tests, 50% highest Δϕ: χ2(1) = 5.5306, P = 0.018, n = 93; 50% highest TA: χ2(1) = 5.8429, P = 0.0156, n = 93], confirmed by post hoc tests (Wilcoxon signed-rank test, all Z > 2.25, all P < 0.024, n = 93). Thus, in line with the main result of a significant task effect in response to stimuli unattended in terms of both spatial location and motion direction, the subclass of neurons with the least-fitting tuning properties (regarding either direction or speed, or the combination of both) also showed a significant task-dependent modulation.
Fig. 4.

Influence of motion and speed preference on task-dependent response modulation. A: sketch of 2 direction-tuning curves with small and larger deviation between preferred direction ϕpref (black vertical lines) and stimulus direction ϕstim (red line). B: distribution of neurons depending on the absolute deviation ϕpref − ϕstim. C: sketch of 2 log-Gaussian-shaped speed-tuning curves. Solid black curve, speed-dependent responses of a neuron for which the base speed of the stimulus (solid vertical red line) is close to preferred and target speed (dashed vertical red line) is preferred; dashed black curve, speed-dependent responses of a neuron preferring higher speeds; red arrows, vectors indicating the FR increase for a jump from base to target speed, as expected from each neuron’s speed tuning. Note that the to-be-expected FR change of the suboptimally driven neuron is about twice the size of the well-driven neuron. D: distribution of transients with different amplitude, as expressed by the ratio between the post-change response and the pre-change response (test epochs 3 and 2 in Fig. 2). E: distribution of rank-sum values after all neurons were sorted according to the deviation between preferred speed and stimulus speed and to their transient’s amplitude (TA), split by median (dashed black line). Blue bars indicate the 50% of neurons with the highest rank sum, indexing units with least-matching tuning properties regarding the actual stimulus properties. F: combination of Δϕ and ΤΑ values for all units. Blue circles indicate the neurons with the highest rank sum. G and H: population responses of neurons with the highest rank sum (units with least-matching tuning; G) and the lowest rank sum (remaining units; H).
For both of the tuning-sorted groups, we next investigated how much variance of the response can be explained in terms of task parameters and performed demixed PCA (Brendel et al. 2011; Kobak et al. 2016). Demixed PCA (dPCA) seeks to capture the maximum amount of variance by a minimum number of parameters and allows reconstruction of the time course of spike trains as a function of these parameters (see materials and methods). Based on 20 components, dPCA explained 82% and 90% of the total variance in the two groups, which was not too much below standard PCA (95% and 97%). For both groups, most of the variance (76%–84%) was explained by the stimulus’ time course (from motion onset to 250 ms after the speed change), independent of condition (Fig. 5, A and B). Because of the large transient following the speed change, this was higher in the group of neurons with the least-matching tuning (Fig. 5, C and D). The spatial conditions (combining both spatial and direction attention) explained 7% and 11% of the variance, and task conditions explained another 6% and 9%. The remaining variance was due to the interaction between spatial and task conditions (3% and 4%). Apart from the condition-independent components, reconstructed neuronal responses (Fig. 5, E–J) were very similar for both tuning groups. Independent of the sorting criteria, the spatial condition was significantly classified after the firing rate reached a steady-state level, ~200 ms after motion onset, and during the remaining response period (Fig. 5, E and F). Explained variance by task type allowed for significant classification of the task during the entire trial period, starting already during the initial motion onset transient and lasting until the end of the response (Fig. 5, G and H). This difference in time course for classifying the spatial and task conditions does not necessarily represent a difference in the underlying mechanism but may be due to the difference in cueing (task condition lasted for a block, spatial condition was cued at the beginning of each trial). However, the dPCA results show that a significant amount of variance is explained by task type even when the tuning to the stimulus is clearly suboptimal. In summary, both the result of the attend-out condition (for which the attended motion direction and preferred motion direction of the recorded neuron deviated by up to 180°) and the analysis of mean responses and amount of explained variance of neurons with suboptimal tuning suggest that the task effect is independent of the similarity between the attended and preferred features, supporting the hypothesis of a dimension-based modulation of response properties due to the specific demands of the task.
Fig. 5.

Amount of explained variance as a function of stimulus and task parameters. A and B: percentage of explained variance for 50% of units with least-matching tuning (A) compared with the remaining 50% of units (B), estimated by dPCA. Colors in pie charts correspond to variance explained independently of condition (gray) and by spatial condition (blue), task condition (red), and interaction between spatial condition and task (purple). C and D: reconstructed spike trains showing explained variance essentially independent of experimental condition, due to visual stimulation. E–J: reconstructed spike trains showing explained variance due to spatial condition (E and F), task condition (G and H), and interaction of spatial condition and task (I and J). Horizontal black bars indicate periods of significant classification.
Modulation of spontaneous activity.
We finally asked whether this dimension-based facilitation of MT responses depends on the presence of visual input, and therefore analyzed the spontaneous activity before onset of the spatial cue. During this epoch, monkeys already knew the task type because of the color of the fixation point, but not the to-be-attended motion direction of the upcoming target. We found that FRs in the speed task were 8.3% higher than in the color task [Friedman test, χ2(1) = 43.46, P < 10−10, n = 187], whereas no such difference was found if the same trials were sorted according to their later spatial condition [χ2(1) = 1.97, P = 0.16]. We then investigated whether this baseline shift affected neurons differently, depending on their tuning (Fig. 6). However, in neither the speed nor the color task was there any statistical difference between the units with the least-matching tuning and the remaining units [Kruskal Wallis tests, both χ2(3) < 1.42, P > 0.23], but for both tuning groups the across-task comparison revealed a highly significant baseline shift (Wilcoxon signed-rank tests, all Z > 2.89, all P < 0.0038). This indicates that MT received an early, general boost targeting neurons, independent of their tuning in the speed task, and suggests that baseline activity in MT is actively adjusted as a function of task requirements.
Fig. 6.
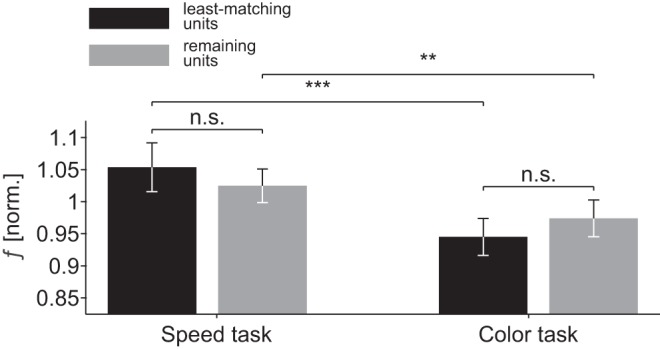
Normalized spontaneous activity depending on direction and speed-tuning preferences. Errors bars, 95% CI. *P < 0.05; **P < 0.01; ***P < 0.001; n.s., not significant.
We also tested whether this difference in baseline activity can account for the significant response differences during evoked responses, and subtracted the spontaneous activity in a condition-specific manner; i.e., we set each condition to the same baseline level. However, this procedure did not eliminate the task-dependent modulation seen in the population SDF during visually evoked responses [(Friedman test, χ2(1) = 4.27, P < 0.039, n = 187; post hoc Wilcoxon signed-rank tests for attention inside and outside RF: Z > 2.3, P < 0.021]. Thus, although baseline activity is adjusted according to task requirements, task-dependent differences in the evoked response do not constitute a pure reflection of an early baseline shift but get significantly amplified during later visual processing.
DISCUSSION
Location-independent, feature-directed attention plays a crucial role in everyday life. A considerable amount of our knowledge about its neuronal mechanisms has been gained by experiments examining the processing of feature attributes, e.g., a specific color hue or motion direction (David et al. 2008; McAdams and Maunsell 2000; Treue and Martínez Trujillo 1999) and several models of visual attention built on attribute-specific top-down modulations (Corchs and Deco 2004; Wagatsuma et al. 2013). A key finding of FBA studies in area MT is that attending to a specific motion direction facilitates the response of those neurons in area MT well tuned to that attended attribute, whereas it does not modulate, or even suppresses, the response of neurons with a clearly different tuning (Martínez Trujillo and Treue 2004). These works constituted an important step forward in understanding the neuronal mechanisms by which the brain modulates information processing according to the behavioral requirements. However, there is another line of evidence suggesting a presumably more general modulation of neuronal responses when a specific stimulus feature is attended. In a neuroimaging study requiring attention to either color or speed, both the baseline and stimulus-evoked blood oxygen level-dependent (BOLD) signal were found to be enhanced in areas V4 and MT, respectively, depending on task requirements (Chawla et al. 1999). Because the signal increase was evident in MT even when subjects were presented with a stationary stimulus at the beginning of a speed trial, and in V4 when they were presented with a monochromatic stimulus at the beginning of a color trial, the authors concluded a task-dependent change of the attentional set, making those neurons more sensitive that process the relevant feature dimension. Similarly, in several visual search experiments, Müller and colleagues (Akyürek et al. 2010; Gramann et al. 2010; Töllner et al. 2010) found that both reaction times and error rates benefit from a feature dimension-match between a preceding cue and the to-be-searched item. Interestingly, if the cue also matched the target’s feature attribute, they did not find a further improvement of behavioral performance. These behavioral data were accompanied by cue dimension-related modulations of the event-related potential (ERP), which were evident both in the early component of the ERP, indicating differences in attentional set, and in a later component, reflecting a sustained, feature dimension-related attentional modulation. Finally, in a recent EEG experiment, we were able to disentangle the influence of dimension- and attribute-specific attentional effects (Gledhill et al. 2015). Using a delayed match-to-sample task, we found that a match in the feature dimension between a precued, upcoming target stimulus and a spatially unattended, task-irrelevant stimulus is associated with a stronger negativity during the selection negativity period (representing an event-related measure of feature selection; Anllo-Vento and Hillyard 1996; Torriente et al. 1999) compared with a stimulus defined in the nonattended dimension. A match in the feature attribute provided an additional modulation on top of the dimension-based modulation, coming with longer latency and restricted to occipitoparietal electrodes.
The neurophysiological results described in the present study are well in line with these human psychophysical, EEG, and imaging studies, suggesting that task-specific, dimension-based effects of feature-directed attention are reflected by an attention-dependent weighting of the cortical module most sensitive to processing of the attended feature dimension. In addition to an increase of response rates in the motion task (both with and without visual stimulation), MT neurons showed reduced trial-to-trial fluctuations and reduced spike-count correlations, as well as faster change transients when motion was behaviorally relevant, regardless of both the spatial focus of attention and the similarity/dissimilarity between the attended and the recorded neurons’ preferred motion direction. Our analyses showed that 1) the task-specific FR differences during both baseline and evoked responses are independent of the neurons’ specific direction or speed preferences; 2) the differences in the evoked response rate exceed the differences during baseline and are still of significant magnitude after full elimination of baseline-related FR differences; 3) the task-specific latency shortening of change transients is independent of both spatial attention and the relation between the attended and the stimulating motion direction, as to be expected from psychophysical results (Wegener et al. 2008; 2014); and 4) the differences in response variability and in response latency cannot be accounted for by differences in the firing rate, because they also were evident after rate matching. Taken together, the results provide evidence for the notion of an attention-dependent, feature dimension-based weighting of visual processing at the neuronal level, and they provide mechanistic insights into earlier reports from human studies in support of an early dimension-based modulation of the attentional set and lasting modulatory processes influencing the processing of the behaviorally relevant stimulus (Chawla et al. 1999; Gramann et al. 2010).
Comparison to other neurophysiological studies investigating task-specific components of visual attention.
At the level of single cells, two recent studies addressing motion processing as a function of task requirements did not find corresponding experimental evidence (Chen et al. 2012; Katzner et al. 2009). When recording from neurons in area MT, Katzner et al. (2009) investigated attentional modulations in a speed and in a color task, with an experimental paradigm similar to the one used in the present study. In accordance with our results, they found that spatial attention increased MT firing rates even if color was the anticipated change feature. However, the FSG-related response difference between attending a preferred vs. a nonpreferred motion direction was of the same size irrespective of the task. The authors concluded that response modulation by both FBA and spatial attention occur independently of specific task requirements. Their results match the predictions of, and experimental findings from, object-based attention studies, proposing that attending a specific feature of a target object facilitates the processing of other, nonattended features of that object (Blaser et al. 2000; Duncan 1984; Ernst et al. 2013; O’Craven et al. 1999; Rodríguez et al. 2002; Schoenfeld et al. 2003; Wannig et al. 2007). Another MT study required monkeys to make a saccade into one of four previously trained directions in response to either the color or the motion direction of a briefly presented grating stimulus (Chen et al. 2012). In 25% of the trials, the saccade direction for indicating the color was congruent with the motion direction of the grating, but in 75% of the trials it was incongruent, requiring the animal to focus on the task at hand to provide the correct response. However, only 22% of MT neurons showed significantly different responses between tasks, and of these, some were more active during the direction task, and others were more active during the color task.
Despite methodological differences, including experimental paradigms, visual stimulation, and data analysis, we consider one major difference in the experimental design to be important to understand the proper conditions under which the visual system facilitates or suppresses the processing of an entire feature dimension. In both former studies, monkeys had to frequently switch between motion and color trials, whereas in the present study, they were required to engage in one type of task for several dozen trials. A strong engagement in one specific task type (and hence, strong attention to one specific feature dimension) is, however, more likely to occur if this task is performed for a prolonged time, compared with frequently switching between tasks. This interpretation is in line with psychophysical investigations that used task and stimulus conditions similar to those in the present neurophysiological experiments (Wegener et al. 2008). In that study, subjects were required to respond to any speed or color change as fast as possible. When they were given a feature dimension cue of 75% validity, they responded very quickly to the indicated change, but they responded much slower if the change occurred in the unattended feature dimension, regardless of the spatial focus of attention. In contrast, if they were given an object cue without specific information on the feature dimension most likely to change, reaction times were in between the previous distributions; i.e., they were slower compared with the previously attended feature dimension but faster compared with the previously unattended dimension. These data indicate that strongly attending to one feature dimension may go along with the suppression of processing in another dimension, preventing the spreading of attention to other, irrelevant features of the selected object, thereby increasing behavioral performance in response to the attended feature. Similar results on the suppression of nonattended object features have been obtained by several other research groups (Cant et al. 2008; Fanini et al. 2006; Freeman et al. 2014; Nobre et al. 2006; Polk et al. 2008; Serences et al. 2009; Taya et al. 2009; Xu 2010). As such, a possible reason for the different results on the task dependency of MT responses is that monkeys were more strongly focusing on the feature relevant for the current task block in our experiments.
Results cannot be explained by feature-similarity gain.
Our finding of a task-specific response facilitation when the attended motion direction was opposite to the stimulating, preferred motion direction within the RF indicates that feature-directed attention cannot fully be accounted for by FSG, which constitutes the current and most influential mechanistic explanation of FBA. This conflict does not arise from a general incompatibility with FSG (because FSG may coexist with the task-specific modulation we describe, cf. Gledhill et al. 2015) but because by concept FSG can hardly account for the response differences as found in our experiments. Specifically, because Gabors were moving in opposite directions, the dissimilarity between preferred motion direction inside the RF and attended motion direction outside the RF was maximal, providing a condition for which attentional facilitation based on similarity cannot apply. Under such circumstances, response rates of the recorded neurons are not expected to be enhanced, but rather suppressed (Martínez Trujillo and Treue 2004). Our findings, therefore, suggest an additional attention mechanism that does not depend on the specific tuning properties of the neurons, which may act in concert with FSG.
A possible concern regarding this interpretation of a tuning-independent modulation, however, arises from the following assumption: If it was possible to solely attend the speed but not the direction of the target Gabor, FSG might only facilitate the response of neurons tuned to the attended speed. If, in addition, this modulation would be stronger in the speed task than in the color task, and if a significant portion of our neurons would be tuned to the stimulus speed before the change, then the observed task-specific response differences could be interpreted within the FSG framework.
We argue, however, that this interpretation is unlikely and does not explain the discrepancy between previous findings on FSG and the results of the current study. First, this alternative interpretation still depends on a task-specific response difference. As explained earlier, the effect of FSG was found to not vary between tasks such that FSG is interpreted to address all those feature-specific neurons that process the attended object (Katzner et al. 2009). Thus, even if most of our neurons preferred the speed before the change, based on findings of Katzner et al. (2009) FSG would have the same effect in both tasks. This conclusion is not supported by our results. Second, the task-specific response difference affected neurons independently of their speed preferences. Although we had no detailed speed-tuning data available, large positive transients in response to an increase unambiguously indicate neurons for which the attended speed before the change is clearly away from their preferred speed. Restricting the analysis to these neurons with the least-matching tuning properties, based on either their preference to only speed or their combined preference to both speed and direction, still revealed significant response differences between tasks (Figs. 4 and 5). Third, task-dependent response differences were present in the absence of visual stimulation, and both of the subgroups with different tuning preferences showed a higher baseline activity during the speed change task (Fig. 6).
An additional, conceptual argument is that a selective facilitation of only those neurons well tuned to the speed before the change hardly supports change detection. In a speed-change task, neurons tuned to the attended speed are the poorest change detectors within the population of speed-tuned neurons (Traschütz et al. 2015). Because they respond to their preferred speed, any change in this speed, be it an acceleration or a deceleration, results in a reduction of their response. Because of the log-Gaussian-shaped speed-tuning curves of most MT neurons (Lagae et al. 1993; Nover et al. 2005), these transients have rather small amplitudes even for noticeable changes, which tend to average out in the population (Traschütz et al. 2015). In contrast, neurons for which the attended speed is on the rising or falling part of their tuning curve respond with significant FR changes even to small changes in speed, and preserve the sign of the speed change (acceleration or deceleration) over a large spectrum of speeds. Experimentally, we recently showed that the response of a population of neurons with heterogeneous speed tuning profiles (such as the population response we measured in the current study) is mainly carried by such neurons, having a preferred speed away from the stimulating speed (cf. Fig. 4 in Traschütz et al. 2015). Hence, suppressing the response of these neurons while facilitating the response of neurons with a preference to the attended speed hardly serves to improve change detection. We hypothesize that the same argument also applies for other principal stimulus features (e.g., motion direction), because a substantial part of the population transient following a feature change is carried by the fraction of neurons not well tuned to the feature preceding the change, due to the fact that the change occurs on the flank of their tuning curve (i.e., on its most sensitive part).
Mechanistic implications for feature-directed attention.
In our previous EEG experiment (Gledhill et al. 2015), we found that feature dimension-specific attentional effects emerged at frontal electrodes and then moved over to parieto-occipital electrode sites over visual cortex. In the present study, the first noticeable difference between the speed and the color task was a global shift in the baseline activity of MT neurons, before stimulus onset, suggesting an adjustment of the attentional set (Corbetta and Shulman 2002). In line with the EEG findings (Gledhill et al. 2015), a possible source for such task-related top-down modulations of visual cortical activity is the prefrontal cortex (PFC) (Miller and Cohen 2001). Neurons in monkey PFC have a different degree of motion and color sensitivity depending on the behavioral relevance of either feature, and color- and motion-selective neurons cluster in different parts of the PFC (Lauwereyns et al. 2001). Lesions to the lateral PFC impair shifting of the attentional set to another perceptual dimension (Dias et al. 1996). Therefore, a task-dependent increase in baseline activity may constitute an attention-related biasing signal from attentional control areas to specialized visual modules, as previously proposed (Chawla et al. 1999; Driver and Frith 2000).
Although baseline shifts are not sufficient on their own to induce attention-related response differences during the evoked response (Fannon et al. 2008) and do not predict the magnitude of attentional modulation (McMains et al. 2007), they often precede both spatial and feature-based attentional modulations in visual cortex (Chawla et al. 1999; Chelazzi et al. 1998; Kastner et al. 1999; Lee et al. 2007; Luck et al. 1997; Reynolds et al. 2000; Shulman et al. 1999). In line with this, we found that both the effects of task and spatial condition were not dependent on the baseline increase observed during the prestimulus epoch but had a significant magnitude after subtraction of spontaneous activity, even if done for each of the four behavioral conditions separately.
Taken together, the current data show that directing attention between motion and color of a stimulus causes (at least under the task and stimulus conditions of our experiment) a task-specific, dimension-based attentional modulation of neuronal activity. Unlike FSG, this modulation is affecting not only the neurons well tuned to the attended stimulus but all neurons in the cortical module sensitive to processing of the attended stimulus dimension. Future work on feature-directed attention is needed to properly understand the task conditions forcing tuning-dependent and/or tuning-independent response modulations in visual cortex, and whether and how the underlying mechanisms may coexist or even depend on each other.
GRANTS
This work was supported by Deutsche Forschungsgemeinschaft Grants KR 1844/1-2 and WE 5469/2-1, two Zentrale Forschungsförderung grants from the University of Bremen, and a scholarship from the German Academic Scholarship Foundation.
DISCLOSURES
No conflicts of interest, financial or otherwise, are declared by the authors.
AUTHOR CONTRIBUTIONS
D.W. and A.K.K. conceived and designed research; B.S., F.O.G., and M.P. performed experiments; B.S. and D.W. analyzed data; B.S. and D.W. interpreted results of experiments; B.S. and D.W. prepared figures; B.S. and D.W. drafted manuscript; B.S., F.O.G., M.P., A.K.K., and D.W. approved final version of the manuscript.
ACKNOWLEDGMENTS
We acknowledge support by Peter Bujotzek, Sunita Mandon, Deniz Parmuk, Ramazani Hakizimana, and Katrin Thoss regarding various aspects of the study.
Present address of M. Przybyla: School of Medical Sciences, University of New South Wales, Australia.
REFERENCES
- Akyürek EG, Dinkelbach A, Schubö A, Müller HJ. Electrophysiological correlates of detecting a visual target and detecting its absence: the role of feature dimensions. Neuropsychologia 48: 3365–3370, 2010. doi: 10.1016/j.neuropsychologia.2010.07.005. [DOI] [PubMed] [Google Scholar]
- Anllo-Vento L, Hillyard SA. Selective attention to the color and direction of moving stimuli: electrophysiological correlates of hierarchical feature selection. Percept Psychophys 58: 191–206, 1996. doi: 10.3758/BF03211875. [DOI] [PubMed] [Google Scholar]
- Arnold DH, Clifford CWG, Wenderoth P. Asynchronous processing in vision: color leads motion. Curr Biol 11: 596–600, 2001. doi: 10.1016/S0960-9822(01)00156-7. [DOI] [PubMed] [Google Scholar]
- Bisley JW. The neural basis of visual attention. J Physiol 589: 49–57, 2011. doi: 10.1113/jphysiol.2010.192666. [DOI] [PMC free article] [PubMed] [Google Scholar]
- Blaser E, Pylyshyn ZW, Holcombe AO. Tracking an object through feature space. Nature 408: 196–199, 2000. doi: 10.1038/35041567. [DOI] [PubMed] [Google Scholar]
- Brendel W, Romo R, Machens CK. Demixed principal component analysis. Adv Neural Inf Process Syst 24: 2654–2662, 2011. [Google Scholar]
- Cant JS, Large ME, McCall L, Goodale MA. Independent processing of form, colour, and texture in object perception. Perception 37: 57–78, 2008. doi: 10.1068/p5727. [DOI] [PubMed] [Google Scholar]
- Carrasco M. Visual attention: the past 25 years. Vision Res 51: 1484–1525, 2011. doi: 10.1016/j.visres.2011.04.012. [DOI] [PMC free article] [PubMed] [Google Scholar]
- Chawla D, Rees G, Friston KJ. The physiological basis of attentional modulation in extrastriate visual areas. Nat Neurosci 2: 671–676, 1999. doi: 10.1038/10230. [DOI] [PubMed] [Google Scholar]
- Chelazzi L, Duncan J, Miller EK, Desimone R. Responses of neurons in inferior temporal cortex during memory-guided visual search. J Neurophysiol 80: 2918–2940, 1998. [DOI] [PubMed] [Google Scholar]
- Chen X, Hoffmann KP, Albright TD, Thiele A. Effect of feature-selective attention on neuronal responses in macaque area MT. J Neurophysiol 107: 1530–1543, 2012. doi: 10.1152/jn.01042.2010. [DOI] [PMC free article] [PubMed] [Google Scholar]
- Chen Y, Martinez-Conde S, Macknik SL, Bereshpolova Y, Swadlow HA, Alonso JM. Task difficulty modulates the activity of specific neuronal populations in primary visual cortex. Nat Neurosci 11: 974–982, 2008. doi: 10.1038/nn.2147. [DOI] [PMC free article] [PubMed] [Google Scholar]
- Cohen MR, Maunsell JH. Attention improves performance primarily by reducing interneuronal correlations. Nat Neurosci 12: 1594–1600, 2009. doi: 10.1038/nn.2439. [DOI] [PMC free article] [PubMed] [Google Scholar]
- Cohen MR, Newsome WT. Context-dependent changes in functional circuitry in visual area MT. Neuron 60: 162–173, 2008. doi: 10.1016/j.neuron.2008.08.007. [DOI] [PMC free article] [PubMed] [Google Scholar]
- Corbetta M, Miezin FM, Dobmeyer S, Shulman GL, Petersen SE. Selective and divided attention during visual discriminations of shape, color, and speed: functional anatomy by positron emission tomography. J Neurosci 11: 2383–2402, 1991. [DOI] [PMC free article] [PubMed] [Google Scholar]
- Corbetta M, Shulman GL. Control of goal-directed and stimulus-driven attention in the brain. Nat Rev Neurosci 3: 201–215, 2002. doi: 10.1038/nrn755. [DOI] [PubMed] [Google Scholar]
- Corchs S, Deco G. Feature-based attention in human visual cortex: simulation of fMRI data. Neuroimage 21: 36–45, 2004. doi: 10.1016/j.neuroimage.2003.08.045. [DOI] [PubMed] [Google Scholar]
- Croner LJ, Albright TD. Segmentation by color influences responses of motion-sensitive neurons in the cortical middle temporal visual area. J Neurosci 19: 3935–3951, 1999. [DOI] [PMC free article] [PubMed] [Google Scholar]
- David SV, Hayden BY, Mazer JA, Gallant JL. Attention to stimulus features shifts spectral tuning of V4 neurons during natural vision. Neuron 59: 509–521, 2008. doi: 10.1016/j.neuron.2008.07.001. [DOI] [PMC free article] [PubMed] [Google Scholar]
- Desimone R, Ungerleider LG. Multiple visual areas in the caudal superior temporal sulcus of the macaque. J Comp Neurol 248: 164–189, 1986. doi: 10.1002/cne.902480203. [DOI] [PMC free article] [PubMed] [Google Scholar]
- Dias R, Robbins TW, Roberts AC. Dissociation in prefrontal cortex of affective and attentional shifts. Nature 380: 69–72, 1996. doi: 10.1038/380069a0. [DOI] [PubMed] [Google Scholar]
- DiCiccio TJ, Efron B. Bootstrap confidence intervals. Stat Sci 11: 189–228, 1996. doi: 10.1214/ss/1032280214. [DOI] [Google Scholar]
- Driver J, Frith C. Shifting baselines in attention research. Nat Rev Neurosci 1: 147–148, 2000. doi: 10.1038/35039083. [DOI] [PubMed] [Google Scholar]
- Duncan J. Selective attention and the organization of visual information. J Exp Psychol Gen 113: 501–517, 1984. doi: 10.1037/0096-3445.113.4.501. [DOI] [PubMed] [Google Scholar]
- Efron B, Tibshirani RJ. An Introduction to the Bootstrap. New York: Chapman and Hall, 1993. doi: 10.1007/978-1-4899-4541-9. [DOI] [Google Scholar]
- Ernst ZR, Boynton GM, Jazayeri M. The spread of attention across features of a surface. J Neurophysiol 110: 2426–2439, 2013. doi: 10.1152/jn.00828.2012. [DOI] [PMC free article] [PubMed] [Google Scholar]
- Fanini A, Nobre AC, Chelazzi L. Selecting and ignoring the component features of a visual object: a negative priming paradigm. Vis Cogn 14: 584–618, 2006. doi: 10.1080/13506280500195367. [DOI] [Google Scholar]
- Fannon SP, Saron CD, Mangun GR. Baseline shifts do not predict attentional modulation of target processing during feature-based visual attention. Front Hum Neurosci 1: 7, 2008. doi: 10.3389/neuro.09.007.2007. [DOI] [PMC free article] [PubMed] [Google Scholar]
- Found A, Müller HJ. Searching for unknown feature targets on more than one dimension: investigating a “dimension-weighting” account. Percept Psychophys 58: 88–101, 1996. doi: 10.3758/BF03205479. [DOI] [PubMed] [Google Scholar]
- Freeman ED, Macaluso E, Rees G, Driver J. fMRI correlates of object-based attentional facilitation versus suppression of irrelevant stimuli, dependent on global grouping and endogenous cueing. Front Integr Neurosci 8: 12, 2014. doi: 10.3389/fnint.2014.00012. [DOI] [PMC free article] [PubMed] [Google Scholar]
- Galashan FO, Rempel HC, Meyer A, Gruber-Dujardin E, Kreiter AK, Wegener D. A new type of recording chamber with an easy-to-exchange microdrive array for chronic recordings in macaque monkeys. J Neurophysiol 105: 3092–3105, 2011. doi: 10.1152/jn.00508.2010. [DOI] [PubMed] [Google Scholar]
- Galashan FO, Saßen HC, Kreiter AK, Wegener D. Monkey area MT latencies to speed changes depend on attention and correlate with behavioral reaction times. Neuron 78: 740–750, 2013. doi: 10.1016/j.neuron.2013.03.014. [DOI] [PubMed] [Google Scholar]
- Gledhill D, Grimsen C, Fahle M, Wegener D. Human feature-based attention consists of two distinct spatiotemporal processes. J Vis 15: 8, 2015. doi: 10.1167/15.8.8. [DOI] [PubMed] [Google Scholar]
- Grabska-Barwińska A, Ng BS, Jancke D. Orientation selective or not? Measuring significance of tuning to a circular parameter. J Neurosci Methods 203: 1–9, 2012. doi: 10.1016/j.jneumeth.2011.08.026. [DOI] [PubMed] [Google Scholar]
- Gramann K, Toellner T, Krummenacher J, Eimer M, Müller HJ. Brain electrical correlates of dimensional weighting: an ERP study. Psychophysiology 44: 277–292, 2007. doi: 10.1111/j.1469-8986.2007.00496.x. [DOI] [PubMed] [Google Scholar]
- Gramann K, Töllner T, Müller HJ. Dimension-based attention modulates early visual processing. Psychophysiology 47: 968–978, 2010. doi: 10.1111/j.1469-8986.2010.00998.x. [DOI] [PubMed] [Google Scholar]
- Herrington TM, Assad JA. Neural activity in the middle temporal area and lateral intraparietal area during endogenously cued shifts of attention. J Neurosci 29: 14160–14176, 2009. doi: 10.1523/JNEUROSCI.1916-09.2009. [DOI] [PMC free article] [PubMed] [Google Scholar]
- Huk AC, Heeger DJ. Task-related modulation of visual cortex. J Neurophysiol 83: 3525–3536, 2000. [DOI] [PubMed] [Google Scholar]
- Jack AI, Shulman GL, Snyder AZ, McAvoy M, Corbetta M. Separate modulations of human V1 associated with spatial attention and task structure. Neuron 51: 135–147, 2006. doi: 10.1016/j.neuron.2006.06.003. [DOI] [PubMed] [Google Scholar]
- Kastner S, Pinsk MA, De Weerd P, Desimone R, Ungerleider LG. Increased activity in human visual cortex during directed attention in the absence of visual stimulation. Neuron 22: 751–761, 1999. doi: 10.1016/S0896-6273(00)80734-5. [DOI] [PubMed] [Google Scholar]
- Katzner S, Busse L, Treue S. Attention to the color of a moving stimulus modulates motion-signal processing in macaque area MT: evidence for a unified attentional system. Front Syst Neurosci 3: 12, 2009. doi: 10.3389/neuro.06.012.2009. [DOI] [PMC free article] [PubMed] [Google Scholar]
- Khayat PS, Martinez-Trujillo JC. Effects of attention and distractor contrast on the responses of middle temporal area neurons to transient motion direction changes. Eur J Neurosci 41: 1603–1613, 2015. doi: 10.1111/ejn.12920. [DOI] [PubMed] [Google Scholar]
- Kobak D, Brendel W, Constantinidis C, Feierstein CE, Kepecs A, Mainen ZF, Qi X-L, Romo R, Uchida N, Machens CK. Demixed principal component analysis of neural population data. eLife 5: e10989, 2016. doi: 10.7554/eLife.10989. [DOI] [PMC free article] [PubMed] [Google Scholar]
- Lagae L, Raiguel S, Orban GA. Speed and direction selectivity of macaque middle temporal neurons. J Neurophysiol 69: 19–39, 1993. [DOI] [PubMed] [Google Scholar]
- Lauwereyns J, Sakagami M, Tsutsui K, Kobayashi S, Koizumi M, Hikosaka O. Responses to task-irrelevant visual features by primate prefrontal neurons. J Neurophysiol 86: 2001–2010, 2001. [DOI] [PubMed] [Google Scholar]
- Lee J, Williford T, Maunsell JH. Spatial attention and the latency of neuronal responses in macaque area V4. J Neurosci 27: 9632–9637, 2007. doi: 10.1523/JNEUROSCI.2734-07.2007. [DOI] [PMC free article] [PubMed] [Google Scholar]
- Linares D, López-Moliner J. Perceptual asynchrony between color and motion with a single direction change. J Vis 6: 974–981, 2006. doi: 10.1167/6.9.10. [DOI] [PubMed] [Google Scholar]
- Liu T, Larsson J, Carrasco M. Feature-based attention modulates orientation-selective responses in human visual cortex. Neuron 55: 313–323, 2007. doi: 10.1016/j.neuron.2007.06.030. [DOI] [PMC free article] [PubMed] [Google Scholar]
- Luck SJ, Chelazzi L, Hillyard SA, Desimone R. Neural mechanisms of spatial selective attention in areas V1, V2, and V4 of macaque visual cortex. J Neurophysiol 77: 24–42, 1997. [DOI] [PubMed] [Google Scholar]
- Martínez-Trujillo JC, Treue S. Feature-based attention increases the selectivity of population responses in primate visual cortex. Curr Biol 14: 744–751, 2004. doi: 10.1016/j.cub.2004.04.028. [DOI] [PubMed] [Google Scholar]
- Masse NY, Cook EP. The effect of middle temporal spike phase on sensory encoding and correlates with behavior during a motion-detection task. J Neurosci 28: 1343–1355, 2008. doi: 10.1523/JNEUROSCI.2775-07.2008. [DOI] [PMC free article] [PubMed] [Google Scholar]
- Maunsell JH, Treue S. Feature-based attention in visual cortex. Trends Neurosci 29: 317–322, 2006. doi: 10.1016/j.tins.2006.04.001. [DOI] [PubMed] [Google Scholar]
- Maunsell JH, Van Essen DC. Functional properties of neurons in middle temporal visual area of the macaque monkey. I. Selectivity for stimulus direction, speed, and orientation. J Neurophysiol 49: 1127–1147, 1983. [DOI] [PubMed] [Google Scholar]
- McAdams CJ, Maunsell JH. Attention to both space and feature modulates neuronal responses in macaque area V4. J Neurophysiol 83: 1751–1755, 2000. [DOI] [PubMed] [Google Scholar]
- McMains SA, Fehd HM, Emmanouil TA, Kastner S. Mechanisms of feature- and space-based attention: response modulation and baseline increases. J Neurophysiol 98: 2110–2121, 2007. doi: 10.1152/jn.00538.2007. [DOI] [PubMed] [Google Scholar]
- Mikami A, Newsome WT, Wurtz RH. Motion selectivity in macaque visual cortex. I. Mechanisms of direction and speed selectivity in extrastriate area MT. J Neurophysiol 55: 1308–1327, 1986. [DOI] [PubMed] [Google Scholar]
- Miller EK, Cohen JD. An integrative theory of prefrontal cortex function. Annu Rev Neurosci 24: 167–202, 2001. doi: 10.1146/annurev.neuro.24.1.167. [DOI] [PubMed] [Google Scholar]
- Moutoussis K, Zeki S.. Functional segregation and temporal hierarchy of the visual perceptive systems. Proc Biol Sci 264: 1407–1414, 1997. doi: 10.1098/rspb.1997.0196. [DOI] [PMC free article] [PubMed] [Google Scholar]
- Müller HJ, Heller D, Ziegler J. Visual search for singleton feature targets within and across feature dimensions. Percept Psychophys 57: 1–17, 1995. doi: 10.3758/BF03211845. [DOI] [PubMed] [Google Scholar]
- Nobre AC, Rao A, Chelazzi L. Selective attention to specific features within objects: behavioral and electrophysiological evidence. J Cogn Neurosci 18: 539–561, 2006. doi: 10.1162/jocn.2006.18.4.539. [DOI] [PubMed] [Google Scholar]
- Nover H, Anderson CH, DeAngelis GC. A logarithmic, scale-invariant representation of speed in macaque middle temporal area accounts for speed discrimination performance. J Neurosci 25: 10049–10060, 2005. doi: 10.1523/JNEUROSCI.1661-05.2005. [DOI] [PMC free article] [PubMed] [Google Scholar]
- O’Craven KM, Downing PE, Kanwisher N. fMRI evidence for objects as the units of attentional selection. Nature 401: 584–587, 1999. doi: 10.1038/44134. [DOI] [PubMed] [Google Scholar]
- Polk TA, Drake RM, Jonides JJ, Smith MR, Smith EE. Attention enhances the neural processing of relevant features and suppresses the processing of irrelevant features in humans: a functional magnetic resonance imaging study of the Stroop task. J Neurosci 28: 13786–13792, 2008. doi: 10.1523/JNEUROSCI.1026-08.2008. [DOI] [PMC free article] [PubMed] [Google Scholar]
- Pollmann S, Weidner R, Müller HJ, Maertens M, von Cramon DY. Selective and interactive neural correlates of visual dimension changes and response changes. Neuroimage 30: 254–265, 2006. doi: 10.1016/j.neuroimage.2005.09.013. [DOI] [PubMed] [Google Scholar]
- Pollmann S, Weidner R, Müller HJ, von Cramon DY. A fronto-posterior network involved in visual dimension changes. J Cogn Neurosci 12: 480–494, 2000. doi: 10.1162/089892900562156. [DOI] [PubMed] [Google Scholar]
- Price NS, Born RT. Timescales of sensory- and decision-related activity in the middle temporal and medial superior temporal areas. J Neurosci 30: 14036–14045, 2010. doi: 10.1523/JNEUROSCI.2336-10.2010. [DOI] [PMC free article] [PubMed] [Google Scholar]
- Price NS, Born RT. Adaptation to speed in macaque middle temporal and medial superior temporal areas. J Neurosci 33: 4359–4368, 2013. doi: 10.1523/JNEUROSCI.3165-12.2013. [DOI] [PMC free article] [PubMed] [Google Scholar]
- Quiroga RQ, Nadasdy Z, Ben-Shaul Y. Unsupervised spike detection and sorting with wavelets and superparamagnetic clustering. Neural Comput 16: 1661–1687, 2004. doi: 10.1162/089976604774201631. [DOI] [PubMed] [Google Scholar]
- Reynolds JH, Pasternak T, Desimone R. Attention increases sensitivity of V4 neurons. Neuron 26: 703–714, 2000. doi: 10.1016/S0896-6273(00)81206-4. [DOI] [PubMed] [Google Scholar]
- Rodríguez V, Valdés-Sosa M, Freiwald W. Dividing attention between form and motion during transparent surface perception. Brain Res Cogn Brain Res 13: 187–193, 2002. doi: 10.1016/S0926-6410(01)00111-2. [DOI] [PubMed] [Google Scholar]
- Saenz M, Buracas GT, Boynton GM. Global effects of feature-based attention in human visual cortex. Nat Neurosci 5: 631–632, 2002. doi: 10.1038/nn876. [DOI] [PubMed] [Google Scholar]
- Schoenfeld MA, Tempelmann C, Martinez A, Hopf JM, Sattler C, Heinze HJ, Hillyard SA. Dynamics of feature binding during object-selective attention. Proc Natl Acad Sci USA 100: 11806–11811, 2003. doi: 10.1073/pnas.1932820100. [DOI] [PMC free article] [PubMed] [Google Scholar]
- Serences JT, Ester EF, Vogel EK, Awh E. Stimulus-specific delay activity in human primary visual cortex. Psychol Sci 20: 207–214, 2009. doi: 10.1111/j.1467-9280.2009.02276.x. [DOI] [PMC free article] [PubMed] [Google Scholar]
- Shulman GL, Ollinger JM, Akbudak E, Conturo TE, Snyder AZ, Petersen SE, Corbetta M. Areas involved in encoding and applying directional expectations to moving objects. J Neurosci 19: 9480–9496, 1999. [DOI] [PMC free article] [PubMed] [Google Scholar]
- Smith MA, Kohn A. Spatial and temporal scales of neuronal correlation in primary visual cortex. J Neurosci 28: 12591–12603, 2008. doi: 10.1523/JNEUROSCI.2929-08.2008. [DOI] [PMC free article] [PubMed] [Google Scholar]
- Störmer VS, Alvarez GA. Feature-based attention elicits surround suppression in feature space. Curr Biol 24: 1985–1988, 2014. doi: 10.1016/j.cub.2014.07.030. [DOI] [PubMed] [Google Scholar]
- Sundberg KA, Mitchell JF, Gawne TJ, Reynolds JH. Attention influences single unit and local field potential response latencies in visual cortical area V4. J Neurosci 32: 16040–16050, 2012. doi: 10.1523/JNEUROSCI.0489-12.2012. [DOI] [PMC free article] [PubMed] [Google Scholar]
- Taya S, Adams WJ, Graf EW, Lavie N. The fate of task-irrelevant visual motion: perceptual load versus feature-based attention. J Vis 9: 12.1–12.10, 2009. doi: 10.1167/9.12.12. [DOI] [PubMed] [Google Scholar]
- Thiele A, Dobkins KR, Albright TD. The contribution of color to motion processing in Macaque middle temporal area. J Neurosci 19: 6571–6587, 1999. [DOI] [PMC free article] [PubMed] [Google Scholar]
- Töllner T, Gramann K, Müller HJ, Kiss M, Eimer M. Electrophysiological markers of visual dimension changes and response changes. J Exp Psychol Hum Percept Perform 34: 531–542, 2008. doi: 10.1037/0096-1523.34.3.531. [DOI] [PMC free article] [PubMed] [Google Scholar]
- Töllner T, Zehetleitner M, Gramann K, Müller HJ. Top-down weighting of visual dimensions: behavioral and electrophysiological evidence. Vision Res 50: 1372–1381, 2010. doi: 10.1016/j.visres.2009.11.009. [DOI] [PubMed] [Google Scholar]
- Torriente I, Valdes-Sosa M, Ramirez D, Bobes MA. Visual evoked potentials related to motion-onset are modulated by attention. Vision Res 39: 4122–4139, 1999. doi: 10.1016/S0042-6989(99)00113-3. [DOI] [PubMed] [Google Scholar]
- Traschütz A, Kreiter AK, Wegener D. Transient activity in monkey area MT represents speed changes and is correlated with human behavioral performance. J Neurophysiol 113: 890–903, 2015. doi: 10.1152/jn.00335.2014. [DOI] [PubMed] [Google Scholar]
- Treue S, Martínez Trujillo JC. Feature-based attention influences motion processing gain in macaque visual cortex. Nature 399: 575–579, 1999. doi: 10.1038/21176. [DOI] [PubMed] [Google Scholar]
- Wagatsuma N, Potjans TC, Diesmann M, Sakai K, Fukai T. Spatial and feature-based attention in a layered cortical microcircuit model. PLoS One 8: e80788, 2013. doi: 10.1371/journal.pone.0080788. [DOI] [PMC free article] [PubMed] [Google Scholar]
- Wannig A, Rodríguez V, Freiwald WA. Attention to surfaces modulates motion processing in extrastriate area MT. Neuron 54: 639–651, 2007. doi: 10.1016/j.neuron.2007.05.001. [DOI] [PubMed] [Google Scholar]
- Wegener D, Ehn F, Aurich MK, Galashan FO, Kreiter AK. Feature-based attention and the suppression of non-relevant object features. Vision Res 48: 2696–2707, 2008. doi: 10.1016/j.visres.2008.08.021. [DOI] [PubMed] [Google Scholar]
- Wegener D, Freiwald WA, Kreiter AK. The influence of sustained selective attention on stimulus selectivity in macaque visual area MT. J Neurosci 24: 6106–6114, 2004. doi: 10.1523/JNEUROSCI.1459-04.2004. [DOI] [PMC free article] [PubMed] [Google Scholar]
- Wegener D, Galashan FO, Aurich MK, Kreiter AK. Attentional spreading to task-irrelevant object features: experimental support and a 3-step model of attention for object-based selection and feature-based processing modulation. Front Hum Neurosci 8: 414, 2014. doi: 10.3389/fnhum.2014.00414. [DOI] [PMC free article] [PubMed] [Google Scholar]
- Weidner R, Pollmann S, Müller HJ, von Cramon DY. Top-down controlled visual dimension weighting: an event-related fMRI study. Cereb Cortex 12: 318–328, 2002. doi: 10.1093/cercor/12.3.318. [DOI] [PubMed] [Google Scholar]
- Xu Y. The neural fate of task-irrelevant features in object-based processing. J Neurosci 30: 14020–14028, 2010. doi: 10.1523/JNEUROSCI.3011-10.2010. [DOI] [PMC free article] [PubMed] [Google Scholar]