Abstract
MYC activation at modest levels has been frequently found in hepatocellular carcinoma. However, its significance in hepatocarcinogenesis has remained obscure. Here we examined the role of Myc activation in mouse liver tumours induced by hepatocytic expression of myristoylated AKT (AKT) and/or mutant HRASV12 (HRAS) via transposon-mediated gene integration. AKT or HRAS alone required 5 months to induce liver tumours, whereas their combination generated hepatocellular carcinoma within 8 weeks. Co-introduction of AKT and HRAS induced lipid-laden preneoplastic cells that grew into nodules composed of tumour cells with or without intracytoplasmic lipid, with the latter being more proliferative and associated with spontaneous Myc expression. AKT/HRAS-induced tumorigenesis was almost completely abolished when MadMyc, a competitive Myc inhibitor, was expressed simultaneously. The Tet-On induction of MadMyc in preneoplastic cells significantly inhibited the progression of AKT/HRAS-induced tumours; its induction in transformed cells suppressed their proliferative activity with alterations in lipid metabolism and protein translation. Transposon-mediated Myc overexpression facilitated tumorigenesis by AKT or HRAS, and when it was co-introduced with AKT and HRAS, diffusely infiltrating tumours without lipid accumulation developed as early as 2 weeks. Examination of the dose-responses of Myc in the enhancement of AKT/HRAS-induced tumorigenesis revealed that a reduction to one-third retained enhancing effect but three-times greater introduction damped the process with increased apoptosis. Myc overexpression suppressed the mRNA expression of proteins involved in the synthesis of fatty acids, and when combined with HRAS introduction, it also suppressed the mRNA expression of proteins involved in their degradation. Finally, the MYC-positive human hepatocellular carcinoma was characterized by the cytoplasm devoid of lipid accumulation, prominent nucleoli and a higher proliferative activity. Our results demonstrate that in hepatocarcinogenesis induced by both activated AKT and HRAS, activation of endogenous Myc is an enhancing factor and adequate levels of Myc deregulation further facilitate the process with alterations in cellular metabolism.
Introduction
As a prototypic oncogene, MYC actively participates in the development of various human cancers, including hepatocellular carcinoma (HCC).1, 2 Although a significant copy number gain of 8q24 containing MYC has been reported to be positive in a relatively small fraction (4–24%) of HCC cases,3 modest multiplication (two to sixfold) has been found in up to 44% of cases.4 MYC gene expression is known to be increased due to hypomethylation of its promoter early in hepatocarcinogenesis.5 Furthermore, the MYC (or a mouse orthologue Myc) gene product, MYC (or mouse Myc), could be posttranslationally modified and its stability is increased through its cooperation with activated PI3K and RAS-mitogen activated protein kinase (MAPK) pathways.6
MYC has been shown to contribute to cell proliferation and tumorigenesis in various ways.7 It directly affects the cell cycle machinery by increasing the expression of E2F, as well as cyclin D and cyclin-dependent kinase (CDK) 4, which then activates cyclin E and CDK2 via sequestration of p27.8 MYC is involved in transcriptional elongation of many genes with E-boxes in their promoter.1 MYC also affects posttranscriptional gene expression mechanisms via positive feedback activation of an eukaryotic translation initiation factor (eIF4E)9 and ribosome biogenesis by regulating RNA polymerases I, II and III.10 Furthermore, prior to G1-S transition, MYC induces metabolic reprogramming, involving glycolysis and glutaminolysis, which is necessary for efficient cell proliferation.1, 2 Using liver-specific transgenic mouse systems with the albumin enhancer/promoter, deregulated MYC expression has been demonstrated to induce liver tumours, with synergistic interactions with mutant Hras11 or overexpression of E2F1 or transforming growth factor-α.12 However, there has been a new confounding report showing that liver-specific overexpression of MYC does not promote hepatocarcinogenesis triggered by conditional expression of mutant Hras.13 Thus, at present, the precise roles of deregulated Myc expression in hepatocarcinogenesis have not yet been clarified.
By combining the Sleeping Beauty (SB) transposon system14 and hydrodynamic tail vein injection (HTVi),15 long-term in vivo expression of exogenous genes in mouse hepatocytes is possible,16 and the introduction of various oncogenes has generated liver cancers.17 Recently, the transposon-mediated gene integration of both activated (myristoylated) AKT (myrAKT) and mutant NRAS (NRASV12) has been shown to induce multiple HCC in as little as 1 month,18 contrasting with the time course of tumorigenesis induced by myrAKT alone, which usually takes several months.19 Interestingly, a spontaneous increase of Myc has been demonstrated during the tumorigenic process.18 Although it has been shown that MYC induces liver tumours with the appearance of cancer stem-like chemoresistant cells,20 the interaction of MYC with other oncogenic pathways has not been examined.
In this study, we explored the effects of spontaneous expression and forced overexpression of Myc on tumorigenesis by transposon-mediated activation of phosphatidylinositol 3-kinase (PI3K) and/or RAS-MAPK pathways. Our results show that both activation of endogenous Myc and deregulated Myc expression significantly contribute to hepatocarcinogenesis.
Results
Introduction of activated AKT or mutant HRAS into hepatocytes induces hepatocellular carcinoma after long periods of incubation
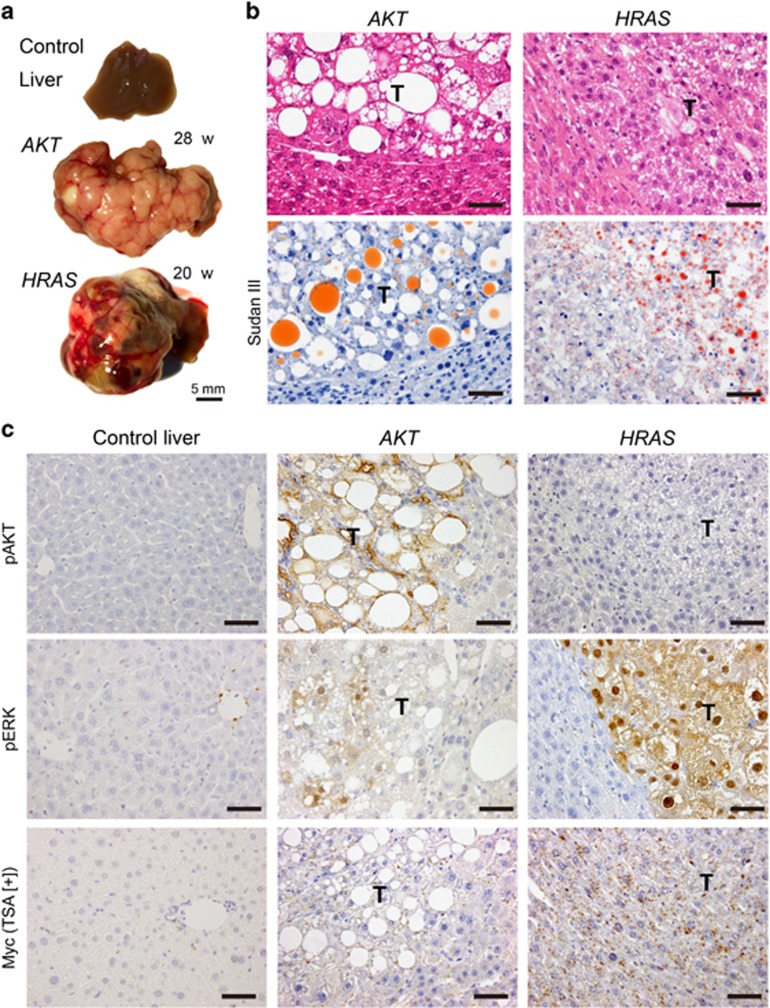
Hydrodynamic tail vein injection (HTVi)-mediated introduction of either myrAKT (AKT henceforward) or mutant HRAS (HRAS henceforward) alone induced multiple tumours after 20–28 weeks (Figure 1a). Kang et al21 reported that similar introduction of mutant NRAS (NRASG12V) did not induce liver tumours due to oncogene-induced senescence with immune response. However, in our experiments using mutant HRAS, even at 5 weeks after HTVi, numerous transduced hepatocytes were present and invoked only focal and limited immune reaction (Supplementary Figure 1a). Furthermore, these transduced hepatocytes and subsequent tumour cells did not express senescence markers (p16 and p21) (Supplementary Figures 1b, c). Although the reasons for this discrepancy are unclear, it might reflect functional differences between these RAS isoforms.22, 23
Figure 1.
Introduction of AKT or HRAS into mouse hepatocytes induces liver tumours after long periods of incubation. The pathological features of the liver tumours induced by activated myrAKT (AKT) or HRASV12 (HRAS) (incubation periods: AKT-induced tumours, 28 weeks; HRAS-induced tumours, 20 weeks). (a) Gross appearances of the livers. (b) Hematoxylin and eosin (H&E) and Sudan III stainings of the liver. The tumours show features of HCC associated with lipid accumulation. T, tumours. Scale bar, 50 μm. (c) Immunohistochemistry for phosphorylated AKT (pAKT), phosphorylated ERK1/2 (pERK1/2) and Myc (with TSA). T, tumours. Scale bar, 50 μm.
The tumours induced by either oncogenes showed histological features of HCC (Figure 1b). However, AKT-induced tumours demonstrated more marked lipid accumulation than HRAS-induced tumours, which was confirmed to be triglyceride by Sudan III staining (Figure 1b). Immunohistochemical studies revealed the highly phosphorylated status of AKT in AKT-induced tumours but not in HRAS-induced tumours (Figure 1c). In contrast, the presence of highly phosphorylated ERK in the nucleus and cytoplasm was demonstrated in HRAS-induced tumours, whereas there was weak and heterogeneous phosphorylation of ERK in AKT-induced tumours (Figure 1c). Myc immunohistochemistry with tyramide signal amplification (TSA) did not detect Myc activation in either tumours (Figure 1c).
Activation of both AKT and HRAS facilitates hepatocarcinogenesis with decreased lipid accumulation and Myc activation
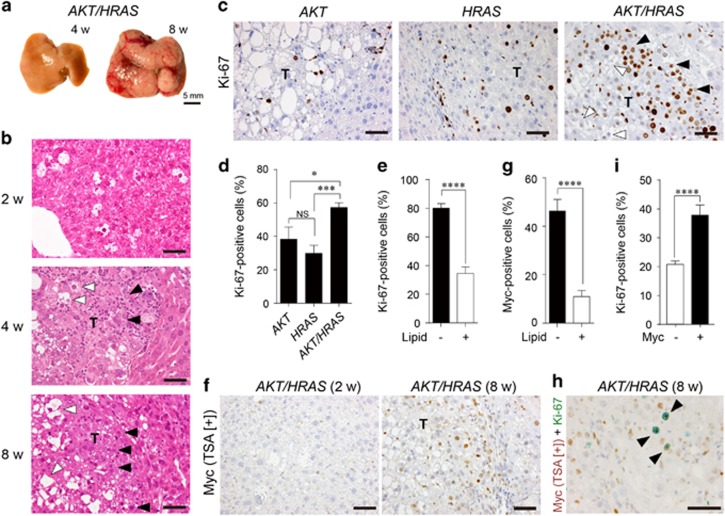
Following the concomitant introduction of AKT and HRAS, multiple large tumours appeared as early as 8 weeks (Figure 2a). Microscopically, preneoplastic hepatocytes with lipid accumulation were readily detected after 2 weeks and they grew into HCC composed of tumour cells with or without intracytoplasmic lipid accumulation (Figure 2b). Ki-67 immunohistochemistry revealed that the tumours induced by AKT and HRAS (AKT/HRAS) were more proliferative than those induced by AKT or HRAS alone (Figures 2c and d). In the AKT/HRAS-induced tumours, tumour cells without discernible lipid accumulation showed higher proliferative activity than those with abundant lipid (Figure 2e). Although the preneoplastic cells observed after 2 weeks of injection were negative for Myc, some tumour cells observed after 8 weeks showed weak nuclear Myc expression (Figure 2f). Myc-positive tumour cells were more frequently found in cells without lipid accumulation (Figure 2g). Double immunohistochemistry confirmed that Myc-positive tumour cells were more frequently positive for Ki-67 (Figures 2h and i). The expression of Myc was not accompanied with an increase of its mRNA (Supplementary Figure 3).
Figure 2.
Co-introduction of AKT and HRAS into mouse hepatocytes rapidly induces liver tumours with spontaneous Myc expression. (a) Gross appearances of the livers. Note the white discolouration and multiple large tumours 4 and 8 weeks after introduction of both AKT and HRAS. (b) H&E staining of the liver. Preneoplastic hepatocytes containing abundant intracytoplasmic lipid found after 2 weeks develop into microscopic (4 weeks) and macroscopic (8 weeks) tumours with typical histology of HCC. The tumours consist of cells with (white arrowheads) and without (black arrowheads) lipid accumulation. (c) Immunohistochemistry for Ki-67 comparing AKT-, HRAS- and AKT/HRAS-induced tumours. The cells in AKT/HRAS-induced tumors, particularly those without lipid accumulation, show higher levels of Ki-67 labelling. (d) Quantitative analysis of Ki-67-labelled tumour cells in AKT-, HRAS- and AKT/HRAS-induced tumours (n=10, 12 and 14, respectively). (e) Quantitative analysis of Ki-67-labelling in tumour cells with or without intracytoplasmic lipid accumulation in AKT/HRAS-induced tumours. (f) Myc immunohistochemistry with TSA of AKT/HRAS-induced tumours. Some of the tumour cells without intracytoplasmic lipid accumulation show nuclear Myc expression. (g) Quantitative analysis of Myc protein expression in tumour cells with or without intracytoplasmic lipid accumulation in AKT/HRAS-induced tumours. (h) Myc/Ki-67 double immunohistochemistry of AKT/HRAS-induced tumours. Note the many tumour cells positive for both Myc (brown) and Ki-67 (green) (black arrowheads). (i) Quantitative analysis of Ki-67-labelling in tumour cells with or without Myc expression in AKT/HRAS-induced tumours. T: tumours. Scale bar, 50 μm. Statistical analyses: Kruskal−Wallis test (d), Mann−Whitney U-test (e, g, i). NS, not significant. *P<0.05, ***P<0.001, ****P<0.0001.
Myc inhibition by MadMyc suppressed hepatocarcinogenesis induced by concomitant introduction of AKT and HRAS
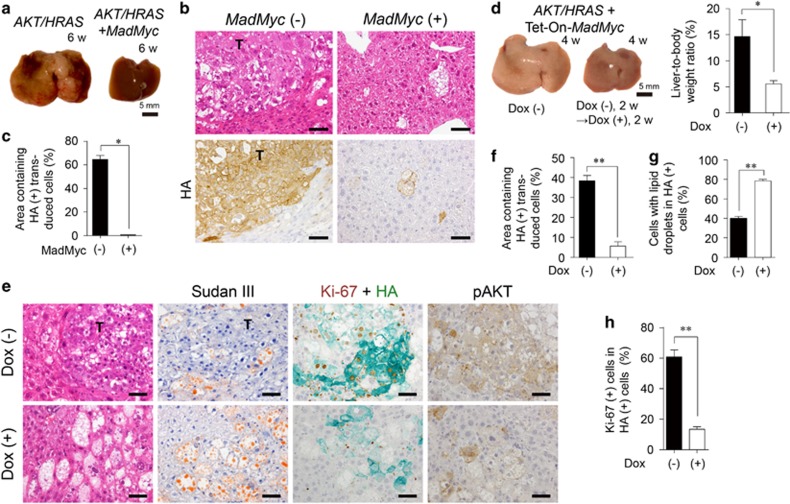
To examine the significance of the activation of endogenous Myc in AKT/HRAS-induced tumours, we concomitantly introduced MadMyc, which inhibits Myc activity in a dominant-negative manner.24, 25 MadMyc introduction almost completely abolished AKT/HRAS-induced tumorigenesis (Figure 3a). There were only scattered swollen hepatocytes with lipid accumulation in the liver in which MadMyc was introduced (Figure 3b). All the AKT/HRAS-induced tumour cells, as well as the swollen hepatocytes in the AKT/HRAS/MadMyc-treated liver, were positive for HA, which was tagged to both AKT and MadMyc, indicating that they were transduced cells (Figure 3b). Quantitative analysis of HA-positive area demonstrated that MadMyc dramatically inhibited AKT/HRAS-induced hepatocarcinogenesis (Figure 3c).
Figure 3.
Competitive inhibition of Myc impairs AKT/HRAS-induced tumorigenesis. (a) Gross appearances of the livers 6 weeks after introduction of AKT/HRAS with or without MadMyc. (b) H&E staining and immunohistochemistry for HA of the liver. (c) Quantitative analyses of the area containing HA-positive transduced cells (n=3 for AKT/HRAS group, n=6 for AKT/HRAS/MadMyc group). A total area of approximately 12 mm2 was analysed in each animal. (d) Gross appearances of the livers and liver-to-body weight ratios 4 weeks after the introduction of AKT/HRAS/Tet-On-MadMyc. In the Dox (+) group, at 2 weeks after plasmid injection, Dox was administered during a period of 2 weeks to induce MadMyc (n=6 for each group). (e) H&E and Sudan III stainings, double immunohistochemistry for Ki-67 (brown) and HA (green), and immunohistochemistry for phosphorylated AKT (pAKT) of the livers. (f) Quantitative analysis of percentages of area containing HA-positive transduced cells. A total area of 2.32 mm2 was analysed in each animal. (g, h) HA-positive cells with lipid droplets (g), and double positive cells for Ki-67 and HA (h) in the Dox (−) and Dox (+) groups (n=6 and 4, respectively). Approximately 500 HA-positive cells were analysed in each animal (g, h). T, tumours. Scale bar, 50 μm. Statistical analyses: unpaired t-test (d and f), Mann−Whitney U-test (c, g, h). *P<0.05, **P<0.01.
Next we examined the effect of MadMyc on progression of AKT/HRAS-induced preneoplastic hepatocytes. MadMyc was induced by doxycycline (Dox) using the Tet-On system 2 weeks following the introduction of the plasmids, when only preneoplastic hepatocytes were present. The induction of MadMyc significantly suppressed the enlargement of the liver at 4 weeks (Figure 3d, Supplementary Figure 2a). Microscopically, in contrast to multiple coalescent tumour nodules in the Dox (−) control, there were scattered large cells with lipid accumulation in the livers of Dox-treated mice (Figure 3e). These cells were positive for both HA and phosphorylated AKT, although the staining intensity of the lipid-rich cells were relatively low (Figure 3e). Dox treatment greatly reduced the area containing HA-positive transduced cells (Figure 3f). HA-positive cells in Dox-treated animals tended to be more abundant in cytoplasmic lipid (Figure 3g) and less proliferative (Figures 3e and h) as compared with those in the Dox (−) control. No significant apoptotic cell death was induced by Dox treatment (Supplementary Figure 4). In another set of experiments, whereas most of the Dox (−) control mice were dead or severely ill due to massive liver tumours within 7 weeks, all of Dox-treated mice survived and appeared well (Supplementary Figures 5a, b). The tumours in Dox-treated mice were smaller in number and size and mainly composed of cells with marked lipid accumulation (Supplementary Figure 5c).
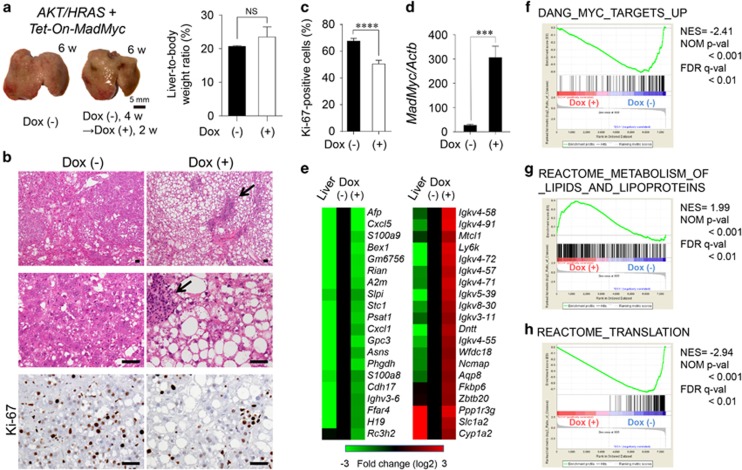
We also explored whether MadMyc suppressed the proliferation of neoplastic hepatocytes by the induction of MadMyc 4 weeks after the introduction of AKT and HRAS, when incipient tumour nodules emerged. Although Dox treatment for 2 weeks did not affect the liver weight (Figure 4a, Supplementary Figure 3b), it induced lipid accumulation in tumour cells (Figure 4b). This was associated with the suppression of proliferative activity (Figures 4b and c). The induction of MadMyc mRNA by Dox treatment was confirmed by reverse transcriptase-polymerase chain reaction (RT-qPCR) analysis of the tumour tissues (Figure 4d). A cDNA microarray analysis was performed to compare gene expression profiles of tumours obtained from mice with or without Dox treatment. Partial lists of differentially expressed genes are shown in Figure 4e (including the data of the control liver) and Supplementary Table S2. Interestingly, Dox treatment reduced the mRNA expression of Afp, Slpi, Gpc3 and H19, which are expressed in the fetal/neonatal liver and activated in CCl4− or diethylnitrosamine-induced liver tumours.26 The induction of MadMyc suppressed the mRNA expression of S100a9 and S100a8, which encodes calprotectin,27 a heterodimeric protumorigenic protein, as well as that of Psat1 and Phgdh whose products are involved in serine biosynthesis. The detection of transcripts of the genes for immunoglobulin and immune functions in the tumours was attributable to inflammatory cell infiltrates frequently found in the tumours with induced MadMyc (Figure 4b). Ppp1r3g, Slc1a2 and Cyp1a2 were identified as the genes that were suppressed in AKT/HRAS-induced tumours, but partially recovered by MadMyc induction. Gene Set Enrichment Analysis (GSEA) revealed that the expression dataset of the tumours was significantly enriched with the genes enumerated in the gene sets listed in the Myc Target Gene Database (Figure 4f, Supplementary Tables S3a and S4). Furthermore, the expression dataset was closely associated with the ‘lipid metabolism’ (Figure 4g, Supplementary Tables S3b, S3c and S5) and ‘translation’ (Figure 4h, Supplementary Tables S3b, S3c and S6) gene sets.
Figure 4.
Competitive inhibition of Myc inhibits the proliferative activity of AKT/HRAS-induced tumours. (a) Gross appearances of the livers and liver-to-body weight ratios 6 weeks after the introduction of AKT/HRAS/Tet-On-MadMyc. In the Dox (+) group, at 4 weeks after plasmid injection, Dox was administered during a period of 2 weeks to induce MadMyc (n=5 for Dox [−] group, n=3 for Dox [+] group). (b) H&E staining and immunohistochemistry for Ki-67 of the liver. Intracytoplasmic lipid accumulation is more prominent in tumour cells in the Dox (+) group. There are scattered foci of lymphoplasmacytic infiltration in the stroma (arrows). (c) Quantitative analysis of Ki-67-labelling in tumour cells (10 tumour nodules were examined in each group). (d) RT-qPCR analysis of MadMyc mRNA expression in tumours (n=5 for Dox [−] group, n=8 for Dox [+] group). (e) cDNA microarray analysis of control liver and tumours in the Dox (−) and Dox (+) groups. (e−h) GSEA results showing significant correlations of the expression dataset of the tumours with a ‘Myc target’ gene set (f), a ‘lipid metabolism’ gene set (g), and a ‘translation’ gene set (h). For the Reactome gene sets and GO gene sets, those with subset size less than 100 were excluded. From 10 837 probe sets with gene expression value greater than 25, 7348 known genes were selected by the symbol identifier and used as the expression dataset. Scale bar, 50 μm. Statistical analyses: unpaired t-test (a, c and d). NS, not significant. ***P<0.001, ****P<0.0001.
Overexpression of Myc enhances AKT- and/or HRAS-mediated hepatocarcinogenesis with suppression of lipid accumulation in tumour cells
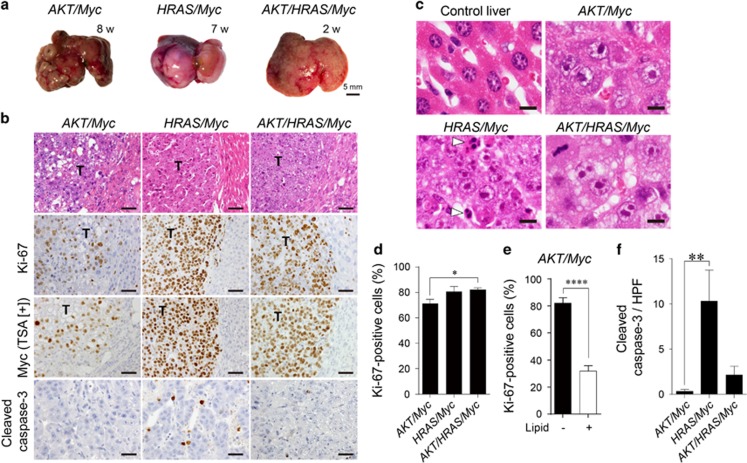
We then co-introduced Myc in combination with AKT (AKT/Myc), HRAS (HRAS/Myc), and AKT and HRAS (AKT/HRAS/Myc). Although injection of the Myc-expressing plasmid alone did not produce any tumours during the period of one year (data not shown), the co-introduction of Myc markedly enhanced tumorigenesis induced by AKT or HRAS, generating multiple liver tumours within 7–8 weeks (Figure 5a). The combination of these three oncogenes (AKT/HRAS/Myc) induced numerous small liver tumours, which replaced whole livers as early as 2 weeks (Figure 5a). Increased levels of Myc mRNA in these tumours were confirmed by RT-qPCR analysis (Supplementary Figure 2). All these tumours showed the histology of HCC with prominent nucleoli (Figures 5b and c). AKT/HRAS/Myc-induced tumours were the least differentiated and diffusely infiltrative. Although some cells in AKT/Myc-induced tumours showed marked lipid accumulation, HRAS/Myc- and AKT/HRAS/Myc-induced tumour cells were almost devoid of lipid (Figure 5b). The tumour cells showed highly proliferative activities, with Ki-67-labelling indices of 71.3, 80.7 and 82.2% in AKT/Myc-, HRAS/Myc- and AKT/HRAS/Myc-induced tumours, respectively (Figure 5d). In contrast to the heterogeneous expression levels of Myc in AKT/Myc-induced tumours, HRAS/Myc- and AKT/HRAS/Myc-induced tumour cells demonstrated strong and homogeneous Myc expression (Figure 5b). In AKT/Myc-induced tumours, cells without lipid accumulation showed higher proliferative activity than those with abundant intracytoplasmic lipid (Figure 5e). HRAS/Myc-induced tumours contained many apoptotic cells that were highlighted by cleaved caspase-3 immunohistochemistry (Figures 5b, c and f).
Figure 5.
Overexpression of Myc enhances AKT- and/or HRAS-mediated hepatocarcinogenesis with suppression of lipid accumulation in tumour cells. (a) Gross appearances of the livers after introduction of AKT/Myc, HRAS/Myc and AKT/HRAS/Myc. Although multiple liver tumours were generated after 7–8 weeks when AKT/Myc or HRAS/Myc was introduced, the combination of three oncogenes (AKT/HRAS/Myc) induced diffuse liver tumours as early as 2 weeks. (b) H&E staining and immunohistochemistry for Ki-67, Myc (with TSA), and cleaved caspase-3 of the livers 8, 7 and 2 weeks after the introduction of AKT/Myc, HRAS/Myc and AKT/HRAS/Myc, respectively. T: tumours. Scale bar, 50 μm. (c) H&E staining of the normal liver and tumours with Myc overexpression (higher magnification). White arrowheads indicate apoptotic cells in HRAS/Myc-induced tumours. Scale bar, 20 μm. (d) Comparison of cell proliferative activities (percentages of Ki-67-positive cells) among AKT/Myc-, HRAS/Myc- and AKT/HRAS/Myc-induced liver tumours (n=9, 11 and 15, respectively). (e) Relationship between the proliferative activity and lipid accumulation in AKT/Myc-induced tumours. (f) Quantitative analysis of the number of cleaved caspase 3-positive tumour cells per high power field. Statistical analyses: Kruskal−Wallis test (d, f), unpaired t-test (e). *P<0.05, **P<0.01, ****P<0.0001.
Adequate levels of Myc activation are required for the promotion of AKT/HRAS-induced hepatocarcinogenesis
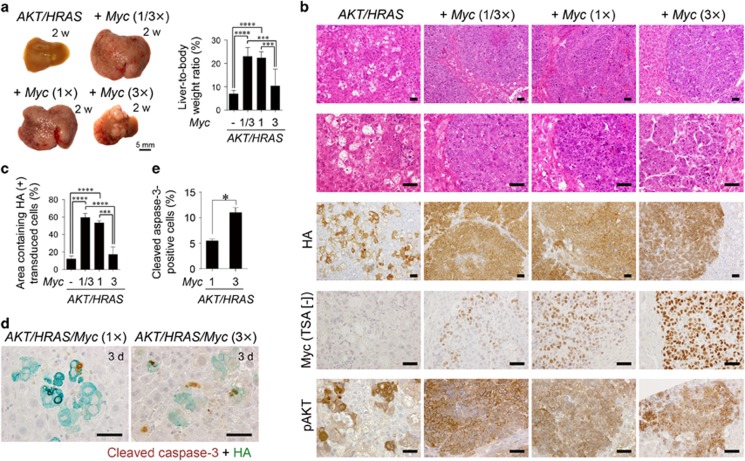
We further explored the dose-response relationship between the levels of Myc activation and its carcinogenic effect. In the AKT/HRAS/Myc-induced hepatocarcinogenesis model, the amount of introduced Myc-expressing plasmid was decreased to one-third (1/3 ×) or increased three times (3 ×) and compared the extent of tumour formation with the original (1 ×). Myc immunohistochemistry without TSA demonstrated that the introduction of more (3 ×) Myc increased Myc expression in the individual transduced hepatocytes at 3 days after the introduction of the plasmids (Supplementary Figures 6a, b), although the total number of the HA-positive transduced cells was comparable to that seen in the mice in which 1 × or 1/3 × Myc was introduced (Supplementary Figures 6a, c). Interestingly, the introduction of 3 × Myc inhibited its tumour-promoting effect, whereas the effect was not affected by the decreased dosage (1/3 ×) of Myc (Figure 6a), which was clearly exemplified by changes in relative liver weight (Figure 6a, Supplementary Figure 2c). Although HA-positive transduced cells formed coalescent tumours of poorly differentiated HCC when 1 × or 1/3 × Myc was introduced, the introduction of 3 × Myc reduced the size and the number of tumours, resulting in discrete tumour nodules, which were composed of a thick trabecular structures surrounded by well-developed sinusoids, suggesting a more differentiated state (Figure 6b). Quantitative analysis of areas of HA-positive cells showed a biphasic dose response (Figure 6c). Myc immunohistochemistry without TSA revealed that Myc immunoreactivity was significantly higher in the tumours induced by the introduction of 3 × Myc as compared with those induced by 1 × or 1/3 × Myc (Figure 6b, Supplementary Figure 7a). Myc overexpression did not affect the phosphorylation state of AKT (Figure 6b, Supplementary Figure 7b). Because Myc has also been shown to trigger apoptosis when activated, we suspected that Myc-induced apoptosis might be involved in dampening of the tumour-promoting effect when Myc was applied at high doses. Indeed, the average number of cleaved caspase-3-positive apoptotic cells 3 days following plasmid injection was twice as high in the liver infused with Myc (3 ×) as in the liver infused with Myc (1 ×) (Figures 6d and e; Supplementary Figure 6a).
Figure 6.
The tumour-promoting effect of Myc overexpression is dependent on its degree of deregulation. (a) Gross appearances of the livers and liver-to-body weight ratios 2 weeks after introduction of AKT/HRAS along with various doses of Myc (0, 1/3 ×, 1 × and 3 × of the original dose used in the previous experiments). (b) H&E staining and immunohistochemistry for HA, Myc (without TSA), and phosphorylated AKT of the livers (2 weeks after the introduction of the indicated oncogenes). (c) Quantitative analyses of the area containing HA-positive transduced cells (2 weeks after the introduction of the indicated oncogenes) (n=6 in each group). A total area of approximately 32 mm2 was analysed in each animal. (d) Double immunohistochemistry for cleaved caspase-3 and HA of the livers 3 days after the introduction of AKT/HRAS/Myc (1 ×) or AKT/HRAS/Myc (3 ×). (e) Quantification of cleaved caspase-3 and HA double-positive cells in AKT/HRAS/Myc (1 ×)- and AKT/HRAS/Myc (3 ×)-induced tumours. Approximately 500 HA-positive cells were analysed in each animal. Scale bar, 50 μm. Statistical analyses: one-way ANOVA with Tukey post-hoc test (a, c), Mann−Whitney U-test (e). *P<0.05, ***P<0.001, ****P<0.0001.
Myc inhibits fatty acid synthesis and β-oxidation with potential interaction with HRAS
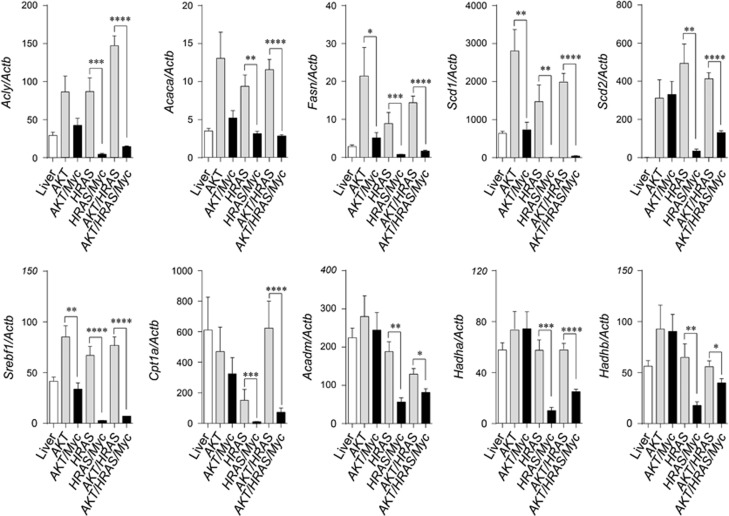
We also explored the mRNA expression of genes relevant to fatty acid synthesis and degradation. In tumours induced by AKT, HRAS and AKT/HRAS, the mRNA expression of proteins involved in fatty acid synthesis (Acly, Acaca, Fasn, Scd1, Scd2 and Srebf1) was increased compared with the control liver (Figure 7). However, the increased expression was suppressed by the co-introduction of Myc particularly when Myc was combined with HRAS (Figure 7). As for proteins related to transport of long-chain fatty acids (Cpt1a) and β-oxidation (Acadm, Hadha, Hadhb), the mRNA levels were markedly decreased in HRAS/Myc- and AKT/HRAS/Myc-induced tumours, but not in AKT/Myc-induced tumours (Figure 7). These results suggested a potential synergistic interaction between Myc and HRAS in the suppression of fatty acid synthesis, transport and β-oxidation. Compatible with the RT-qPCR data, proteomic analysis revealed that the expression of the critical enzymes in fatty acid synthesis, Acly and Fasn, was elevated in AKT/HRAS-induced tumours, but decreased in AKT/HRAS/Myc-induced tumours (Supplementary Figure 8). The expression of many enzymes in fatty acid degradation was decreased in both tumours (Supplementary Figure 8).
Figure 7.
The combination of Myc and HRAS inhibits mRNA expression of proteins involved in fatty acid synthesis and degradation. RT-qPCR analyses of mRNA expression of proteins involved in fatty acid synthesis (Acly, Acaca, Fasn, Scd1, Scd2, Srebf1), transport of long-chain fatty acids (Cpt1a) and fatty acid degradation (Acadm, Hadha, Hadhb) in control liver (Liver) and liver tumours induced by the introduction of various oncogenes (AKT, AKT/Myc, HRAS, HRAS/Myc, AKT/HRAS, AKT/HRAS/Myc) (n=7–8 in each group). Statistical analyses: Mann−Whitney U-test. *P<0.05, **P<0.01, ***P<0.001, ****P<0.0001.
MYC-expressing human HCC is devoid of lipid accumulation and highly proliferative
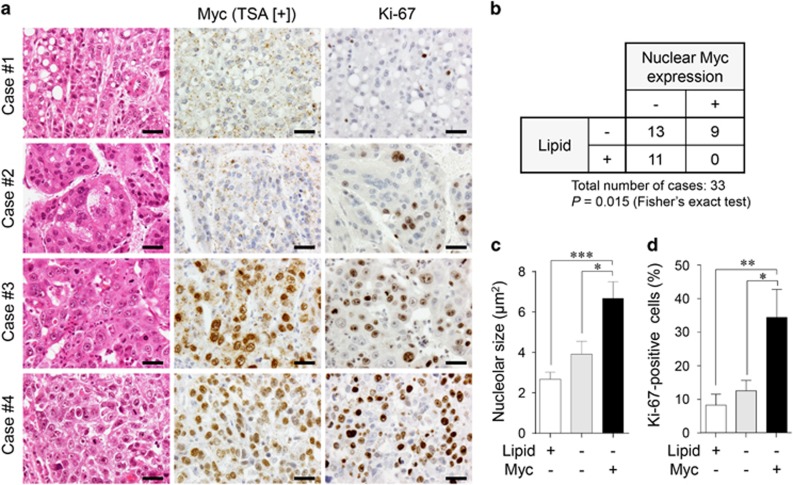
Finally, we inquired whether human HCC with MYC expression might demonstrate the phenotype similar to MYC-expressing mouse tumours. Among the 33 HCC cases examined, nine cases demonstrated distinct nuclear MYC expression (Figures 8a and b), although there was intratumoural heterogeneity. Tumours in 11 cases showing diffuse intracytoplasmic lipid accumulation of various degrees were completely negative for MYC (Figures 8a and b). No MYC-positive tumour areas were accompanied with intracytoplasmic lipid accumulation (Figure 8a) and a statistical analysis suggested that there was a non-random association between Myc expression and the lack of lipid accumulation (Figure 8b; P=0.015, Fisher’s exact test). Interestingly, similar to Myc-overexpressing mouse tumours (see Figure 5c), the nuclei of tumour cells with MYC expression contained prominent nucleoli (Figure 8a). This tendency was confirmed by quantitative analysis (Figure 8c; nucleolar size of control hepatocytes: 2.78±0.17 μm2). Furthermore, Ki-67 immunohistochemistry revealed that MYC-expressing HCC were more proliferative as compared with MYC-negative HCC with or without lipid accumulation (Figures 8a and d).
Figure 8.
MYC-expressing human HCC lacks intracytoplasmic lipid accumulation and is highly proliferative. (a) H&E staining and immunohistochemistry for MYC and Ki-67 of human HCC. Most tumour cells in the case #1 contain intracytoplasmic lipid droplets, while tumours in the cases #2–4 lack intracytoplasmic lipid accumulation. MYC is negative in the cases #1 and 2, while positive in the cases #3 and 4. Scale bar, 50 μm. (b) The relationship between lipid accumulation and nuclear MYC expression in HCC. (c, d) Comparison of nucleolar sizes (c) and cell proliferative activities (percentages of Ki-67-positive cells) (d) among lipid-positive/MYC-negative HCC (n=13), lipid-negative/MYC-negative HCC (n=11), and lipid-negative/MYC-positive HCC (n=9). Statistical analyses: Fisher’s exact test (b) and Kruskal-Wallis test (c, d). *P<0.05, **P<0.01, ***P<0.001.
Discussion
Spontaneous posttranscriptional Myc activation occurred in AKT/HRAS-induced tumours. This was compatible with previous reports,18 in which secondary Myc activation was described in liver tumours induced in AKT/NRAS-induced tumours. The Ras/MEK/ERK pathway has been shown to phosphorylate Ser-62 of MYC protein and enhance its stability.6 The PI3K-mediated activation AKT has been demonstrated to inhibit glycogen synthase kinase-3, which phosphorylates MYC at Thr-58 and facilitates its proteasomal degradation.6 The significance of these posttranslational regulation has been confirmed in mammary gland tumorigenesis in vivo.28 It has also been demonstrated that RAS and AKT induced both phosphorylation-dependent and -independent suppression of MAD, which inhibits MYC-mediated transcriptional activity.29 In the present study, we found that increased Myc expression was closely associated with higher proliferative activity of tumour cells, suggesting an important role of Myc in the progression of mouse liver tumours. Intriguingly, malignant conversion of human hepatocarcinogenesis has been demonstrated to be associated with activation of the MYC transcription signature without concomitant overexpression of the MYC gene.30
AKT/HRAS-induced tumorigenesis was almost completely abrogated by the simultaneous introduction of MadMyc with these oncogenes, suggesting that low or basal levels of Myc expression facilitated the initiation step of AKT/HRAS-induced tumorigenesis. Interestingly, KRAS-driven mouse lung cancers, in which Myc is not amplified, have been reported to be contained and eradicated by the induction of a dominant-negative Myc mutant.31 Furthermore, recent experiments using conditional Myc-knockout mice have shown the importance of expression of endogenous Myc in hepatocytic proliferation induced by a PPAR-α agonist and diethylnitrosamine-induced hepatocarcinogenesis.32 We also showed that inhibition of secondary Myc activation by inducible MadMyc efficiently suppressed the progression of preneoplastic hepatocytes into fully proliferative neoplastic hepatocytes. Furthermore, MadMyc-mediated Myc suppression in AKT/HRAS-induced neoplastic hepatocytes decreased their proliferative activity. It has been shown that conditional Myc inactivation induces differentiation and tumour dormancy in mouse HCC induced by overexpression of Myc.33 These results suggest that, although therapeutic interventions through Myc suppression are effective in the earlier phases of hepatocarcinogenesis, they might be also applicable to the established tumours.
MadMyc-mediated inhibition of proliferation of AKT/HRAS-induced tumours was associated with the reduced expression of several genes (Afp, Slpi, Gpc3 and H19) with oncofetal features.26 Although the exact functions of these genes in hepatocarcinogenesis remain elusive, our results suggest that the regulation of the expression of fetal/neonatal liver genes by Myc may be important in HCC cell proliferation. S100a8 and S100a9, encoding calprotectin, were also identified to be suppressed by MadMyc induction. Calprotectin has recently been shown to play a protumorigenic function in diethylnitrosamine-induced mouse hepatocarcinogenesis.27 Our results also demonstrated that the mRNA expression of Psat1 and Phgdh was suppressed by MadMyc induction, suggesting that serine biosynthesis, which is crucial in glutathione synthesis,34 could be a therapeutic target. On the other hand, MadMyc induction recovered the mRNA expression of Cyp1a2 and Ppp1r3g. Interestingly, cytochrome P450 1A2, the product of CYP1A2, which metabolizes 17-β-estradiol to 2-methoxyestradiol, has been demonstrated to be decreased in human HCC.35 Ppp1r3g, encoding a glycogen-targeting subunit of protein phosphatase 1 that dephosphorylates and activates glycogen synthase, is involved in glucose homeostasis and lipid metabolism.36 Furthermore, GSEA revealed that MadMyc induction was closely correlated with enhanced lipid synthesis and reversely correlated with protein translation, highlighting the importance of therapeutic reversal of metabolic reprogramming induced by Myc.
When Myc was overexpressed simultaneously with AKT, HRAS or AKT/HRAS, it dramatically facilitated tumorigenesis. The synergistic interaction between transgenic Myc and Hras has been shown in mouse hepatocarcinogenesis.11 Furthermore, in a transgenic mouse model overexpressing both Myc and transforming growth factor-α, liver tumorigenesis has been reported to be facilitated due to the generation of an oxidative stress environment that causes the accumulation of DNA damage.37 However, rapid induction of liver tumours in our experiments suggests more direct interactions of Myc and these oncogenic pathways, such as cross signalling between epidermal growth factor receptor and Myc, which has been found in mutant KRAS-induced pancreatic tumours.38 Although deregulated Myc is also a well-known inducer of apoptosis in cells with intact ARF/p53 function,39 the activation of AKT signalling has been shown to inhibit apoptosis induced by Myc,40 sparing its growth-promoting effects.
Our results also revealed that concomitant Myc overexpression above specific threshold levels suppressed AKT/HRAS-induced hepatocarcinogenesis with an increase in early apoptotic cell death of transduced hepatocytes. Consistent with our findings, Murphy et al41 reported that low levels of deregulated Myc induced ectopic proliferation of somatic cells including hepatocytes and that higher levels of Myc expression triggered ARF/p53 apoptotic pathways. Similar differential dose effects of MYC were found in human HCC cell lines with various levels of induced Myc expression.42 Our data show for the first time that the extent of hepatocarcinogenesis is significantly influenced by the levels of deregulated Myc expression, with lower levels being more efficient.
Intracytoplasmic lipid was lost in highly proliferative cells with Myc expression in AKT/HRAS-induced tumours and in tumour cells with forced Myc expression. Although the mRNA expression of proteins involved in fatty acid synthesis was increased in AKT- and/or HRAS-induced tumours, it was strongly suppressed by forced Myc expression. The mRNA expression, as well as protein expression, of the major enzymes participating in β-oxidation was suppressed in tumours, especially in those induced by the combination of HRAS and Myc. Although Myc has been known to stimulate lipogenesis and β-oxidation,2 our results clearly demonstrated a novel interaction of these oncogenes in metabolic reprogramming in hepatocytic tumours. Interestingly, in MYCN-amplified neuroblastoma cell lines, inhibition of N-Myc results in the accumulation of lipid droplets.43 Because the proliferative activity observed in AKT/HRAS/Myc-induced tumours, in which both fatty acid synthesis and β-oxidation were profoundly suppressed, was the highest, this metabolic reprogramming might be beneficial for tumour cell proliferation.
MYC-positive human HCC cells lacked intracytoplasmic lipid accumulation and were more proliferative as compared with those without MYC expression. A previous report demonstrated that MYC gene amplification in human HCC was positively correlated with proliferative activity and associated with shorter disease-free survival in patients.44 Furthermore, MYC-positive tumour cells characteristically possessed prominent nucleoli, which were similar to those found in the nuclei of Myc-overexpressing mouse tumours. MYC is known to be involved in synthesis of the precursor rRNA and its processing.45 Interestingly, adenovirus-mediated overexpression of Myc in mouse hepatocytes in vivo has been reported to induce enlargement of their nucleoli, as well as nuclei, with increased mRNA levels of genes that encode proteins engaged in ribosomal biogenesis and protein translation.46 In conclusion, our findings in this experimental study, which have been at least partly validated in human specimens, highlight the critical importance of Myc in hepatocarcinogenesis.
Materials and methods
Animals
C57BL/6J mice were purchased from Charles River Laboratories Japan (Yokohama, Japan). The mice were killed under deep anesthesia. The protocols used for animal experimentation were approved by the Animal Research Committee, Asahikawa Medical University, and all animal experiments adhered to the criteria outlined in the Animal Research: Reporting of In Vivo Experiments (ARRIVE) guidelines. No blinding was used for animal experiments. All animals used were included in the analyses.
Transposon-mediated introduction of oncogenes into mouse hepatocytes
To introduce genes into hepatocytes in vivo, the combination of the SB transposon system and HTVi was performed.47 The plasmids were co-injected with an SB13 transposase-expression plasmid into male C57BL/6J mice (8–12-week-old) via HTVi. An SB13 transposase-expressing vector (pT2/C-Luc/PGK-SB13, Addgene plasmid #20207) and a myrAKT-HA-expressing transposon cassette vector (pT3-EF1α-myrAKT-HA, Addgene plasmid #31789) were obtained from Addgene (Cambridge, MA, USA). cDNA fragments of FLAG-HRASV12, EGFP, Venus-IRES-rtTA3 and MadMyc-HA were amplified from pTomo-Ras (Addgene plasmid #26292), pCMV-EGFP (Takara Bio, Kusatsu, Shiga, Japan), TtRMPVIR (Addgene plasmid #27995) and MadMyc-HA (Addgene plasmid #16557),25 respectively. A full length Myc fragment was amplified from cDNA of diethylnitrosamine-induced mouse liver tumours. These cDNA fragments were cloned into the pT3-EF1α transposon cassette plasmid using the Gateway® cloning system (ThermoFisher Scientific, Waltham, MA, USA). For construction of the tetracycline-controlled transcriptional activation system (Tet-On), the EF1α promoter of the destination vector of the Gateway cloning system was replaced with the TRE-tight promoter, which was amplified from TtRMPVIR, using the GeneArt Seamless Cloning and Assembly Kit (ThermoFisher Scientific).
For HTVi, plasmids were dissolved in 2.5 ml Ringer solution and rapidly injected via the lateral tail vein of mice within 8 s. The total amount of plasmid DNA were 16, 25, 36 and 43 μg for mixtures of 2, 3, 4 and 5 different plasmids (including the transposase-expressing vector), respectively. The molar ratio of the transposase-expressing vector to each transposon cassette plasmid containing various genes was 1:2. To induce MadMyc expression in the Tet-On system, mice were given Dox ad libitum as drinking water (2 mg/ml Dox and 1% sucrose in tap water). The animals were randomly assigned to Dox (−) and Dox (+) groups.
Microscopic examination and immunohistochemistry
The livers were fixed in phosphate-buffered 4% paraformaldehyde for 24 h, dehydrated, cleared and embedded in paraffin. Immunohistochemical staining was performed using the EnVision/HRP system (DAKO, Carpinteria, CA, USA) on deparaffinized sections treated with Target Retrieval Solution (DAKO). The antibodies used were as follows: anti-GFP (A-11122, ThermoFisher Scientific), anti-p-AKT (#3787, Cell Signaling Technology, Danvers, MA, USA), anti-p-ERK1/2 (#4370, Cell Signaling Technology), anti-Myc (Abcam 32072, Cambridge, UK), anti-Ki-67 (Nichirei, Tokyo, Japan), anti-cleaved caspase-3 (#9661, Cell Signaling Technology), anti-hemagglutinin (HA) (Roche Diagnostics, Mannheim, Germany), anti-p16 (M-156) (sc-1207, Santa Cruz Biotechnology, Santa Cruz, CA, USA), and p21 (F-5) (sc-6246, Santa Cruz). The chromogen 3,3′-diaminobenzidine tetrahydrochloride (Vector Laboratories, Burlingame, CA, USA) and HistoGreen (LINARIS Biologische Produkte, Dossenheim, Germany) were used for signal detection. For the detection of Myc in some experiments, TSA was performed using the TSA Plus DIG Kit (PerkinElmer, Waltham, MA, USA). Morphometric analyses were performed using ImageJ software. Frozen sections were stained with Sudan III.
Quantitative reverse transcriptase-polymerase chain reaction
Total RNA was extracted from frozen liver tissues and subjected to RT-qPCR analyses, which were performed using the ΔΔCt method with the FastStart Universal SYBR Green Master Mix (Roche Diagnostics). Each reaction was performed in duplicates, and the mRNA levels were normalized against β-actin (Actb). The sequences of the specific primers are listed in Supplementary Table 1.
Microarray and Gene Set Enrichment Analysis
Total RNA was prepared from snap-frozen tissues using a Sepasol reagent (RNA I Super G; Nacalai Tesque, Kyoto, Japan) and samples with an RNA integrity number >7.0 were used for microarray analyses. Samples of AKT/HRAS/Tet-On-MadMyc tumours (a mixture of three independent tumours) either from mice treated or not treated with Dox were analysed and compared by one-colour microarrays (3D-Gene Microarray, TORAY, Tokyo, Japan). After background subtraction, the raw microarray data were normalized using a standard global normalization technique. GSEA was performed using the GSEA v2.2.3 software using gene set collections of ‘MYC Target Gene Database’ (C2), ‘Reactome gene sets’ (C2) and ‘GO gene sets’ (C5) from the Molecular Signature Database provided by the Broad Institute.48
Proteomic analysis of the enzymes involved in fatty acid metabolism
Samples for soluble proteins were extracted from the tumours induced by AKT/HRAS (a mixture of four tumours) and AKT/HRAS/Myc (a mixture of five tumours), as well as control liver tissues (a mixture of tissue fragments from four mice). The samples were digested by trypsin and subjected to triplicate liquid chromatography-tandem mass spectrometry analyses (LTQ-Orbitrap XL, ThermoFisher Scientific, San Jose, CA, USA). Proteins were identified by the Mascot software (Matrix Science, London, UK) and the spectral counting data were semiquantitatively represented as exponentially modified protein abundance index (emPAI).
Human liver samples
The retrospective analysis of surgical specimens was approved by the internal review board of Asahikawa Medical University (approved number: 14004). A total of 33 HCC samples from patients who had curative hepatectomy were collected. Myc and Ki-67 immunohistochemistry was performed as described above using serial paraffin sections.
Statistical analysis
Results from experiments were expressed as mean±SEM. Unpaired two-tailed t-test, Mann−Whitney U-test, Kruskal−Wallis test, one-way analysis of variance (ANOVA) with Tukey post-hoc test, or Mantel−Cox test (for a Kaplan−Meier plot) were performed to compare differences. Fisher’s exact test was used to evaluate human HCC samples. Statistical analyses were performed using Prism 6.07 (GraphPad Software, La Jolla, CA, USA).
Acknowledgments
This work was supported by grants from the Ministry of Education, Culture, Sports, Science, and Technology of Japan (#26870025 to MY; #18590362, #21590426 and #24390092 to YN). We thank Mr Yoshiyasu Satake for animal care and Ms Ema Yamatomi, Ms Hiroko Chiba, and Ms Aya Kitano for secretarial assistance. We are also grateful to the staff of the Department of Pathology, Asahikawa Medical University Hospital for generous help.
Footnotes
Supplementary Information accompanies this paper on the Oncogene website (http://www.nature.com/onc)
The authors declare no conflict of interest.
Supplementary Material
References
- Stine ZE, Walton ZE, Altman BJ, Hsieh AL, Dang CV. MYC, metabolism, and cancer. Cancer Discov 2015; 5: 1024–1039. [DOI] [PMC free article] [PubMed] [Google Scholar]
- Wahlstrom T, Henriksson MA. Impact of MYC in regulation of tumor cell metabolism. Biochim Biophys Acta 2015; 1849: 563–569. [DOI] [PubMed] [Google Scholar]
- Zucman-Rossi J, Villanueva A, Nault JC, Llovet JM. Genetic landscape and biomarkers of hepatocellular carcinoma. Gastroenterology 2015; 149: 1226–1239 e1224. [DOI] [PubMed] [Google Scholar]
- Fujiwara Y, Monden M, Mori T, Nakamura Y, Emi M. Frequent multiplication of the long arm of chromosome 8 in hepatocellular carcinoma. Cancer Res 1993; 53: 857–860. [PubMed] [Google Scholar]
- Thorgeirsson SS, Grisham JW. Molecular pathogenesis of human hepatocellular carcinoma. Nat Genet 2002; 31: 339–346. [DOI] [PubMed] [Google Scholar]
- Sears RC. The life cycle of c-myc: from synthesis to degradation. Cell Cycle 2004; 3: 1133–1137. [PubMed] [Google Scholar]
- Adhikary S, Eilers M. Transcriptional regulation and transformation by Myc proteins. Nat Rev Mol Cell Biol 2005; 6: 635–645. [DOI] [PubMed] [Google Scholar]
- Lutz W, Leon J, Eilers M. Contributions of Myc to tumorigenesis. Biochim Biophys Acta 2002; 1602: 61–71. [DOI] [PubMed] [Google Scholar]
- Carroll M, Borden KL. The oncogene eIF4E: using biochemical insights to target cancer. J Interferon Cytokine Res 2013; 33: 227–238. [DOI] [PMC free article] [PubMed] [Google Scholar]
- Poortinga G, Quinn LM, Hannan RD. Targeting RNA polymerase I to treat MYC-driven cancer. Oncogene 2015; 34: 403–412. [DOI] [PubMed] [Google Scholar]
- Sandgren EP, Quaife CJ, Pinkert CA, Palmiter RD, Brinster RL. Oncogene-induced liver neoplasia in transgenic mice. Oncogene 1989; 4: 715–724. [PubMed] [Google Scholar]
- Coulouarn C, Gomez-Quiroz LE, Lee JS, Kaposi-Novak P, Conner EA, Goldina TA et al. Oncogene-specific gene expression signatures at preneoplastic stage in mice define distinct mechanisms of hepatocarcinogenesis. Hepatology 2006; 44: 1003–1011. [DOI] [PubMed] [Google Scholar]
- Stein TJ, Bowden M, Sandgren EP. Minimal cooperation between mutant Hras and c-myc or TGFalpha in the regulation of mouse hepatocyte growth or transformation in vivo. Liver Int 2011; 31: 1298–1305. [DOI] [PMC free article] [PubMed] [Google Scholar]
- Ivics Z, Hackett PB, Plasterk RH, Izsvak Z. Molecular reconstruction of Sleeping Beauty, a Tc1-like transposon from fish, and its transposition in human cells. Cell 1997; 91: 501–510. [DOI] [PubMed] [Google Scholar]
- Liu F, Song Y, Liu D. Hydrodynamics-based transfection in animals by systemic administration of plasmid DNA. Gene Ther 1999; 6: 1258–1266. [DOI] [PubMed] [Google Scholar]
- Yant SR, Meuse L, Chiu W, Ivics Z, Izsvak Z, Kay MA. Somatic integration and long-term transgene expression in normal and haemophilic mice using a DNA transposon system. Nat Genet 2000; 25: 35–41. [DOI] [PubMed] [Google Scholar]
- Carlson CM, Frandsen JL, Kirchhof N, McIvor RS, Largaespada DA. Somatic integration of an oncogene-harboring Sleeping Beauty transposon models liver tumor development in the mouse. Proc Natl Acad Sci USA 2005; 102: 17059–17064. [DOI] [PMC free article] [PubMed] [Google Scholar]
- Ho C, Wang C, Mattu S, Destefanis G, Ladu S, Delogu S et al. AKT (v-akt murine thymoma viral oncogene homolog 1) and N-Ras (neuroblastoma ras viral oncogene homolog) coactivation in the mouse liver promotes rapid carcinogenesis by way of mTOR (mammalian target of rapamycin complex 1), FOXM1 (forkhead box M1)/SKP2, and c-Myc pathways. Hepatology 2012; 55: 833–845. [DOI] [PMC free article] [PubMed] [Google Scholar]
- Calvisi DF, Wang C, Ho C, Ladu S, Lee SA, Mattu S et al. Increased lipogenesis, induced by AKT-mTORC1-RPS6 signaling, promotes development of human hepatocellular carcinoma. Gastroenterology 2011; 140: 1071–1083. [DOI] [PMC free article] [PubMed] [Google Scholar]
- Chow EK, Fan LL, Chen X, Bishop JM. Oncogene-specific formation of chemoresistant murine hepatic cancer stem cells. Hepatology 2012; 56: 1331–1341. [DOI] [PMC free article] [PubMed] [Google Scholar]
- Kang TW, Yevsa T, Woller N, Hoenicke L, Wuestefeld T, Dauch D et al. Senescence surveillance of pre-malignant hepatocytes limits liver cancer development. Nature 2011; 479: 547–551. [DOI] [PubMed] [Google Scholar]
- Castellano E, De Las Rivas J, Guerrero C, Santos E. Transcriptional networks of knockout cell lines identify functional specificities of H-Ras and N-Ras: significant involvement of N-Ras in biotic and defense responses. Oncogene 2007; 26: 917–933. [DOI] [PubMed] [Google Scholar]
- Castellano E, Guerrero C, Nunez A, De Las Rivas J, Santos E. Serum-dependent transcriptional networks identify distinct functional roles for H-Ras and N-Ras during initial stages of the cell cycle. Genome Biol 2009; 10: R123. [DOI] [PMC free article] [PubMed] [Google Scholar]
- Berns K, Hijmans EM, Bernards R. Repression of c-Myc responsive genes in cycling cells causes G1 arrest through reduction of cyclin E/CDK2 kinase activity. Oncogene 1997; 15: 1347–1356. [DOI] [PubMed] [Google Scholar]
- Hermeking H, Rago C, Schuhmacher M, Li Q, Barrett JF, Obaya AJ et al. Identification of CDK4 as a target of c-MYC. Proc Natl Acad Sci USA 2000; 97: 2229–2234. [DOI] [PMC free article] [PubMed] [Google Scholar]
- Chen X, Yamamoto M, Fujii K, Nagahama Y, Ooshio T, Xin B et al. Differential reactivation of fetal/neonatal genes in mouse liver tumors induced in cirrhotic and non-cirrhotic conditions. Cancer Sci 2015; 106: 972–981. [DOI] [PMC free article] [PubMed] [Google Scholar]
- De Ponti A, Wiechert L, Schneller D, Pusterla T, Longerich T, Hogg N et al. A pro-tumorigenic function of S100A8/A9 in carcinogen-induced hepatocellular carcinoma. Cancer Lett 2015; 369: 396–404. [DOI] [PubMed] [Google Scholar]
- Wang X, Cunningham M, Zhang X, Tokarz S, Laraway B, Troxell M et al. Phosphorylation regulates c-Myc’s oncogenic activity in the mammary gland. Cancer Res 2011; 71: 925–936. [DOI] [PMC free article] [PubMed] [Google Scholar]
- Zhu J, Blenis J, Yuan J. Activation of PI3K/Akt and MAPK pathways regulates Myc-mediated transcription by phosphorylating and promoting the degradation of Mad1. Proc Natl Acad Sci USA 2008; 105: 6584–6589. [DOI] [PMC free article] [PubMed] [Google Scholar]
- Kaposi-Novak P, Libbrecht L, Woo HG, Lee YH, Sears NC, Coulouarn C et al. Central role of c-Myc during malignant conversion in human hepatocarcinogenesis. Cancer Res 2009; 69: 2775–2782. [DOI] [PMC free article] [PubMed] [Google Scholar]
- Soucek L, Whitfield JR, Sodir NM, Masso-Valles D, Serrano E, Karnezis AN et al. Inhibition of Myc family proteins eradicates KRas-driven lung cancer in mice. Genes Dev 2013; 27: 504–513. [DOI] [PMC free article] [PubMed] [Google Scholar]
- Qu A, Jiang C, Cai Y, Kim JH, Tanaka N, Ward JM et al. Role of Myc in hepatocellular proliferation and hepatocarcinogenesis. J Hepatol 2014; 60: 331–338. [DOI] [PMC free article] [PubMed] [Google Scholar]
- Shachaf CM, Kopelman AM, Arvanitis C, Karlsson A, Beer S, Mandl S et al. MYC inactivation uncovers pluripotent differentiation and tumour dormancy in hepatocellular cancer. Nature 2004; 431: 1112–1117. [DOI] [PubMed] [Google Scholar]
- Antonov A, Agostini M, Morello M, Minieri M, Melino G, Amelio I. Bioinformatics analysis of the serine and glycine pathway in cancer cells. Oncotarget 2014; 5: 11004–11013. [DOI] [PMC free article] [PubMed] [Google Scholar]
- Ren J, Chen GG, Liu Y, Su X, Hu B, Leung BC et al. Cytochrome P450 1A2 metabolizes 17beta-estradiol to suppress hepatocellular carcinoma. PLoS ONE 2016; 11: e0153863. [DOI] [PMC free article] [PubMed] [Google Scholar]
- Zhang Y, Xu D, Huang H, Chen S, Wang L, Zhu L et al. Regulation of glucose homeostasis and lipid metabolism by PPP1R3G-mediated hepatic glycogenesis. Mol Endocrinol 2014; 28: 116–126. [DOI] [PMC free article] [PubMed] [Google Scholar]
- Factor VM, Kiss A, Woitach JT, Wirth PJ, Thorgeirsson SS. Disruption of redox homeostasis in the transforming growth factor-alpha/c-myc transgenic mouse model of accelerated hepatocarcinogenesis. J Biol Chem 1998; 273: 15846–15853. [DOI] [PubMed] [Google Scholar]
- Diersch S, Wirth M, Schneeweis C, Jors S, Geisler F, Siveke JT et al. Kras induces EGFR-MYC cross signaling in murine primary pancreatic ductal epithelial cells. Oncogene 2015; 35: 3880–3886. [DOI] [PMC free article] [PubMed] [Google Scholar]
- Hoffman B, Amanullah A, Shafarenko M, Liebermann DA. The proto-oncogene c-myc in hematopoietic development and leukemogenesis. Oncogene 2002; 21: 3414–3421. [DOI] [PubMed] [Google Scholar]
- Kauffmann-Zeh A, Rodriguez-Viciana P, Ulrich E, Gilbert C, Coffer P, Downward J et al. Suppression of c-Myc-induced apoptosis by Ras signalling through PI(3)K and PKB. Nature 1997; 385: 544–548. [DOI] [PubMed] [Google Scholar]
- Murphy DJ, Junttila MR, Pouyet L, Karnezis A, Shchors K, Bui DA et al. Distinct thresholds govern Myc’s biological output in vivo. Cancer Cell 2008; 14: 447–457. [DOI] [PMC free article] [PubMed] [Google Scholar]
- Akita H, Marquardt JU, Durkin ME, Kitade M, Seo D, Conner EA et al. MYC activates stem-like cell potential in hepatocarcinoma by a p53-dependent mechanism. Cancer Res 2014; 74: 5903–5913. [DOI] [PMC free article] [PubMed] [Google Scholar]
- Zirath H, Frenzel A, Oliynyk G, Segerstrom L, Westermark UK, Larsson K et al. MYC inhibition induces metabolic changes leading to accumulation of lipid droplets in tumor cells. Proc Natl Acad Sci USA 2013; 110: 10258–10263. [DOI] [PMC free article] [PubMed] [Google Scholar]
- Kawate S, Fukusato T, Ohwada S, Watanuki A, Morishita Y. Amplification of c-myc in hepatocellular carcinoma: correlation with clinicopathologic features, proliferative activity and p53 overexpression. Oncology 1999; 57: 157–163. [DOI] [PubMed] [Google Scholar]
- Schlosser I, Holzel M, Murnseer M, Burtscher H, Weidle UH, Eick D. A role for c-Myc in the regulation of ribosomal RNA processing. Nucleic Acids Res 2003; 31: 6148–6156. [DOI] [PMC free article] [PubMed] [Google Scholar]
- Kim S, Li Q, Dang CV, Lee LA. Induction of ribosomal genes and hepatocyte hypertrophy by adenovirus-mediated expression of c-Myc in vivo. Proc Natl Acad Sci USA 2000; 97: 11198–11202. [DOI] [PMC free article] [PubMed] [Google Scholar]
- Bell JB, Podetz-Pedersen KM, Aronovich EL, Belur LR, McIvor RS, Hackett PB. Preferential delivery of the Sleeping Beauty transposon system to livers of mice by hydrodynamic injection. Nat Protoc 2007; 2: 3153–3165. [DOI] [PMC free article] [PubMed] [Google Scholar]
- Subramanian A, Tamayo P, Mootha VK, Mukherjee S, Ebert BL, Gillette MA et al. Gene set enrichment analysis: a knowledge-based approach for interpreting genome-wide expression profiles. Proc Natl Acad Sci USA 2005; 102: 15545–15550. [DOI] [PMC free article] [PubMed] [Google Scholar]
Associated Data
This section collects any data citations, data availability statements, or supplementary materials included in this article.


