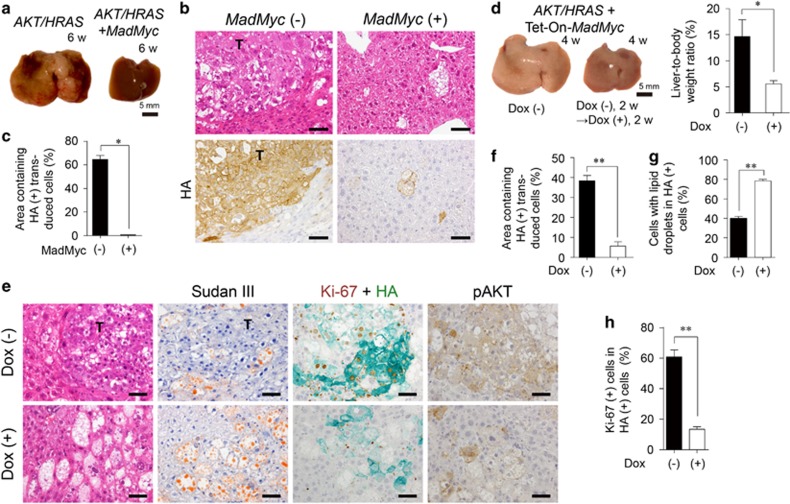
Figure 3.
Competitive inhibition of Myc impairs AKT/HRAS-induced tumorigenesis. (a) Gross appearances of the livers 6 weeks after introduction of AKT/HRAS with or without MadMyc. (b) H&E staining and immunohistochemistry for HA of the liver. (c) Quantitative analyses of the area containing HA-positive transduced cells (n=3 for AKT/HRAS group, n=6 for AKT/HRAS/MadMyc group). A total area of approximately 12 mm2 was analysed in each animal. (d) Gross appearances of the livers and liver-to-body weight ratios 4 weeks after the introduction of AKT/HRAS/Tet-On-MadMyc. In the Dox (+) group, at 2 weeks after plasmid injection, Dox was administered during a period of 2 weeks to induce MadMyc (n=6 for each group). (e) H&E and Sudan III stainings, double immunohistochemistry for Ki-67 (brown) and HA (green), and immunohistochemistry for phosphorylated AKT (pAKT) of the livers. (f) Quantitative analysis of percentages of area containing HA-positive transduced cells. A total area of 2.32 mm2 was analysed in each animal. (g, h) HA-positive cells with lipid droplets (g), and double positive cells for Ki-67 and HA (h) in the Dox (−) and Dox (+) groups (n=6 and 4, respectively). Approximately 500 HA-positive cells were analysed in each animal (g, h). T, tumours. Scale bar, 50 μm. Statistical analyses: unpaired t-test (d and f), Mann−Whitney U-test (c, g, h). *P<0.05, **P<0.01.

