FIG 7 .
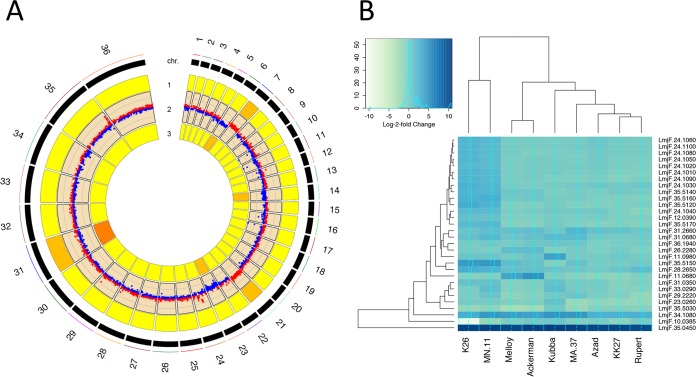
Global changes in transcription highlight significant gene dosage effects, with differential expression of membrane-bound transporter genes in a pairwise comparison between K26 (India) and Ackerman (Israel). (A) RCircos plot illustrating gene dosage effects on transcription genome-wide due to aneuploidy in a pairwise comparison between K26 and Ackerman. These isolates were selected due to the large number of chromosomes that differed for somy between each other. Tracks 1 and 3 represent somy for K26 and Ackerman, respectively, while the results shown in track 2 were obtained using edgeR to graphically represent differentially expressed genes, with upregulated genes in red (log fold change > 0) and downregulated genes in blue (log fold change < 0). Log fold changes in expression mirror differences in somy, indicating substantial gene dosage effects in L. tropica. (B) Heat map of the 30 most significantly differentially expressed genes, represented with their log fold changes in expression. A darker shade of blue indicates higher expression. Note the large cluster of DE genes on chromosome 24 that were upregulated in isolates K26 and MN11. This cluster is part of the CNV in isolate K26 (shown in Fig. 6; CNVR114). Other notable genes include LmjF.35.5150 and LmJF.10.0385, which appear to be amplified and deleted, respectively, in K26. These genes code for a biopterin transporter and a folate transporter that are known to act in concert in folate metabolism. A gene encoding a hypothetical MFS general transporter (LmjF.11.0680) was also upregulated in isolates Melloy and Ackerman.

