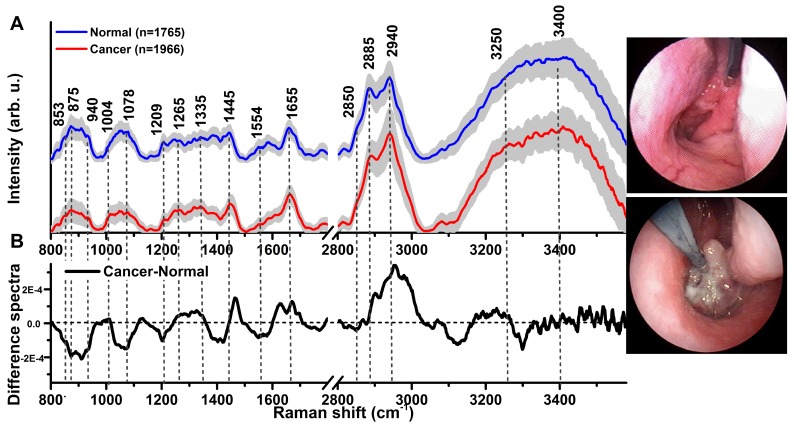
Fig 1.
(A) The mean in vivo FP/HW Raman spectra ±1 standard deviations (SD) of normal (n=1765) and NPC (n=1966) acquired from 204 tissue sites (normal=95; carcinoma=109) of 95 subjects during clinical endoscopy. (B) Difference Raman spectra (i.e., carcinoma - normal) ± 1 SD resolving the distinct spectral features of NPC. The corresponding images of the simultaneous FP/HW Raman procedures under white-light reflectance endoscopic imaging guidance are also shown.

