

Abstract
Objective
Previous work on the course of drinking across the life course identified four distinct patterns of problem drinking: severe chronic (SC), severe nonchronic (SNC), late onset (LO) and young adult (YA). The purpose of the current study was to determine the generalizability of these findings to a sample of midlife veterans with quite different characteristics from those previously assessed; specifically, veterans in treatment for HIV and veterans in treatment for non-HIV medical issues.
Method
Participants were drawn from the Veterans Aging Cohort Study (VACS) which included HIV-positive and matched non-HIV participants. As in our earlier studies, the Lifetime Drinking History was used to assess drinking phases, and Latent Growth Mixture Models were used for analyses.
Results
Similar to previous findings, both the HIV+ and non-HIV groups exhibited four patterns of drinking (SC, SNC, LO, YA). SC drinkers had younger ages of onset for drinking, and longer duration of smoking. SC drinkers also had highest rates of cocaine use. Within the HIV+ subgroup, SC and LO drinkers increased their drinking after their HIV diagnosis.
Conclusion
This study is the first to examine lifetime drinking patterns among those treated for HIV and provides an excellent starting point for examining finer-grained relationships involving drinking, onset of HIV, and treatment outcomes. Absent from the current study and of particular importance to future work in this area is the need for precise information regarding the temporal relationship between date of HIV diagnosis, onset of treatment and changes in drinking behavior over the life course.
Alcoholism is a heterogeneous disorder comprising various typologies based on differences along a range of dimensions (e.g., age of onset, gender, psychiatric comorbidity, drinking patterns, genetic underpinnings). The intent of these efforts is to identify more homogeneous subgroups, which can increase the validity of empirical studies of alcoholism etiology and encourage the development of more precisely structured clinical interventions. Another way of defining alcoholism types is based on differences in the developmental nature of the disorder. Although often implied in the extant literature, few empirically-based studies have focused on variations in the course of alcoholism beyond the third decade of life. Within this small literature, most studies have focused on the timeframe from adolescence to young adulthood and have typically identified two major trajectories: chronic problem use associated with deviant behavior (i.e., antisocial alcoholism) and problem drinking that begins in adolescence and declines by the mid-20s (i.e., developmentally-limited alcoholism). Very few studies, however, have characterized the course of alcoholism from young adulthood through mid-life. This research gap is especially important given (i) the high prevalence of problem drinking in mid to late life (Grant et al., 2006), (ii) the need to understand how differences in early adult drinking patterns map onto subsequent periods of problem drinking, and (iii) how individual and interpersonal influences alter the progression from diagnosis to remission to relapse.
Our initial work on this topic was based on a sample of mid-life twins drawn from the Vietnam Era Twin Registry (VETR), all of whom had a lifetime diagnosis of alcohol dependence (AD) (Eisen et al., 1987). Making use of data obtained from the Lifetime Drinking History (LDH) interview (Gladsjo et al., 1992; Jacob et al., 2009; Koenig et al., 2009; Lemmens et al., 1997; Skinner and Schuller, 1982; Skinner and Sheu, 1982), four drinking trajectories were identified (severe chronic, severe nonchronic, late onset and young adult alcoholism). Subsequently, these findings were replicated with a sample of nontwin veterans drawn from the Vietnam Era Study (VES), providing further support for the replicability of this set of AD trajectories over much of the life-course (Jacob et al., 2010). More recently, we reanalyzed data from the VETR using consumption-based indices in comparison to diagnostic indices (i.e., AD). For those classified as “heavy drinkers” (i.e., ≥60 drinks in a month), a similar (although not identical) set of drinking trajectories were identified, which had substantial concordance with the AD-based analyses in terms of the classification of individuals into one of the four trajectories (Jacob et al., 2011).
The purpose of the current study was to characterize lifetime drinking trajectories on a sample of veterans at midlife with quite different characteristics from those previously assessed; specifically, a sample of veterans in treatment for HIV, as well as a group of veterans in treatment for non-HIV medical issues. There now exists a substantial literature documenting an elevated lifetime prevalence of alcohol use disorders (AUD) among those with an HIV diagnosis and the impact of AUD on the course of HIV, including increased risk for (a) medical comorbidities (e.g., liver, cardiovascular, pulmonary and bone disease) (Friis-Moller et al., 2003; Happel and Nelson, 2005; McComsey et al., 2010; Vittecoq et al., 2003; Weber et al., 2006); (b) poor adherence to medication regimens (Braithwaite et al., 2005; Hinkin et al., 2004); and (c) engagement in risky sexual behavior (Simbayi et al., 2004). What is not yet known, however, is the developmental context that characterizes associations between alcohol consumption and the progression of HIV and related disorders. Such determinations require longitudinal data to establish temporal relationships between alcohol and HIV variables. Even more fundamental is the need to determine the lifetime course of problem drinking among those with HIV and whether emergent drinking trajectories differ from those previously reported. Several outcomes are possible. For example, those with HIV could exhibit greater alcohol use (or a history of greater alcohol use), which would be reflected in a larger proportion of cases classified within the severe chronic drinking trajectory. Conversely, those with HIV might reduce alcohol consumption after their initial diagnosis in an effort to maximize the effectiveness of their treatment, a scenario that would result in a larger proportion of cases classified into the severe nonchronic trajectory. Finally, it is possible that cohort effects (i.e., all samples consist of mid-life veterans of similar military and SES backgrounds) would be dominant in determining long-term patterns of drinking, such that the current sample would yield similar trajectories and similar proportions of participants classified into the various trajectories as found in our earlier analyses. The data set used in the current study was unusual in allowing for drinking trajectory analyses based on LDH data of veterans in treatment for HIV and for determining how these drinkers are distributed across the different trajectories in comparison with our earlier findings. Although it was not possible to determine direction of effects between drinking behavior and progress of HIV from diagnosis through treatment, it was anticipated that emergent findings would provide important information regarding generalizability of our earlier findings, and inform directions to be taken in subsequent research.
Methods
Participants
Participants were drawn from the Veterans Aging Cohort Study (VACS)–an ongoing longitudinal study of 7422 veterans receiving medical care at one of eight VA healthcare centers. Participants were selected for an HIV-positive (+) or non-HIV status matched by age, race, site, and healthcare utilization (at the time that this data was sampled, HIV+ n=3710, non-HIV n=3712). HIV+ participants were recruited from infectious disease clinics and non-HIV controls from general medicine clinics at the same study site (Justice et al., 2006).
Telephone surveys which included lifetime history of alcohol use were conducted in a random 50% sample of HIV-infected and 25% sample of uninfected VACS subjects who reported that they had at least one alcoholic drink during their lifetime. Among 3519 individuals identified for this sub-study, 715 (20%) could not be reached, 3 (<0.1%) died before they could be contacted and 27 (<1%) refused to participate. This resulted in 1509 HIV+ and 1609 uninfected subjects completing the survey (89% of target sample) (Braithwaite et al., 2005). Demographic characteristics of those who did and did not complete the telephone interview were similar. On average, participants were 49.5 years old at the time of interview (SD=9.20; range=21–86), predominantly male (94%), and 61% attended at least one year of college. The racial composition was as follows: African-American (62%), Caucasian (25%), Hispanic (9%). The over-representation of African-Americans is comparable to the estimated prevalence rates of HIV infection by ethnicity in the general US population (Centers for Disease Control and Prevention, 2008).
Procedure and Measures
Prior to the telephone interview, participants completed a self-report questionnaire (2002 to 2004) when they first entered the medical facility for treatment, which included information on demographics, general health, substance use patterns, and depression. Participants were then scheduled for a telephone interview during which time the LDH was administered. Interviewers received specialized training in standardized practices of administration, practiced role-plays and mock interviews, and demonstrated their competence to research supervisors (Braithwaite et al., 2005).
Lifetime drinking history
During the telephone interview, a modified LDH interview was used to obtain longitudinal (retrospective) information on quantity and frequency of alcohol use for self-defined phases of drinking among HIV+ veterans (n=1509) and the matched sample of non-HIV controls (n=1609). Beginning with the onset of regular drinking (at least one drink per month), drinking phases were determined by the participant’s indication of a marked change in either quantity or frequency of drinking. Participants could report up to 12 phases (M=3.63; SD=2.0) and for each phase, information was obtained regarding quantity of drinks consumed on drinking days and frequency of drinking days per month, as well as any major life events (e.g., marital/family, work, medical, financial) that were reported to be associated with each phase of drinking. The reliability and validity of the LDH is supported by various studies (Gladsjo et al., 1992; Jacob et al., 2006; Koenig et al., 2009; Skinner and Schuller, 1982; Skinner and Sheu, 1982; Sobell et al., 1988). For example, Jacob et al. (2006) reported test-retest reliability at 5 years to be between .57 and .71, and Koenig et al. (2009) reported correlations between .57 and .69 for quantity/frequency measures reported prospectively and retrospectively at 13 years.
Demographic and health information
Demographic and behavioral health information were obtained from the Veterans Health Survey (Office of Quality and Performance, 2000) prior to the telephone interviews during the initial VACS study enrollment; this included information regarding race, marital status, cigarette smoking habits (current and total years smoked), educational attainment, and income. For HIV+ participants, the interviewer asked whether drinking frequency or quantity changed after being notified of their positive HIV status.
Drug use
Past use and frequency of current use of illicit drugs (i.e., cocaine) was assessed with items from the Drug Abuse Screening Test (DAST; (Skinner, 1982). The concurrent, discriminant, and criterion validity of the DAST is supported by various studies (Bohn et al., 1991; Gavin et al., 1989; Skinner and Goldberg, 1986), as well as excellent internal consistency reliability (α=.92) (McCann et al., 2000). Frequency of use was rated on a 7-point scale with higher scores indicating more days during the past year when drugs were used (0=never used, 6=daily use). Dichotomous data on lifetime and current use (within the past year) were computed from this variable.
Drinking patterns and problems
Specific items from the Alcohol Use Disorders Identification Test (AUDIT) (Babor et al., 1992a) were selected to provide further information regarding drinking behavior at the time of the telephone interview (e.g., frequency of drinking, binge drinking, drinking-related problems). Current frequency of drinking was assessed on a 5-point scale (0=never, 4=4 or more times a week). Participants were also asked how often they currently engaged in binge-drinking (0=never, 4=daily or almost daily), and if family, friends, or doctors were concerned about their drinking (0=no, 1=yes). Finally, selected items from the Alcohol Dependence Scale (ADS) (Skinner and Horn, 1984) provided data regarding current alcohol dependence symptoms.
Depression
Symptoms of depression were obtained with the Beck Depression Inventory for Primary Care (Beck et al., 1997), which comprises 7 items related to cognitive and affective symptoms experienced during the prior two weeks. Among medical patients, this measure has shown high internal consistency, and endorsement of 4 or more items has been found to yield a rate of 82% on both sensitivity and specificity for a diagnosis of depression (Beck et al., 1997).
Follow-up assessments
Subsequent to the baseline telephone interview, the first of five annual follow-ups was conducted in 2003–2004. The average number of follow-up interviews completed by participants was 3.0 (SD=1.6). There were no differences between those who did and did not complete one or more follow-up interviews regarding alcohol-related problems as measured by AUDIT items from the baseline interview.
Drinking problems
At each follow-up assessment, a full AUDIT score was obtained. This instrument has demonstrated high test-retest reliability across drinkers and non-drinkers (Hays et al., 1995), and good discrimination of existing AUDs among various populations (Piccinelli et al., 1997; Volk et al., 1997).
Treatment
Dichotomous data on current treatment for drug or alcohol problems were obtained at each follow-up interview and included formal and informal treatment modalities.
Analyses
Data preparation
The reported quantity and frequency scores of drinking for each LDH phase were multiplied to obtain a quantity-frequency (QF) score as a measure of average alcoholic drinks per month. The QF scores for the different phases were converted into a person-year format, which spanned ages 12 to 86. Ninety-one cases were omitted from analyses due to a substantial amount of missing data on quantity and/or frequency of drinking. After converting QF scores into person-year format, individual years were collapsed into 11 age categories consistent with those used in our prior studies on the course of drinking: ages 12–20, 21–23, 24–26, 27–29, 30–32, 33–35, 36–38, 39–41, 42–44, 45–47, and 48–50 (see Jacob et al., 2005, 2009, 2010, 2011). The QF score within each category was dichotomized into a heavy-drinking/non-heavy-drinking variable, with heavy-drinking (HD) defined as 60 or more alcoholic drinks per month (Jacob et al., 2011; Stahre et al., 2006). From person-year data, age of first drink and age of first HD year were also computed.
Latent Growth Mixture Modeling (LGMM)
The course of HD over time was examined using LGMM (Muthén and Muthén, 2000). The LGMM approach identifies common patterns of growth (i.e., latent trajectories) based on a measurement of a variable over multiple time points (i.e., age categories) (Jacob et al., 2005; Jacob et al., 2009; Jacob et al., 2010; Jacob et al., 2011). LGMM allows the variability of latent classes (estimated in the form of intercepts and slopes) to be modeled as random (as opposed to fixed) effects. Included in the analyses were cases that had at least one age category with an HD diagnosis (n=1301; 42% of total cases). Growth mixture models specifying one, two, three, and four latent classes were fit to the categorical data using Mplus Version 5.2 (Muthén and Muthén, 1998–2008). Estimation of the degree of risk for HD was evaluated by specifying probit thresholds that were set to be equal across the age categories, with linear slope values (estimates of growth over time) set to the midpoint of each category. The mean slope factor for all classes was freely estimated, and model estimation was based on the maximum likelihood ratio estimator. Adjudication of the “best-fitting” model was based on review of the following fit indices: Akaike Information Criterion (AIC=−2LL+2r), Bayesian Information Criterion (BIC=−2LL=r*ln(n), and sample-size adjusted BIC (−2LL=r*ln((n=2)/24). We also used the Vuong-Lo-Mendell Rubin test to assess the improvement in fit with successive increases in the number of classes. Finally, entropy was used to evaluate the quality of classification with values ≥ .80 interpreted as “good” delineation among the identified classes (Celeux and Soromenho, 1996).
Analyses based on class membership
Results from the LGMM yielded several estimates of class characteristics including “class membership probabilities.” These probabilities were used to assign individuals to a latent HD trajectory groups based on their highest probability of class membership. Two additional models were run to examine the effects of HIV+ status (n=644) or non-HIV control status (n=657) on probability of class membership.
Class characteristics
Linear (ANOVA) and likelihood ratio (chi-square) analyses were conducted using PASW 18.0 to determine if the trajectory groups differed significantly with respect to various covariates. Post-hoc Tukey tests were used to account for multiple comparisons in the linear analyses; post-hoc logistic regressions were conducted on chi-square analyses. Covariate analyses were conducted on the total HD sample, as there were no significant differences noted between the HIV+ and non-HIV subgroups among the alcohol trajectories. Follow-up variables used as covariates were first averaged across 1 to 5 follow-up assessments for each participant given the variability in participation rate from year to year.
Results
Lifetime prevalence of HD in the total sample and by clinic subsample
Of the 3118 veterans who participated in the VACS telephone interview, 1301(42%) reported a period of HD at some point in their lifetime (“total HD sample”). The proportions of heavy drinkers in the HIV+ (42.7%, n=644) and non-HIV subsamples (40.8%, n=657) were not significantly different from one another; χ2 (2) = 1.47, p = .480.
Latent growth mixture models of HD over time for the total HD sample and by clinic subsample
For the total HD sample, results of the LGMM analyses on the course of HD over time suggested a four-group solution based on various fit indices (AIC=12696.07, BIC=12752.95, adjusted BIC=12718.01) and classification quality (entropy=.87). Moreover, the results of the Vuong-Lo-Mendell-Rubin tests indicated that a four-class solution provided a significant improvement in fit over a three-class solution (likelihood ratio test [LRT] = 533.98, p<.01). Figure 1 (Panel A) depicts the probability of HD over time for each of the latent trajectories estimated from the four-group solution. The shapes of the HD trajectories in this sample were similar to the shapes of the AD and HD trajectories derived in our prior studies using participants from the VETR and VES (see Jacob et al., 2005, 2009, 2010, 2011). Per the class designations from our prior studies, we defined the first HD class as severe chronic (SC; n=293, 22.5% of total HD sample), which was characterized by a high probability of HD in early adulthood that remained relatively high until midlife, and then decreasing in the mid-40s. The second class, defined as severe non-chronic (SNC; n=260, 20.0%), was characterized by a high probability of HD in early adulthood that persisted until the mid-30s, followed by a sharp decline thereafter, reaching near-zero probability of HD in the early 40s. The third class represented a young adult (YA) group (n=340, 26.1%) that was characterized by a high probability of HD in the early 20s and a rapid decline thereafter, reaching near-zero probability of HD beginning in the early 30s. The fourth class was defined by a late onset (LO) pattern (n=408, 31.4%) with a relatively low probability of HD in early adulthood and a gradually increasing probability thereafter and into midlife.
Figure 1.
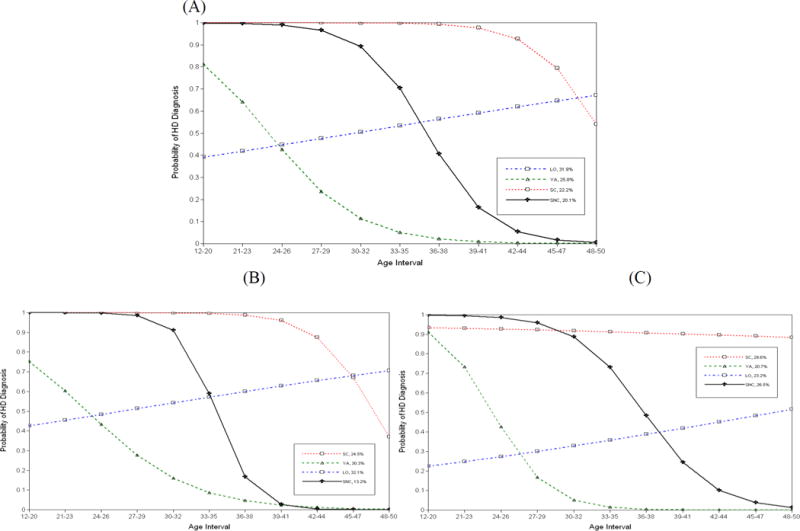
Probability of heavy drinking (HD) over time by latent trajectories
A four-group solution was also indicated in separate LGMM analyses for the HIV+ (AIC=6994.94, BIC=7045.11, adjusted BIC=7010.19, entropy=.89) and non-HIV clinic subsamples (AIC=6227.55, BIC=6276.92, adjusted BIC=6241.99, entropy=.86). For both subsamples, the results of the Vuong-Lo-Mendell-Rubin tests indicated that a four-class solution provided a significantly better fit over a three-class solution (LRTHIV+ = 274.25, p<.05; LRTnon-HIV = 352.49, p<.01). The probabilities of HD over time for each of the latent trajectories in the HIV+ and non-HIV subsamples are shown in Figure 1 (Panels B and C, respectively). Inspection of Table 1 indicates that there were higher proportions of SC and SNC cases in the non-HIV vs. HIV subsamples. However, subsequent chi-square analyses regarding the percentage of individuals classified in each of the four latent HD classes as a function of clinic subsample only reached trend-level significance; hence, it appears that the clinic subsamples were more similar than different in their distribution of HD trajectories over time.
Table 1.
Percentage of Individuals from Each Clinic Subsample (HIV+, Non-HIV) from the Total Heavy Drinking (HD) Sample and by Latent HD Class
| Latent HD class (%)
|
|||||
|---|---|---|---|---|---|
| Clinic subsample | Total HD sample (%) | SC | SNC | LO | YA |
| HIV+ | 49.4 | 47.8 | 43.5 | 51.5 | 53.2 |
| Non-HIV | 50.6 | 52.2 | 56.5 | 48.5 | 46.8 |
SC, severe chronic; SNC, severe nonchronic; LO, late onset; YA, young adult.
Chi-square tests suggested no relationship between clinic subsample and latent HD class; χ2(3) = 6.67, ρ = 0.083.
Correlates of class membership for the total HD sample
Six sets of covariates (i.e., demographics, nicotine use, cocaine use, depression, drinking patterns and problems, events associated with first phase of HD) were analyzed to test for differences across the HD classes. Descriptive statistics along with F and χ2 statistics and significance levels are presented in Tables 2 and 3. Results of the covariate analyses were comparable when performed separately for each of the subsamples. In the following analyses, the combined sample was used.
Table 2.
Descriptive Statistics (Percentages or Means/SDs) for Demographics, Nicotine and Cocaine Use, Depression, and Drinking Patterns and Problems for the Total Sample of Heavy Drinkers and by Latent Heavy Drinking (HD) Class
| Latent HD class
|
|||||||
|---|---|---|---|---|---|---|---|
| Variable | Total HD sample | SC | SNC | LO | YA | F or χ2 | P |
| Demographics | |||||||
| Age at time of assessment | 49.4 (7.9) | 50.9 (7.2)c | 48.9 (7.1)b | 50.6(7.8)c | 47.3 (8.4)a | 15.5 | <0.001 |
| African American (%) | 61.3 | 64.8 | 60.0 | 65.4* | 54.4** | 17.7 | 0.038 |
| Married at time of assessment (%) | 22.8 | 20.5 | 25.7 | 21.4 | 24.2 | 17.2 | 0.309 |
| Income level | 2.6 (1.2) | 2.3(1.1)a | 2.8 (1.3)b,c | 2.6 (1.2)b | 2.8 (1.3)c | 11.4 | <0.001 |
| Educational level | 4.5 (0.9) | 4.3 (1.0)a | 4.5 (0.9)a,b | 4.6 (1.0)b | 4.7 (0.8)b | 8.6 | <0.001 |
| Nicotine use | |||||||
| Number of years smoking | 25.5(11.7) | 28.1 (11.6)b | 24.2(12.2)a | 25.8(10.9)a, b | 23.7(11.9)a | 7.3 | <0.001 |
| Current use (%) | 56.2 | 60.1 | 53.7 | 59.5 | 50.9** | 8.1 | 0.044 |
| Cocaine use | |||||||
| Ever used (%) | 64.1 | 68.7 | 68.1 | 65.3 | 56.0*** | 14.3 | 0.003 |
| Current use (%) | 22.3 | 30.2*** | 21.5 | 21.8 | 17.0** | 15.9 | 0.001 |
| Frequency of use (past year) | 1.2 (1.5) | 1.5 (1.7)b | 1.3 (1.5)a,b | 1.2 (1.5)a,b | 1.0 (1.3)a | 6.5 | <0.001 |
| Depression | |||||||
| BDI score (of 7) | 3.2 (3.8) | 3.8 (4.2)a | 3.3 (3.8)a,b | 3.0 (3.8)a,b | 2.8 (3.3)b | 3.7 | 0.011 |
| BDI cutoff for depression (%) | 35.7 | 42.2** | 36.2 | 33.4 | 32.6 | 7.5 | 0.06 |
| Drinking patterns and problems | |||||||
| Drinking frequency | 2.2 (1.5) | 2.4 (1.6)c | 2.1 (1.5)a,b | 2.4 (1.5)b,c | 1.8 (1.4)a | 11.2 | <0.001 |
| Frequency of binge drinking | 1.6 (1.6) | 2.2 (1.6)c | 1.5 (1.5)a | 1.7(1.5)a | 1.1 (1.3)b | 30.0 | <0.001 |
| Others concerned overdrinking (%) | 19.4 | 27.9*** | 12.0** | 26.1*** | 9.8*** | 52.1 | <0.001 |
| Trouble cutting down on drinking (%) | 43.2 | 60.6*** | 40.7 | 49.7** | 22.6*** | 100.0 | <0.001 |
| Trouble controlling drinking (%) | 38.1 | 49.6*** | 41.2 | 40.5 | 23.2*** | 49.2 | <0.001 |
| Age at first drink (years) | 17.2 (4.0) | 16.8 (4.3)a | 16.9 (3.8)a,b | 17.7 (4.3)b | 17.1 (3.2)a,b | 3.4 | 0.018 |
| Age of first HD episode (years) | 21.8 (6.8) | 18.4 (3.5)a | 18.5 (3.1)a | 28.0(8.0)b | 20.0 (4.2)c | 261.3 | <0.001 |
SC, severe chronic; SNC, severe nonchronic; LO, late onset; YA, young adult; BDI, Beck Depression Inventory.
Means with different superscripts are significantly different from one another and are based on post hoc Tukey’s tests (for continuous variables). Categorical covariate significance levels are denoted with asterisks (*p < 0.05, **p < 0.01, ***p < 0.001) and were based on post hoc logistic regressions—that is, the categorical covariates were regressed onto each of the HD class designations. Results are based on the combined sample of HIV+ and non-HIV controls.
Table 3.
Descriptive Statistics (Percentages) of Significant Events Associated with First Phase of Heavy Drinking (HD) for the Total Sample of HD and by Latent HD Class
| Latent HD class (%)
|
|||||||
|---|---|---|---|---|---|---|---|
| Events | Total HD sample (%) | SC | SNC | LO | YA | χ2 | p |
| Marital/family | 9.1 | 8.2 | 7.7 | 13.2*** | 5.9* | 13.6 | 0.003 |
| Work | 6.5 | 1.4*** | 4.6 | 13.7*** | 3.8* | 53.0 | <0.001 |
| School | 4.5 | 4.1 | 5.0 | 4.2 | 4.7 | 0.4 | 0.942 |
| Military | 54.9 | 50.5 | 55.4 | 50.2* | 63.8*** | 16.8 | 0.001 |
| Medical | 2.5 | 0 | 0.4* | 6.1*** | 2.1 | 34.1 | <0.001 |
| Residence | 3.5 | 2.0 | 1.5 | 4.4 | 5.3* | 8.9 | 0.030 |
| Legal | 0.2 | 0 | 0 | 0.5 | 0 | 4.4 | 0223 |
| Financial | 0.6 | 0 | 0.8 | 1.5* | 0 | 8.9 | 0.031 |
| Legal drinking age | 2.1 | 0.7 | 0.8 | 3.2 | 2.9 | 8.7 | 0.033 |
| Peer group | 38.1 | 42.3 | 44.2* | 30.6*** | 38.8 | 16.1 | 0.001 |
SC, severe chronic; SNC, severe nonchronic; LO, late onset; YA, young adult.
Covariate significance levels (*p< 0.05, **p< 0.01, ***p < 0.001) were based on post hoc logistic regressions—that is, the categorical covariates were regressed onto each of the HD class designations.
Demographics
There were significant differences in age at time of assessment (YA heavy drinkers significantly younger than those from other classes at time of assessment); race (YA heavy drinkers had the lowest percentage of African-Americans); income level (SC heavy drinkers had significantly lower income than those from the LO and YA classes); and education level (SC heavy drinkers had significantly fewer years of education than those from the LO and YA classes).
Nicotine and cocaine use
SC heavy drinkers reported significantly more years smoking and contained a larger percentage of current smokers compared with the other classes. Similarly, SC heavy drinkers had the highest percentage of lifetime and current use of cocaine, and reported a significantly greater frequency of use in the past year than YA heavy drinkers.
Depression
YA heavy drinkers exhibited significantly lower Beck Depression Inventory (BDI) scores than SC heavy drinkers, as well as a trend for lower rates of depression, per the recommended cut-off of that screening measure (Beck et al., 1997).
Drinking patterns
SC and LO heavy drinkers reported a significantly greater frequency of drinking than YA heavy drinkers. SC heavy drinkers reported a greater frequency of binge drinking (i.e., 6 or more drinks per occasion) and had a substantially larger percentage of individuals exhibiting symptoms related to problematic drinking (i.e., others concerned over drinking, trouble cutting down on drinking, trouble controlling drinking) than all other classes. SC heavy drinkers reported a significantly younger age of first drink compared with LO heavy drinkers, and SC and SNC heavy drinkers reported a significantly younger age of first HD episode compared with LO and YA heavy drinkers.
Events associated with the first phase of HD
Significant differences emerged across the classes for most events that were reported to be associated with the first phase of HD. LO heavy drinkers reported the highest rates of marital/family, work, medical, and financial issues as corresponding to their first episode of HD. LO and YA heavy drinkers reported the highest rates of changes in residence, and YA heavy drinkers reported the highest rates associated with entering the military. SC and SNC heavy drinkers reported the highest rates of peer group influences associated with their first HD phase.
Correlates of class membership for HIV+ subgroup
Table 4 shows reported changes in drinking among HIV+ participants after they were notified of their HIV-positive status: decreased, increased, drinking the same, and started drinking. There were no cross trajectory differences for reports of decreased drinking, drinking the same, or started drinking. However, significantly higher percentages of SC and LO heavy drinkers (compared with SNC and YA drinkers) reported increased drinking after they were notified of their HIV status.
Table 4.
Descriptive Statistics (Percentages) for Changes in Drinking Amounts at HIV+ Status Awareness for the Sample Source of HIV+ Heavy Drinkers and by Latent Heavy Drinking (HD) Class
| Latent HD class (%)
|
|||||||
|---|---|---|---|---|---|---|---|
| Change in alcohol use when HIV+ status known | HIV+ Heavy drinkers (%) | SC | SNC | LO | YA | χ2 | p |
| Decreased amount | 46.7 | 42.9 | 49.6 | 42.9 | 52.5 | 4.9 | 0.181 |
| Increased amount | 18.6 | 24.3* | 13.3 | 23.3* | 12.2** | 13.2 | 0.004 |
| No change in amount | 22.8 | 20.7 | 21.2 | 23.8 | 24.3 | 0.9 | 0.836 |
| Started drinking | 2.6 | 2.9 | 5.3 | 1.9 | 1.7 | 4.3 | 0.233 |
SC, severe chronic; SNC, severe nonchronic; LO, late onset; YA, young adult.
Results are based only on the sample source of HIV+. Covariate significance levels (*p < 0.05, **p < 0.01, ***p < 0.001) were based on post hoc logistic regressions—that is, the categorical covariates were regressed onto each of the HD class designations.
Prospective follow-up variables over five years subsequent to baseline assessment
Of the heavy drinkers who participated in the baseline LDH study, 88% (n=1150) also participated in at least one annual follow-up interview: 13% participated in one interview, 16% in two interviews, 20% in three interviews, 29% in four interviews, and 22% in all five interviews. For the variables selected, each participant was assigned an average score based on data obtained from 1 to 5 interviews. As shown in Table 5, SC heavy drinkers received significantly more treatment for drug and alcohol problems at some point during the 5 year period subsequent to the baseline administration of the LDH. On average, SC heavy drinkers also scored significantly higher on the AUDIT screen than the other classes, whereas YA and SNC heavy drinkers scored significantly lower on the AUDIT during that same 5-year period.
Table 5.
Descrptive Statistics (Percentages or Means/SDs) for Prospective Follow-Up Variables Over 5 Years for the Total Sample of Heavy Drinkers Who Participated in Follow-Up Interviews (n = 1,150) and by Latent Heavy Drinking (HD) Class
| Latent HD class (%)
|
|||||||
|---|---|---|---|---|---|---|---|
| Variable | Total follow-up HD sample (%) | SC | SNC | LO | YA | F or χ2 | p |
| Received treatment for alcohol and/or drugs | 36.1 | 42.6* | 37.8 | 37.3 | 27.9*** | 14.1 | 0.003 |
| Average AUDIT score | 4.7 (6.0) | 6.6 (7.4)c | 3.5 (5.0)a | 5.3 (6.5)b | 3.3 (3.8)a | 18.9 | <0.001 |
SC, severe chronic; SNC, severe nonchronic; LO, late onset; YA, young adult; AUDIT, Alcohol Use Disorders Identification Test.
Means with different superscripts are significantly different from one another and are based on post hoc Tukey’s tests (for continuous variables).
Categorical covariate significance levels are denoted with asterisks (*p < 0.05, **p < 0.01, ***p < 0.001) and were based on post hoc logistic regressions—that is, the categorical covariates were regressed onto each of the HD class designations. Results are based on the combined sample of HIV+ and non-HIV controls.
Discussion
The investigators’ previous work identified four life-course drinking trajectories that have been replicated across twin and nontwin samples, and across consumption and diagnostic measures. The aim of the current study was to assess the generalizability of these four trajectories based on a sample of midlife drinkers with quite different characteristics than previously studied; namely, a sample of midlife veterans in treatment for HIV or for a non-HIV medical disorder. As described, the emergent trajectories were very similar to those found with our earlier studies. For researchers and clinicians involved in the study and treatment of HIV, these findings might be surprising given what appears to be a set of medical and treatment circumstances that have the potential to significantly impact and/or be impacted by the course of problem drinking. The implications of these findings for understanding the relationship between HIV and problem drinking and the major differences in drinking patterns regardless of accompanying medical disorder merits further discussion.
The four trajectory typology: Replications and extensions of past research
The cross trajectory differences identified in the current study were consistent with those found in our earlier studies (Jacob et al., 2005, 2009, 2010, 2011). Most importantly, the SC group more often included those who engaged in HD during their adolescent years and who continued to drink significant amounts of alcohol throughout the next three decades. In the larger alcoholism literature, these drinkers (referred to as “antisocial alcoholics”) are described as exhibiting more severe expressions of the disorder, often associated with comorbid psychiatric disorders and with aggressive, externalizing personality features (Babor et al., 1992b; Jacob et al., 2009; Moss et al., 2007; Zucker, 1994). Consistent with this characterization, the SC group in the current study had the highest proportion of smokers, the greatest severity of cocaine use, the highest scores on drinking frequency, maximum number of drinks consumed in one sitting, frequency of drinking 6 or more drinks, current levels of depression, and lowest income and education levels. Further, SC heavy drinkers (compared with those in the other trajectories) more often failed to cut down on drinking, were unable to stop drinking after 1 or 2 drinks, and had a relative or friend concerned about their drinking. In contrast, the YA group (often referred to as “developmentally limited” alcoholics), was characterized by heavy and problematic drinking during late adolescence and early adulthood which declined thereafter. This group had the highest rates of marriage, the highest income and education levels, the smallest proportion of current and lifetime smokers and of current and lifetime cocaine users, the lowest scores on drinking frequency and drinking more than 6 drinks in one sitting, and the lowest levels of depression. Further, and again consistent with our previous findings and the larger alcoholism literature, the YA heavy drinkers were least likely to have a relative or friend concerned about their drinking and least likely to have failed in attempts to cut down on drinking. Finally, it is noteworthy that the current study included a prospective data collection component involving five yearly follow-up assessments subsequent to the baseline interview. As seen, the primary characteristics of the various trajectory types (especially the SC and YA groups) derived from our previous, retrospectively based assessments and from the larger typology literature were found to remain stable in the five years subsequent to initial assessment.
Distribution of cases across the four trajectories for the HIV+ and non-HIV groups
Although the shape and number of drinking trajectories identified were similar to those found in our previous studies (as were the variables that differentiated the trajectories), the distribution of these four patterns could still have differed across the HIV+ and non-HIV groups. If so, such differences may provide some insight into the impact of problem drinking on the course of HIV and the course of HIV on problem drinking. Our results revealed a higher proportion of LO and YA heavy drinkers and a lower proportion of SC and SNC heavy drinkers in the HIV+ vs. non-HIV group, differences that suggest possibilities for understanding how HIV and problem drinking are related over time. For example, to minimize the effects of alcohol on the course and treatment of the disease, a number of those first diagnosed with HIV during their early adult years might have decreased their drinking at that time rather than continue on a course of problem drinking. Hence, more of these patients would have been classified as YA heavy drinkers. Alternatively, if such patients relapsed at some point and began to engage in problem drinking in the next two decades, they may have been classified as LO heavy drinkers.
Although possible, such interpretations are speculative: (i) these findings may simply be sampling error given that the differences between the two groups only reached trend-level significance; (ii) one would need more information about the timing of the HIV diagnosis to make stronger statements about effects – e.g., age when HIV was first diagnosed and age when treatment first began; (iii) the HIV+ and non-HIV groups did not differ substantially with regard to the proportion of patients with a history of HD (approximately 50% in each group) and the correlates of the drinking trajectories, suggesting that the characteristics that distinguish different alcoholism subtypes are largely the same regardless of the drinker’s lifetime HIV status. Consistent with this interpretation, both clinic groups were drawn from the same cohort (mainly Vietnam era veterans) and both groups contained large proportions of lower-income/lower-educated patients with compromised social-emotional-medical functioning (Justice et al., 2001, 2006). Such demographics (age and SES) have been found to be important determinants of various drinking and psychosocial characteristics in the larger AUD literature (Dewitt et al., 2000; Gilman et al., 2008; Rehm et al., 2008).
Limitations and future directions
The dataset available for current analyses did not contain precise information regarding date of HIV diagnosis. Consequently, when patients indicated (upon admission to the treatment program) that their drinking increased, decreased, remained the same, or started after they first received a diagnosis of HIV (Table 4), the investigator did not know at what time this occurred. Similarly, the dataset did not have precise information about the temporal relationships between drinking and treatment processes and outcomes once treatment began. Notwithstanding these limitations, this study is the first to examine lifetime drinking patterns among those treated for HIV and provides an excellent starting point for examining finer-grained relationships involving drinking, onset of HIV, and treatment outcomes.
Acknowledgments
Disclaimer: This research was supported by the Veterans Administration Merit Award and the National Institute on Alcohol Abuse and Alcoholism Grant (R01-AA016402) awarded to Theodore Jacob. Daniel M. Blonigen was supported by a Career Development Award–2 from the Department of Veterans Affairs Office of Research and Development (Clinical Sciences Research & Development). Veterans Aging Cohort Study was funded by the National Institute on Alcohol Abuse and Alcoholism (U10 AA 13566). The views expressed in this article are those of the authors and do not necessarily reflect the position or policy of the Department of Veterans Affairs.
Contributor Information
Theodore Jacob, Family Research Center, Veterans Affairs Palo Alto Health Care System
Daniel M. Blonigen, Center for Health Care Evaluation, Veterans Affairs Palo Alto Health Care System
Roxanne Upah, Palo Alto University
Amy Justice, VA Connecticut Healthcare System
References
- Babor T, de la Fuente J, Saunders J, Grant M. AUDIT - The Alcohol Use Disorders Identification Test: Guidelines for use in primary health care. Geneva: World Health Organization; 1992a. [Google Scholar]
- Babor T, Hofmann M, DelBoca FK, Hesselbrock V, Meyer RE, Dolinsky ZS, Rounsaville B. Types of alcoholics I: Evidence for an empirically derived typology based on indicators of vulnerability and severity. Archives of General Psychiatry. 1992b;49:599–608. doi: 10.1001/archpsyc.1992.01820080007002. [DOI] [PubMed] [Google Scholar]
- Beck A, Guth D, Steer R, Ball R. Screening for major depression disorders in medical inpatients with the Beck Depression Inventory for Primary Care. Behavior Research and Therapy. 1997;35:785–791. doi: 10.1016/s0005-7967(97)00025-9. [DOI] [PubMed] [Google Scholar]
- Bohn M, Babor T, Kranzler H. Validity of the Drug Abuse Screening Test (DAST-10) in inpatient substance abusers [Monograph] Problems of Drug Dependence. 1991;119:233–235. [Google Scholar]
- Braithwaite R, McGinnis K, Conigliaro J, Maisto S, Crystal S, Day N, Cook R, Gordon AS, Bridges M, Seller J, Justice AC. A temporal and dose-response association between alcohol consumption and medication adherence among veterans in care. Alcoholism: Clinical & Experimental Research. 2005;29:1190–1197. doi: 10.1097/01.alc.0000171937.87731.28. [DOI] [PubMed] [Google Scholar]
- Celeux G, Soromenho G. An entropy criterion for assessing the number of clusters in a mixture model. Journal of Classification. 1996;13:195–212. [Google Scholar]
- Centers for Disease Control and Prevention 2008. HIV/AIDS Surveillance Report. Atlanta: Centers for Disease Control and Prevention; 2006. [Google Scholar]
- Dewitt D, Adlaf E, Offord D, Ogborne A. Age at first alcohol use: A risk factor for the development of alcohol disorders. American Journal of Psychiatry. 2000;157:745–750. doi: 10.1176/appi.ajp.157.5.745. [DOI] [PubMed] [Google Scholar]
- Eisen S, True W, Goldberg J, Henderson W, Robinette CD. The Vietnam Era Twin (VET) Registry: Method of construction. Acta Geneticae Medicae et Gemellologiae. 1987;36:61–67. doi: 10.1017/s0001566000004591. [DOI] [PubMed] [Google Scholar]
- Friis-Moller N, Weber R, Reiss P, Thiebaut R, Kirk O, Monforte A, Pradier C, Morfeldt L, Mateu S, Law M, El-Sadr W, De Wit S, Sabin C, Phillips A, Lundgren J. Cardiovascular disease risk factors in HIV patients-association with antiretroviral therapy: Results from the DAD study. AIDS. 2003;17:1179–1193. doi: 10.1097/01.aids.0000060358.78202.c1. [DOI] [PubMed] [Google Scholar]
- Gavin D, Ross H, Skinner H. Diagnostic validity of the drug abuse screening test in the assessment of DSM-III drug disorders. British Journal of Addiction. 1989;84:301–307. doi: 10.1111/j.1360-0443.1989.tb03463.x. [DOI] [PubMed] [Google Scholar]
- Gilman S, Breslau J, Conron K, Koenen K, Subramanian S, Zaslavsky A. Education and race-ethnicity differences in the lifetime risk of alcohol dependence. Journal of Epidemiology and Community Health. 2008;62:224–230. doi: 10.1136/jech.2006.059022. [DOI] [PMC free article] [PubMed] [Google Scholar]
- Gladsjo JA, Tucker JA, Hawkins JL, Vuchinich RE. Adequacy of recall of drinking patterns and event occurrences associated with natural recovery from alcohol problems. Addictive Behaviors. 1992;17:347–358. doi: 10.1016/0306-4603(92)90040-3. [DOI] [PubMed] [Google Scholar]
- Grant BF, Dawson DA, Stinson FS, Chou PS, Dufour MC, Pickering RP. The 12-month prevalence and trends in DSM-IV alcohol abuse and dependence: United States, 1991–1992 and 2001–2002. Bethesda: Health, Ara; 2006. [DOI] [PubMed] [Google Scholar]
- Happel K, Nelson S. Alcohol, immunosuppression, and the lung. Proceedings of the American Thoracic Society. 2005;2:428–432. doi: 10.1513/pats.200507-065JS. [DOI] [PubMed] [Google Scholar]
- Hays RD, Merz J, Nicholas R. Response burden, reliability, and validity of the CAGE, short MAST, and AUDIT alcohol screening measures. Behavioral Research Methods, Instruments, and Computers. 1995;27:277–280. [Google Scholar]
- Hinkin C, Hardy D, Mason K, Castellon S, Durvasula R, Lam M, Stefaniak M. Medication adherence in HIV-infected adults: effect of patient age, cognitive status, and substance abuse. AIDS. 2004;18:S19–S25. doi: 10.1097/00002030-200418001-00004. [DOI] [PMC free article] [PubMed] [Google Scholar]
- Jacob T, Blonigen D, Koenig L, Wachsmuth W, Price R. Course of alcohol dependence among Vietnam combat veterans and non-veteran controls. Journal of Studies on Alcohol and Drugs. 2010;71:629–639. doi: 10.15288/jsad.2010.71.629. [DOI] [PMC free article] [PubMed] [Google Scholar]
- Jacob T, Blonigen DM, Hubel K, Wood PK, Haber JR. Drinking course through midlife based on diagnostic versus quantity-frequency indices. Alcoholism: Clinical & Experimental Research Epub. 2011:1–13. doi: 10.1111/j.1530-0277.2011.01619.x. [DOI] [PMC free article] [PubMed] [Google Scholar]
- Jacob T, Bucholz K, Sartor CE, Howell DN, Wood PK. Drinking trajectories from adolescence to the mid-forties among alcohol dependent males. Journal of Studies in Alcohol. 2005;66:745–755. doi: 10.15288/jsa.2005.66.745. [DOI] [PubMed] [Google Scholar]
- Jacob T, Koenig LB, Howell DN, Wood PK, Haber JR. Drinking trajectories from adolescence to the fifties among alcohol-dependent men. Journal of Studies on Alcohol and Drugs. 2009;70:859–869. doi: 10.15288/jsad.2009.70.859. [DOI] [PMC free article] [PubMed] [Google Scholar]
- Jacob T, Seilhamer R, Bargiel K, Howell DN. Reliability of lifetime drinking history among alcohol dependent men. Psychology of Addictive Behaviors. 2006;20:333–337. doi: 10.1037/0893-164X.20.3.333. [DOI] [PubMed] [Google Scholar]
- Justice AC, Dombrowski E, Conigliaro J, Fultz SL, Gibson D, Madenwald T, Goulet J, Simberkoff M, Butt AA, Rimland D, Rodriguez-Barradas MC, Gilbert CL, Oursler KA, Brown S, Leaf DA, Goetz MB, Bryant K. Veterans aging cohort study (VACS): Overview and description. Medical Care. 2006;44:S13–24. doi: 10.1097/01.mlr.0000223741.02074.66. [DOI] [PMC free article] [PubMed] [Google Scholar]
- Koenig LB, Jacob T, Haber JR. Validity of the Lifetime Drinking History: A comparison of retrospective and prospective quantity-frequency measures. Journal of Studies on Alcohol and Drugs. 2009;70:296–303. doi: 10.15288/jsad.2009.70.296. [DOI] [PMC free article] [PubMed] [Google Scholar]
- Lemmens PH, Volovics L, De Haan Y. Measurement of lifetime exposure to alcohol: Data quality of self-administered questionnaire and impact on risk assessment. Contemporary Drug Problems. 1997;24:581–600. [Google Scholar]
- McCann B, Simpson T, Ries R, Roy-Byrne P. Reliability and validity of screening instruments for drug and alcohol abuse in adults seeking evaluation for attention deficit/hyperactivity disorder. The American Journal on Addictions. 2000;9:1–9. doi: 10.1080/10550490050172173. [DOI] [PubMed] [Google Scholar]
- McComsey G, Tebas P, Shane E, Yin M, Overton E, Huang J, Aldrovandi G, Cardoso S, Santana J, Brown T. Bone disease in HIV infection: a practical review and recommendations for HIV care providers. Clinical Infectious Diseases. 2010;51:937–946. doi: 10.1086/656412. [DOI] [PMC free article] [PubMed] [Google Scholar]
- Moss H, Chen C, Yi H. Subtypes of alcohol dependence in a nationally representative sample. Drug and Alcohol Dependence. 2007;91:149–158. doi: 10.1016/j.drugalcdep.2007.05.016. [DOI] [PMC free article] [PubMed] [Google Scholar]
- Muthén B, Muthén L. Integrating person-centered and variable-centered analyses: Growth mixture modeling with latent trajectory classes. Alcoholism: Clinical and Experimental Research. 2000;24:882–891. [PubMed] [Google Scholar]
- Mplus [computer program] Los Angeles, CA: Muthén and Muthén; 1998–2008. [Google Scholar]
- Office of Quality and Performance VHA. Executive Report. Washington, DC: 2000. Health status and outcomes of veterans: Physical and mental component summary scores, Veterans SF-36, 1999 National VHA Health Survey of Veteran Enrollees. [Google Scholar]
- Piccinelli M, Tessari E, Bortolomasi M, Piasere O, Semenzin M, Garzotto N, Tansella M. Efficacy of the alcohol use disorders identification test as a screening tool for hazardous alcohol intake and related disorders in primary care: a validity study. British Medical Journal. 1997;314:420–424. doi: 10.1136/bmj.314.7078.420. [DOI] [PMC free article] [PubMed] [Google Scholar]
- Rehm J, Irving H, Ye Y, Kerr W, Bond J, Greenfield T. Are lifetime abstainers the best control group in alcohol epidemiology? On the stability and validity of reported lifetime abstention. American Journal of Epidemiology. 2008;168:866–871. doi: 10.1093/aje/kwn093. [DOI] [PMC free article] [PubMed] [Google Scholar]
- Simbayi L, Kalichman S, Jooste S, Mathiti V, Cain D, Cherry C. Alcohol use and sexual risks for HIV infection among men and women receiving sexually transmitted infection clinic services in Cape Town, South Africa. Journal of Studies on Alcohol. 2004;65:434–442. doi: 10.15288/jsa.2004.65.434. [DOI] [PubMed] [Google Scholar]
- Skinner H. The drug abuse screening test. Addictive Behaviors. 1982;1:363–371. doi: 10.1016/0306-4603(82)90005-3. [DOI] [PubMed] [Google Scholar]
- Skinner H, Goldberg A. Evidence for a drug dependence syndrome among narcotic users. British Journal of Addictions. 1986;81:479–484. doi: 10.1111/j.1360-0443.1986.tb00359.x. [DOI] [PubMed] [Google Scholar]
- Skinner H, Horn J. Alcohol Dependence Scale (ADS): User’s Guide. Toronto: Addiction Research Foundation; 1984. [Google Scholar]
- Skinner H, Schuller R. Validation of the Lifetime Drinking History: Biochemical, medical history and psychosocial evidence. Toronto: Addiction Research Foundation; 1982. [Google Scholar]
- Skinner HH, Sheu WJ. Reliability of alcohol use indices: Lifetime drinking history and MAST. Journal of Studies on Alcohol. 1982;43:1157–1170. doi: 10.15288/jsa.1982.43.1157. [DOI] [PubMed] [Google Scholar]
- Sobell LC, Sobell MB, Riley DM, Schuller R, Pavan DS, Cancilla A, Klajner F, Leo GI. The reliability of alcohol abusers’ self-reports of drinking and life events that occurred in the distant past. Journal of Studies on Alcohol. 1988;49:225–232. doi: 10.15288/jsa.1988.49.225. [DOI] [PubMed] [Google Scholar]
- Stahre M, Naimi T, Brewer RHJ. Measuring average alcohol consumption: the impact of including binge drinks in quantity-frequency calculations. Addiction. 2006;101:1711–1718. doi: 10.1111/j.1360-0443.2006.01615.x. [DOI] [PubMed] [Google Scholar]
- Vittecoq D, Escaut L, Merad M, Teicher E, Monsuez J, Chironi G. Coronary heart disease in HIV-infected individuals. Advances in Cardiology. 2003;40:151–162. doi: 10.1159/000073181. [DOI] [PubMed] [Google Scholar]
- Volk R, Steinbauer J, Cantor S, Holzer C. The Alcohol Use Disorders Identification Test (AUDIT) as a screen for at-risk drinking in primary care patients of different racial/ethnic backgrounds. Addiction. 1997;92:197–206. [PubMed] [Google Scholar]
- Weber R, Sabin C, Friis-Moller N, El-Sadr W, Kirk O, Dabis F, Law M, Pradier C, De Wit S, Akerlund B, Calvo G, Nonforte A, Rickenbach M, Ledergerber B, Phillips A, Lundgren J. Liver-related deaths in persons infected with the human immunodeficiency virus: The DAD study. Archives of Internal Medicine. 2006;166:1632–1641. doi: 10.1001/archinte.166.15.1632. [DOI] [PubMed] [Google Scholar]
- Zucker RA. Pathways to alcohol problems and alcoholism: A developmental account of the evidence for multiple alcoholisms and for contextual contributions to risk. Washington, DC: 1994. [Google Scholar]