

SYNOPSIS
Pediatric obesity has reached critical proportions. Though this pandemic touches individuals from all socio-economic, racial and ethnic backgrounds, the trend is more prevalent among children from families of lower socio-economic classes. The causes of this separation in obesity rates by socio-economic background are multi-fold but include differences in the availability of healthier foods in homes and schools, as well as the availability of safe environments for physical activity. Equally concerning are increases in the diagnosis of type 2 diabetes among certain ethnic groups and discrepancies in health care availability to children of lower socio-economic backgrounds. As our society attempts to improve the lifestyle of our children and decrease rates of obesity, it will be important to give focus to children of lower socioeconomic backgrounds in planning these potential interventions.
Keywords: Obesity, diabetes, childhood, socio-economic disparities, physical activity, nutrition
INTRODUCTION
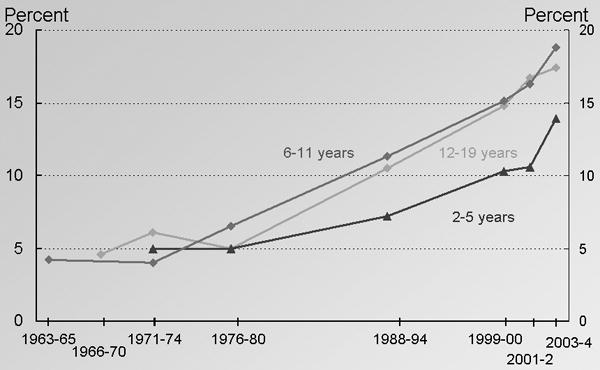
The pandemic of obesity in the United States has been well publicized through scientific investigation and media reports. Among children in the US aged 2- to 19-years-old, 32% are overweight or obese, with body mass indices (BMI) that are above the 85th percentile for age.1 This increase in obesity has led to an increase in co-morbidities such as hyperlipidemia,2, 3 high blood pressure,4, 5 glucose intolerance,6, 7 type 2 diabetes,8, 9 and evidence of fatty liver disease.10 If current trends hold out, the generation represented by children born since 2000 is estimated to have a 35% chance of developing diabetes and represents the first generation in the U.S. since the Civil War to have a life expectancy shorter than their parents.11 As seen in Figure 1, these changes in obesity have been relatively sudden—over the past 20 years—as detrimental changes in lifestyle have become more prevalent in our society. These changes have resulted in lives that have less physical activity and larger quantities of unhealthy foods than ever present previously.
Figure 1.
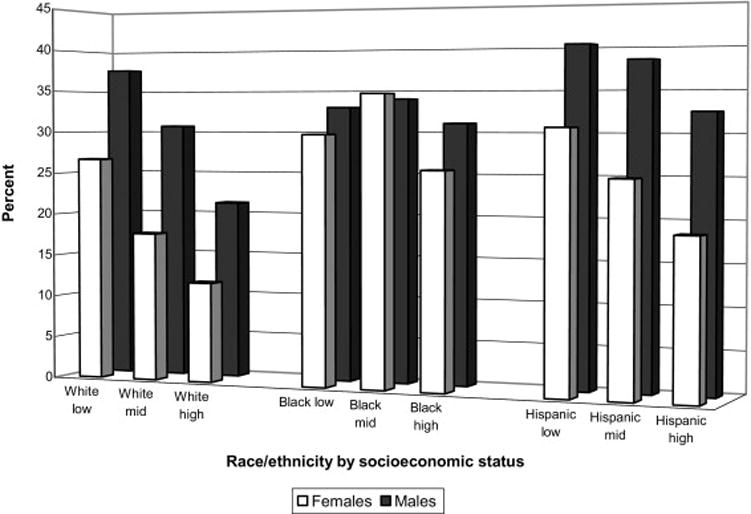
Thus far, our awareness of the problem in children has not helped to turn the tide to begin reversing these trends.1 Equally disturbing, however, is that in many respects, many of the lifestyle changes in our society that have fueled this epidemic have disproportionately affected children from lower socio-economic backgrounds. Many of these increases in obesity have also adversely affected certain racial/ethnic groups more than others. Based on data from the National Health and Nutrition Examination Survey (NHANES) (1976 – 2002), obesity rates for white, African American and Mexican American boys and girls (2- to 17- years-old) have all increased, but the highest rates were among Mexican American boys and African American girls. Further analyses based on socio-economic status (SES) of 2- to 19-year-old children from NHANES surveys found higher rates of obesity among all lower income children. This is seen in Figure 2 from a school survey of weight as related to SES level, and is further supported by multiple examples of specific societal differences outlined in this review.12, 13
Figure 2.
While many of these discrepancies in obesity have been studied specifically along measures of family income, parental education and other socio-economic lines, other clear socio-economic separations are more difficult to discern from the literature. The majority of studies reporting differences in obesity-related lifestyle issues have separated children into racial and ethnic groups (e.g., white, African American and Hispanic). Although this method of dividing groups of children does not necessarily reflect social or economic divisions, for the sake of this review, we will present the racial/ethnicity data alongside more reliable socio-economic data, acknowledging that the racial/ethnicity data may not completely represent socio-economic differences, but offers the best glimpse that we can obtain from the current literature.
As we will see, it is important to examine these socio-economic factors as they pertain to patterns of lifestyle, obesity and diabetes because as our society faces the need to re-create a more healthy lifestyle in our populations, we will need to be mindful to concentrate efforts on lower socio-economic groups that may have greater needs for change but less means to afford the associated costs. These costs are related to alterations in eating patterns and physical activity, each of which has contributed to worsened rates of childhood obesity and diabetes as well as to the widening differences between SES groups. We will additionally consider differences in the care for type 2 Diabetes, as well as targeted solutions to bridge these gaps.
I. Socio-economic discrepancies in nutrition
Shifts in the U.S. food-environment
A major root cause of the worsening rates of obesity in the United States relates to changes in the eating habits of Americans. The food-environment that children in the U.S. are exposed to changed dramatically during the twentieth century. This altered nutritional environment, coupled with decreased physical activity, contributed to a cumulative energy imbalance leading to a rise in adult and pediatric obesity. The differences in the food-environment in the U.S. today, as compared to the mid-twentieth century, are the result of fundamental changes in food characteristics such as quality, quantity and availability. Consistent with the theme of this paper, epidemiologic studies have demonstrated that the impact of these changes to the food-environment have been more significant for middle and lower SES families.
Alterations to food characteristics have included increased energy density,14 portion sizes,15 and variety,16 all of which have been shown in controlled studies to increase total energy intake at meals. The persistence of these modifications to the food-environment has been shown to override physiological regulatory systems and exert more long-term effects on human energy regulation than were previously estimated.17 Similarly consistent increases in energy intake have been effectively demonstrated in children that were given successively larger portions of food.17 This new food-environment, rich in a variety of processed foods (with added sugar and fat), followed by progressively larger portions, has allowed for an excessive and unbalanced intake of energy and nutrients.18 Although children of all ages, gender, race and SES are currently exposed to this new environment, there is a persistent gap in obesity rates between ethnic minorities and lower SES children and adolescents compared to their white or more affluent counterparts.19
Socio-economic differences in obesity rates
Geographically, the estimated prevalence of obesity in adults (≥ 20 years old) in 2006 ranged from 18.7% to 31.9% between states and as much as 9.8% to 36.9% between U.S. counties.20 The geographical distributions of adult and pediatric obesity suggest additional environmental influences on food intake such as the social and economical characteristics of different regions in the United States.21, 22 Furthermore, as the era of cheap, abundant and calorie-dense food emerged, obesity became clinically apparent nation-wide in men, women and children across all socioeconomic levels, but the degree of obesity was shown to vary by race, gender, income, education and location.
For adults (≥ 20 years old), the degree of obesity by race/ethnicity has been highest in African American women (53.9%) followed by Hispanic women (42.3%) and African American men (34%). In comparison, obesity rates for white women and men were 30.2 and 31.1%, respectively.23 Compared to males, females have shown consistently larger inverse associations with obesity and income since 1970, most notably in African American and white women.24 In a study of nearly 7000 U.S. citizens, statistically significant increases in obesity rates were shown in lower income (less than 130% of federal poverty line) and lower education households (less than high school).25
For adolescents, similar geographic disparities were recently described in a study sampling 46,707 children aged 10-17 across the U.S. and District of Columbia. For regional and state disparities the strongest association with adolescent obesity was found in household incomes below the poverty level.25 However, the association between family income and childhood obesity has been shown to vary by race, as income was positively associated with BMI in African American children and negatively associated with BMI in white children.26
Changes in food as a cause of worsening obesity
Multiple trends in food availability over the past 50 years have contributed to our current predicament. Prior to the 1970s, the food industry was already adapting to meet increasing demands for convenient foods by a post-World War II work force increasingly populated by working mothers and the subsequent rise of “two-income” families. Between 1960 and 2005, female labor force activity rose at every level of education, but participation rates differed according to race and income of the spouse (Figure 3). By 2005, 65% of married African American mothers worked compared to 58% of white, 51% Asian and 34% of Hispanic mothers. Overall, household income data show that work-force participation has been highest for working mothers whose husbands were in the middle earnings quintile. However, since 1997 participation rates for all white mothers fell by 4.5%, regardless of spouse income, while rates for African American mothers whose husbands were in the lowest quintile of earnings held steady.27 The assumption here is that nutritious meals at home take more time and money to purchase and prepare, and families with lower incomes and less time spent at home depend more on pre-cooked and convenient foods which are energy dense.
Figure 3.

Dramatic increases in the supply of U.S. food commodities have occurred in response to the significant food-price inflation of the early 1970s. This inflation led to an abundance of cheaper substrates (corn, soybeans) from which a new era of highly-processed foods with higher fat and sugar content have emerged. These surpluses, coupled with food science technology, fueled the exponential increase of new, inexpensive processed foods throughout the 1980s. Although these additives have not been proven to directly cause obesity, the effects of increased availability and aggressive marketing of these new products on human consumption are clear.
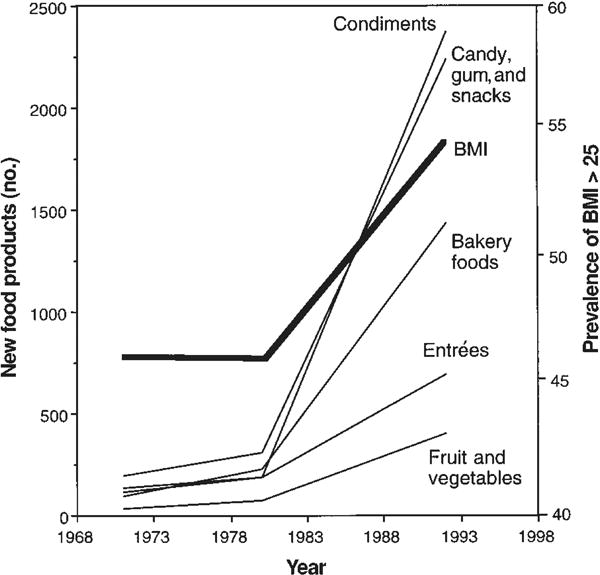
The industry of food and beverage sales is a narrow profit margin business, and as the variety of food products expanded, the competition for each food-dollar of the U.S. consumer increased.28 Eventually, food manufacturers realized that children were more than just passive recipients of the foods their parents chose. Instead, children were increasingly seen as consumers with growing independence and significant influence over the purchasing choices of adults. By 1999, children aged 6- to 19-years-old were estimated to have influenced $485 billion in purchasing decisions each year.29 Although not proven to directly cause childhood obesity, there is a clear “time-course” association between childhood obesity and the increased availability of calorie-dense processed foods which are marketed directly to children (Figure 4).16 The amount of advertising money spent on all marketing to children rose from $6.9 billion (1992) to $12.7 billion (1997),28 while consumption of fat and carbohydrates increased in children (aged 11–18) by 4% and 15%, and obesity rates in this age group tripled from 1980 to 2006.30 A 2004 study found that food-related television advertising made up 26% of advertised products viewed by adolescents, and the proportion of exposure to these ads were 14% greater for African American versus white adolescents aged 12 to 17.31 Potential explanations for this difference were higher TV viewing rates in this population, with marketing campaigns targeting them specifically.
Figure 4.
Although the marketing of energy-dense, processed foods has been ubiquitous, availability of these processed foods in relation to healthier options has been demonstrated to differ among neighborhoods and according to SES. Regarding the food eaten at home, most families obtain their foods from the nearest grocery store. However, grocery stores across the country have been shown to differ in quality and prices of foods offered. Supermarkets have been shown to be more likely to stock healthful foods at a lower cost than smaller grocery stores. Study results based on multistate samples have found that low- versus high-income neighborhoods and predominantly black versus white neighborhoods have fewer numbers of available supermarkets but significantly more grocery and convenience stores, and thus a lower proportion of healthier options for customers.21 Furthermore, low-income families with proportionally higher costs of living have less money for food which encourages a propensity for inexpensive, but high-calorie foods.32
Food away from home
The percent of total income spent on food away from home increased from 26% in 1970 to 39% by 1996.33 Factors cited to contribute to this growing trend of dining out are the rise of two-income households, higher incomes, less expensive but more convenient fast-food, smaller family size and pervasive advertising of food service establishments.34 Between 1977 and 1996, Americans families increased the proportion of total energy obtained from restaurants and fast-food establishments and decreased the proportion obtained from home. Between 1977 and 1996, children ages 2 – 18 decreased their total percent of energy eaten at home by 10.5% (75.7% to 65.2%), increased the percentage of energy obtained from restaurant/fast-food by 10% (4.8% to 14.8%), and decreased total energy intake from school by 2.2%. Thus, it is not surprising that energy intake from restaurant/fast-food increased by between 91.2% and 208% for all age groups.35
In regard to children in the U.S., perhaps the most influential food-service establishment is the U.S. public school system. Children spend approximately 8 hours per day and 180 days per year on school property. Over 25 million students use the National School Lunch Program daily, while approximately 7 million utilize the National School Breakfast Program daily.36 Meals from these programs may constitute more than half the daily caloric intake for children who participate in both programs, particularly for those from low-income families. Due to the fact that pediatric obesity is more prevalent in lower socioeconomic groups, such children from these groups may be influenced more significantly by the content of these free or discounted meals.37
Over the past four decades local budgetary changes began forcing schools to move the preparation of school meals to off-site locations, thus relinquishing the nutritional control over cafeteria meals once held by on-site food preparation staff.38 Eventually, the traditional school cafeteria has transformed from an adequately-funded, large-scale kitchen where food is prepared by skilled staff to merely a final site of assembly for pre-cooked food products which require minimally-trained staff. As a result, according to a 2007 USDA report, fewer than one-third of U.S. public schools were able to meet the recommended standard for either total or saturated fat in their meals.39
Another factor contributing to pediatric obesity is the emergence of the direct marketing and sale of food to children inside schools, but outside of federal school lunch programs. Consistent budget shortfalls have created an environment increasingly open to entrepreneurial opportunities. In the early 1990s, fast-food companies began selling products directly to school children by posting kiosks outside of school cafeterias, thus avoiding long-standing federal restrictions on such foods inside school cafeterias. School districts generated revenues by purchasing discounted fast-food products and marking them up prior to sale to school children.38 For poorer school districts, this meant increased revenues by allowing fast-food companies to “establish their brand” inside schools.40
Soft-drinks have been sold in schools since the 1960s, predominantly through vending machines in teachers’ lounges, and as concessions at sporting events. By the mid-1990s a more symbiotic relationship began to emerge between schools and soft-drink companies. In the early 1990s large soft-drink companies began offering exclusive “pouring rights” contracts to school districts that included elementary, middle and high school facilities. These contracts were similar to the arrangements between a soda manufacturer and University stadiums, and entailed three monetary payments for three contractual promises. First, in return for exclusively selling one brand of soda, schools would receive commissions and yearly bonus payments, both of which were tied to the quantity of sodas sold. Second, schools would receive free product to sell at fund-raising events if they agreed to display that brand’s advertising on campus.28 Third, companies offered more aid to school fund-raising events if their products were available during all school hours.38 Between 1985 and 1997, soda sales to U.S. schools increased 1100%, while milk sales to schools declined 30%.28 By 2005, 67% of middle and 83% of U.S. high school students were enrolled in schools with some form of a “pouring contract”, with the only SES variance being that Hispanic students were more likely than other ethnicities to have soft drinks available throughout the school day.40
Many studies have now shown this significant relationship between children and beverage intake. USDA national survey data indicate that between 1965 and 1996, declining milk intakes were observed, while soft-drink and non-citrus juice intake increased in adolescents 11- to 18-years of age.30 By the year 2000 soft-drinks were the leading source of added sugar in the diet and were estimated to contribute 36.2g and 57.7g daily for adolescent girls and boys, respectively.41, 42 In children aged 2- to 17-years-old participating in the 1994–96 Continuing Survey of Food Intakes by Individuals (CSFII), milk intake was positively associated with recommended intakes of vitamin A, folate, vitamin B-12, calcium and mangnesium.43 In 2005, a study of 645 children ages 1–5 found that milk intake was inversely associated with intakes of juice drinks, sodas and added sugar beverages for all age groups.44 A 2001 prospective, observational study of 548 ethnically diverse school-children with an average age of 11.7 years found that for each additional serving of sugar-sweetened drinks, both BMI and frequency of obesity significantly increased (adjusted for anthropometric, demographic, dietary and lifestyle variables).45
The association between an underfunded school environment, likely to provide calorie-dense foods and beverages, and childhood obesity is highlighted by studies showing that school SES and racial/ethnic composition are inversely related to BMI, even after controlling for these factors.46 Lower income, urban, African American and Hispanic community rates of childhood overweight or obesity have been documented to be as high as 40% in elementary school populations.47 Although those environmental factors mentioned above have not been proven to directly cause obesity, the association is undeniable and broad efforts are being made to remove these influences from all schools in response to the epidemic of childhood and adolescent obesity. For example, Los Angeles County schools have banned sales of soda and snacks at all schools, and efforts in Minnesota schools have introduced programs to increase the amount of fruits and vegetables served, as discussed later in the section on “Targeted Approaches to Improving Childhood Nutrition.”
II. Socioeconomics of Physical Activity in Obesity and Diabetes in Children
Physical activity in children and adolescents
Physical activity was once a critical part of daily life for all human beings, young and old. The conveniences of modern life (transportation, easy food sources), and some of the inconveniences (crime, lack of time for engaging in exercise and other healthy behaviors) have changed this considerably. In children and adolescents this had led to increasing rates of both diabetes and obesity.48 Multiple factors, including those related to SES, affect a child’s level of physical activity and fitness, from the activity level of their parents and friends to the distance they must travel to get to the nearest, safe playground.
Measuring levels of physical activity in children can be difficult, especially in younger children48. Many studies rely upon self-reporting, interviews and questionnaires. While these are often easier to perform than direct measurements of activity, they are not always accurate.49 Younger children might not be able to report their activity appropriately, and as with all studies involving self-reporting, the opportunity for recall-bias exists. More recent studies have taken advantage of technology, using devices such as accelerometers that provide more objective data.50 These devices can record periods of activity and provide an estimate of that activity’s intensity. Of course, compliance issues can arise with these devices as well.
The American Heart Association, in their 2005 Scientific Statement regarding the prevention and treatment of overweight/obesity in children and adolescents, recommends that children engage in 30 to 60 minutes of regular exercise daily. They define an adequate effort as exercise that causes the participant to “work up a sweat”. They also recommend limiting sedentary behaviors to less than 2 hours per day.51 But how frequently are American children meeting these recommendations? In a longitudinal study of over 1,000 children aged 9- to 15-years, the National Institute of Child Health and Human Development’s Study of Early Child Care and Youth Development found that at 9 years of age, children were involved in approximately 3 hours of “moderate-to-vigorous activity” per day (including weekdays and weekends).52 Investigators found that, each year, the amount of time that participants were involved in moderate-to-vigorous activity declined by approximately 40 minutes. By age 15 participants were only exercising for between 35 and 49 minutes per day. The decline in time spent active was seen in both boys and girls, though boys remained somewhat more active for a longer period of time (Figure 5).52 In a similar study using accelerometer data from individuals aged 6 to 20 and older, Troiano et al. reported that activity levels declined significantly between the 6- to 11-year-old age group, and those aged 12- to 19-years.53 They found that while 42% of 6–11 year-old children engaged in at least 60 minutes of physical activity daily, only 8% of older children and adolescents did so. They also noted that less than 5% of the adults studied engaged in 30 minutes of exercise daily.
Figure 5.

Decreased physical activity and childhood obesity
Decreased (or the complete lack of) physical activity is associated with a number of concerning outcomes in children and adolescents. Data from the Centers for Disease Control and Prevention Youth Risk Behavior Survey performed in 1999 revealed strong correlations between one’s physical activity level and body weight.54 Over 15,000 U.S. adolescents aged 14 to 18 were surveyed, and multiple racial groups were represented. Participants were given questionnaires to determine their level of physical activity (either moderate or vigorous), as well as the number of hours they spent watching television on school days. BMI was significantly lower in those participants engaged in at least moderate physical activity. Conversely, lower levels of physical activity were associated with an increased risk for being overweight. There was a graded correlation between television watching and being overweight (Table 1). Those who watched four or more hours of television per school day were the most likely to be overweight, while those reporting less than one hour of television watching per day were approximately 40% less likely to be overweight. Of note, the impact that television watching had on weight appeared to be more significant than that of physical activity alone.
Table 1. Association between moderate physical activity, television watching and overweight status in U.S. boys and girls (ages 14 to 18).
Data presented as odds ratio (OR) with 95% confidence interval, followed by significance (P value). Data from Eisenmann JC, Bartee RT, Wang MQ. Physical activity, TV viewing, and weight in U.S. youth: 1999 Youth Risk Behavior Survey. Obes Res. May 2002;10(5):379–385.
| Group | Moderate Physical Activity | Television watched | ||
|---|---|---|---|---|
|
| ||||
| < 2 d/wk | 6–7 d/wk | < 1 hr/d | > 4 hr/d | |
| Boys | 1.37 (1.17–1.61; P<0.001) | 1.0 | 0.58 (0.48–0.71; P<0.001) | 1.0 |
| Girls | 1.10 (0.74–1.65; P=NS) | 1.0 | 0.61 (0.49–0.77; P=0.05) | 1.0 |
Studies have shown that a child’s degree or severity of obesity correlates with the prevalence of the metabolic syndrome, a condition involving insulin-resistance and hyperglycemia that is associated with poor cardiovascular outcomes. A study of overweight and obese children and adolescents by Weiss et al. in 2004 found that almost 50% of severely obese children met the criteria for the metabolic syndrome. Biomarkers of increased cardiovascular risk, such as low levels of the protective adipose tissue hormone, adiponectin, and elevated concentrations of C-reactive protein, a marker of potentially harmful inflammation and cardiovascular risk, were seen in these children.7 Of note, being overweight or obese in childhood predicts an increased risk of being overweight as an adult.55
Decreased physical activity and diabetes
Certainly, one of the most concerning consequences of decreased physical activity and increased obesity in children is the development of insulin-resistance and diabetes. The incidence of type 2 diabetes in children is increasing.56, 57 While little, if any, long-term data regarding activity level and risk for diabetes in children and adolescents exists, data are available that demonstrate that sedentary behavior is associated with an increased risk for developing type 2 diabetes in both adult men and women. Hu et al. found that the relative risk of developing type 2 diabetes in men in the U.S. was increased by more than 1.5 times in those that watched between 2 and 10 hours of television per week, compared to those that watched less than one hour.58 Those that watched more than forty hours per week had a risk of developing diabetes that was almost three times that of individuals that watched less than 1 hour weekly. In women, each two hour increase in television watching-time per day was associated with a 14% increase in the risk of developing type 2 diabetes (Table 2).59 Each two hour daily increase in the amount of time spent sitting at work was associated with an increased risk of 7 percent. Conversely, one hour of walking briskly per day was associated with a 34 percent reduction in the risk of developing diabetes. The authors estimated that 43 percent of new cases of type 2 diabetes in women could be prevented by watching less than ten hours of television per week and walking briskly for at least 30 minutes daily.
Table 2. Relative risk (RR) of having type 2 diabetes according to number of hours of television watched per week in U.S. men and women.
Data presented as RR with 95% confidence interval. Data from Hu FB, Leitzmann MF, Stampfer MJ, Colditz GA, Willett WC, Rimm EB. Physical activity and television watching in relation to risk for type 2 diabetes mellitus in men. Arch Intern Med. Jun 25 2001;161(12):1542–1548; and Hu FB, Li TY, Colditz GA, Willett WC, Manson JE. Television watching and other sedentary behaviors in relation to risk of obesity and type 2 diabetes mellitus in women. JAMA. Apr 9 2003;289(14):1785–1791.
| Group | Average Number of Hours of Television Watched per Week
|
|||
|---|---|---|---|---|
| 0–1 hr | 21–40 hr | >40 hr | P for Trend | |
| Men (RR), Age-adjusted | 1.0 | 2.22 (1.49–3.31) | 3.35 (1.71–6.55) | <0.001 |
| Women (RR), Age-adjusted | 1.0 | 1.53 (1.19–1.96) | 1.98 (1.39–2.81) | <0.001 |
A study of children with type 1 diabetes in Norway found that children who watched more than 4 hours of television daily had a significantly higher hemoglobin A1c (9.5% ± 1.6) than those who watched less than one hour of television daily (mean A1c 8.2% ± 0.9 percent).60 This significant trend remained valid even when adjustments were made for BMI and insulin dose.
Other effects of decreased physical activity in children and adolescents
Physical activity has been associated with an improvement in a child’s self-esteem. In fact, some studies have suggested that high-level activity (as defined by a biaxial accelerometer) has a positive effect on improving self-esteem, but that moderate-level activity does not.61 The converse of this is also true—obesity, a major outcome of low levels of physical activity, is correlated with lower levels of self-esteem in children.62 Studies have also looked at the effect of physical activity on bone density in adolescents. This is an important consideration to make, given that children and adolescents are still growing and building bone strength. The Amsterdam Growth and Health Longitudinal Study found that increased daily physical activity (as determined by subject interviews, with subsequent scores based upon frequency, duration and peak strain of activity reported) correlated positively with lumbar and hip bone mineral density.63 These subjects included male and female adolescents who were followed from age 13 to age 29. Neuromotor fitness, (as defined by a composite score of speed, flexibility and strength tests including leg lifts, standing high jump, armpull, bent arm hang, shuttle run, plate tapping, and sit and reach), but not cardiorespiratory fitness (as defined by maximal oxygen uptake, or VO2 max), correlated positively with bone density. When these individuals were followed though young-adulthood (up to age 36), the male participants continued to have an improved lumbar bone mineral density when correlated with the mechanical aspects of the activity (sum of all ground forces), but not metabolic aspects of the activity (intensity, duration and frequency).64 Female subjects had no correlation between either form of activity and lumbar spine density. The effects that these improvements in bone density will have on fracture risk in later adulthood are less clear.
Low levels of physical activity are associated with other poor health choices and behaviors in children and adolescents. The 1990 Youth Risk Behavior Survey evaluated over 11,000 high school students throughout the United States. The survey found that adolescents who participated in low activity (fewer than two days of “light exercise that made [them] breathe a little more than usual and made [their] heart beat a little fast than usual”) over a two-week period were more likely to smoke cigarettes, eat fewer fruits and vegetables, use marijuana and not wear a seat belt.65
Physical activity and minority and low socioeconomic populations
Previous studies have suggested that particular ethnic minorities are less physically active and less physically fit. Pivarnik et al. found that African American adolescent girls had significantly lower aerobic fitness (as assessed by VO2 max) and were not able to use a treadmill for as long as their white counterparts.66 Simons-Morton et al. reported a study of over 2,000 third-grade students living in California, Texas, Minnesota, and Louisiana.67 They found that white students reported significantly more minutes of physical activity than African American or Hispanic students. However, when multiple factors were included in their analysis (such as geographic location of the participants), ethnicity was no longer associated with lower levels of physical activity.67 In a study of 107 children (mean age 10 years-old) in Birmingham, Alabama, there were no significant differences between white and African American children in the hours of exercise they reported per week, or in the number of days per week they exercised.68 There were also no differences in sports team participation between the two ethnic groups. However, African American students spent approximately 40 minutes less time in physical education class at school, for reasons that are unclear. White children also had higher aerobic capacity than African American children.
Two large studies have evaluated the differences in physical activity between minority and low SES children, and their peers. The “Monitoring the Future” and “Youth, Education, and Society” studies surveyed almost 54,000 eighth-, tenth- and twelfth-grade students from across the United States.69 These surveys found that the percentage of students in schools requiring physical education decreased sharply from 87% among eighth-graders to 20% among those in twelfth-grade. Of all eighth-grade students, significantly fewer Hispanic students (75.9%) were exposed to physical education than their white peers (89.3%; P<0.05). However, schools attended by African American and Hispanic students had higher numbers of students walking or biking to school. The surveys also found that children from lower SES groups (as defined by level of parental education) were less likely to attend schools that required physical education (49.6% for those in the lowest SES group compared with 59.2% for those in the highest). Students from lower SES groups were also less likely to participate in varsity or intramural sports, or physical activity clubs, differences that held true for both boys and girls (Table 3). These discrepancies in physical education and activity place those from a lower SES at a great disadvantage, as their decreased physical activity places them at high risk for becoming overweight and obese.69
Table 3. Physical education school requirement and participation in interscholastic/varsity sports by socio-economic status.
Data presented represent U.S. 8th-, 10th- and 12th-graders as broken down by socioeconomic status (SES), with 1 being lower SES, and 5 being higher SES. Data presented as percentages.
| Student Socioeconomic Status
|
|||||
|---|---|---|---|---|---|
| Variable | 1 (Low) | 2 | 3 | 4 | 5 (High) |
| % of students for whom PE required | 49.6 | 51.8 | 50.2 | 55.2 | 59.2** |
| % Boys participating in scholastic/varsity sports | 31.7 | 35.9 | 37.1 | 39.1 | 39 7*** |
| % Girls participating in scholastic/varsity sports | 27.4 | 31.9 | 33.0 | 35.0 | 35.6 *** |
Significance of linear association shown.
P<0.01,
P<0.001. Data from Johnston LD, Delva J, O’Malley PM. Sports participation and physical education in American secondary schools: current levels and racial/ethnic and socioeconomic disparities. Am J Prev Med. Oct 2007;33(4 Suppl):S195–208.
Sedentary behaviors, minority groups, and low socioeconomic status
Children in the United States participate in a number of sedentary behaviors, from television and movie watching, to playing video games, to reading. While a controlled amount of these behaviors may be stress-reducing and healthy, this can only be the case if these behaviors are not performed at the expense of regular physical activity. As with physical activity, an individual’s SES can play an important role in modulating one’s risk for developing obesity or diabetes. Data from the Third National Health and Nutrition Examination Survey (NHANES), which surveyed over 4,000 American children between 1988 and 1994, showed that 80% of all U.S. children were engaged in at least three episodes of vigorous physical activity per week.70 These rates were lower in Mexican American girls (73%) and non-Hispanic black girls (69%). Girls were, overall, less active than boys (Table 4). In regard to their television viewing habits, one-quarter of all children surveyed watched at least four hours of television daily, and two-thirds watched at least two hours daily. 42% of non-Hispanic black children watched four or more hours, and those children that watched more than four hours per day had a greater BMI and body fat percentage than those who watched less than two hours daily.
Table 4. Unadjusted Prevalence of Number of Weekly Sessions of Vigorous Play or Exercise in U.S. Youth (aged 8–16).
Data presented as prevalence (per 100%). Data from Andersen RE, Crespo CJ, Bartlett SJ, Cheskin LJ, Pratt M. Relationship of physical activity and television watching with body weight and level of fatness among children: results from the Third National Health and Nutrition Examination Survey. JAMA. Mar 25 1998;279(12):938–942.
| Prevalence of Reported Sessions per Week of Vigorous Play/Exercise
| |||
|---|---|---|---|
| Group (aged 8–16) | ≤ 1 session | 2 sessions | ≥ 3 sessions |
| Non-Hispanic white | |||
| Boys | 3.4 | 8.8 | 87.9 |
| Girls | 10.9 | 12.0 | 77.1 |
| Non-Hispanic black | |||
| Boys | 9.4 | 13.0 | 77.6 |
| Girls | 15.8 | 14.8 | 69.4 |
| Mexican American | |||
| Boys | 7.4 | 12.4 | 80.2 |
| Girls | 15.4 | 11.9 | 72.6 |
In a study of British children and adolescents (aged 11–16 years), those from lower socioeconomic neighborhoods were significantly more sedentary than those from higher SES locales. Boys from lower SES neighborhoods spent almost 2.5 more hours engaged in sedentary behavior each week than their peers, and girls spent over 4 more hours per week.71
Interestingly, some of the traditionally sedentary behaviors in which children and adolescents engage are becoming more active. The popularity of the Nintendo Wii home entertainment system is one such example. Of course, the energy expended while using such a system does not equal that of actually playing sports.72 Furthermore, these systems are expensive, and may not be available to children from lower socioeconomic backgrounds. However, the addition of the concept of “active” play with activities typically associated with purely sedentary behavior is a step in the right direction.
Community resources, crime, and physical activity
The community in which a child lives can have a great effect on their level of physical activity. Gordon-Larsen et al. studied a group of more than 20,000 American adolescents in a variety of community-types between 1994 and 1995.73 They found that communities with more college-educated individuals had a wider variety and number of facilities available for physical activity than communities with a lower-educated populace. Furthermore, as the minority population in an area increased, the odds of having any physical fitness facility at all decreased. Communities with more facilities available had more active adolescents, and subsequently, lower numbers of overweight individuals. Adolescents who lived in areas with at least seven facilities available for exercise and physical activity were 26% more likely to be active than those who lived in areas without any facilities, and were 32% less likely to be overweight.
The perceived level of crime in a neighborhood is often another deterrent to physical activity in a community. One study that looked into this issue involved the Behavioral Risk Factor Surveillance System, a telephone survey of individuals at least eighteen-years-of-age in Maryland, Ohio, Virginia, Pennsylvania and Montana.74 Those surveyed were asked to report how safe they felt in their neighborhood, and were also asked about their own physical activity. Thirty percent of respondents indicated that they were physically inactive. Inactivity was increased in older adults, ethnic minorities, those with less education and in those with annual household incomes less than $ 20,000 dollars. In this study the perceived degree of safety in one’s neighborhood was associated with the degree of physical activity in which that individual was involved, though they did not report the actual crime levels in the neighborhoods. Studies have also shown that women, and particularly women from minority groups, are hesitant to use public spaces for physical activity given concerns for their safety.75 Furthermore, the parents of ethnic minority children are often hesitant to allow their children to engage in after-school activities, and report concern for safe travel to and from the activities as one reason for their concern.75 A study of the mothers of over 3,000 three-year-old children in twenty large cities in the U.S. found that maternal perception of neighborhood safety was not associated with decreased weekday or weekend outdoor playtime. However, those children living in the neighborhoods perceived to be the least safe spent the most amount of time indoors watching television.76 Another study surveying fourth-grade children found that while children from low socioeconomic backgrounds found more “hazards” in their neighborhoods (including crime, gangs, drugs, prejudice, traffic, trash and litter, among other items), they reported higher levels of physical activity than children from higher socioeconomic families.77 The reasons for these discrepancies are unclear.
A child’s parents and friends may have a significant effect on their activity level and the amount of sedentary behavior in which they take part. A study of adolescents in Norway (mean age 13.3 years-old) found that individuals with parents and friends who valued physical activity and helped engage the adolescent in some form of activity were more likely to be physically active themselves.78 An eight-year-long study from the same group, however, found that there were only weak associations between the physical activity levels of parents and their children.78 The previously-discussed study of children in Birmingham, Alabama found that children in a single parent home spent significantly more time watching television than those in a dual parent home, and also spent less time exercising in physical education classes at school.68 Ethnicity and gender were not associated with higher television watching. It is worth noting that children from single parent homes exercised more days per week than their counterparts, and also had higher levels of aerobic fitness (as measured by VO2 max).68 These studies demonstrate the complexity with which one’s social environment affects their ability to engage in regular physical activity, and thus, improve their risk factors for obesity and diabetes.
American children and adolescents are less active than they were in the past, and as a result are more overweight and obese, and have complications of obesity such as diabetes. There are multiple reasons for this decrease in physical activity. Some are more obvious, such as large amounts of sedentary behavior, including television-watching. Other factors, such as the communities in which children live, and their socioeconomic circumstances, are more complex. Further studies are needed in order to gain a better understanding of the barriers children face when attempting to become more physically active.
III. Socioeconomics of Diabetes in Children
Many are aware of the global obesity epidemic affecting children and adolescents. However, fewer people realize the toll that poor food choices and sedentary behavior have had on another growing problem affecting children–diabetes. As with obesity, those from lower socioeconomic backgrounds have abundant barriers to overcome when approaching this dangerous disease. Though touched upon already in this review, the section that follows will provide greater detail regarding diabetes in children and adolescents. It will first describe this growing problem in terms of increasing prevalence and incidence, and then detail the difficulties that minority groups and those from a lower socioeconomic background face in regard to both disease burden and management.
Prevalence and incidence of diabetes in children
Diabetes is a complex and costly medical condition afflicting millions of people worldwide, and is one of the major medical consequences of the obesity epidemic. According to data from the National Health and Nutrition Examination Survey (NHANES) performed between 1999 and 2002, the prevalence of diabetes (diagnosed and undiagnosed) in the United States was 9.3% of the population, or 19.3 million Americans.79 This number has increased significantly from a prevalence of 7.8% between 1988–1994. Importantly, the 1999 to 2002 data showed that African Americans and Mexican Americans had twice the prevalence of non-Hispanic whites. The most recent data available from the Centers for Disease Control indicate that 23.6 million Americans age 20 and older have diabetes (both diagnosed and undiagnosed). Interestingly, this equates to a prevalence of 7.8%, indicating that the overall prevalence of diabetes in the U.S. may have decreased since the earlier NHANES report.80 The increase in diabetes is a global problem, with the World Health Organization estimating that the global prevalence of diabetes will increase from 2.8% in 2004 to 4.4% by 2030. This equates to 366 million people living with diabetes.81 No population is spared—all races, socioeconomic groups and ages are affected by this disease, though certain ethnic groups appear to be more affected than others. For example, while children born in the US in 2000 are estimated to have more than a 30% chance of developing diabetes in their lifetime, this estimate increases to 52.5% among Hispanic females.11
When determining the prevalence and incidence of diabetes in children and adolescents, one must first define the type of diabetes that they are evaluating. Although type 2 diabetes is more closely associated with the obesity epidemic and socioeconomic discrepancies, type 1 diabetes remains more prevalent among children, comprising at least 80% of children with diabetes. Type 1 diabetes is typically associated with autoimmunity (positive antibodies) and severely decreased or the complete lack of insulin production.82 While some studies have suggested a role for various socioeconomic factors (smaller family size, increased family income) in the pathogenesis of type 1 diabetes, others have shown no clear association between SES and this form of the disease.83
Type 2 diabetes was once considered a disease of adulthood, but as children and adolescents have become more overweight and obese, type 2 diabetes has become much more common in this younger generation. Case series performed in major U.S. cities in the 1990s showed that, depending on the community, 8 to 45% of newly-diagnosed cases of diabetes in individuals aged 19 or younger were type 2 diabetes (Table 5)84 These studies included children of various ethnic backgrounds, including whites, African Americans, and Hispanics.
Table 5. New cases of type 2 diabetes in U.S. children and adolescents, 1982.
–1997.
Studies include case series only. Data presented as estimated percentage of cases of type 2 diabetes out of all newly-diagnosed cases of diabetes. Whites (W), African Americans (AA), Hispanics (H), Asian Americans (AsA). Data from Type 2 diabetes in children and adolescents. American Diabetes Association. Diabetes Care. Mar 2000;23(3):381–389.
| Study | Race/Ethnicity | Age (years) | Estimated % of New Cases |
|---|---|---|---|
| San Diego, CA | W, AA, H, AsA | 0–16 | 8 |
| Cincinnati, OH | W, AA | 0–19 | 16 |
| 10–19 | 33 | ||
| San Antonio, TX | W, H | 18 | |
| Ventura, CA | H | 0–17 | 45 |
One report from a registry in New York found that over a ten-year period the number of patients less than 18 years of age with type 2 diabetes increased by a factor of ten.57 Another case series studying newly-diagnosed diabetic adolescents in Cincinnati found that the incidence of non-insulin dependent diabetes in that population had increased from 0.7/100,000 per year in 1982 to 7.2/100,000 per year in 1994.56
Most children with type 2 diabetes are overweight or obese, with case series reporting mean BMI estimates ranging from 27 to 38 kg/m2.85, 86 In a study of 167 obese children and adolescents, Sinha et al. found that between 21 and 25% had impaired glucose tolerance, a precursor to developing diabetes, and that 4% had undiagnosed type 2 diabetes.6 Therefore, as the number of obese children increases in the United States and in other countries, the incidence of new cases of type 2 diabetes will increase concomitantly. It should be noted that as the obesity epidemic in children in the United States continues, many type 1 diabetics will become overweight or obese, and subsequently, insulin-resistant as well.87 These individuals may, then, have a similar risk for cardiovascular disease as those children and adolescents with type 2 diabetes. Research has suggested that insulin-resistance in type 1 diabetic patients is associated with an increased risk for cardiovascular morbidity and mortality. Ten-year follow-up from the Pittsburgh Epidemiology of Diabetes Complications study, a historical prospective cohort study involving over 600 type 1 diabetic individuals, demonstrated that insulin-resistance (as measured by estimated glucose disposal rate) was predictive of hard cardiovascular outcomes, including death, non-fatal myocardial infarction, silent myocardial infarction, and significant coronary artery stenosis.88 The obesity epidemic is likely more harmful in populations that are prone to developing diabetes, underscoring the genetic underpinnings of the problem. This point is supported by data from Italy showing that in this low-diabetes-risk population, only 0.2% of obese children were found to have type 2 diabetes.89 This contrasts with the findings from a study of Mexican American youth living in south Texas, where 82% of children with type 2 diabetes had a BMI that was greater than 25 kg/m2.90
In addition to their obesity, children with type 2 diabetes often have other significant risk factors for cardiovascular disease, including high blood pressure and hyperlipidemia.86 While long-term data is limited in these individuals, one can theorize that a diagnosis of diabetes during childhood will lead to diabetes complications at an earlier age, and these may include heart, cerebrovascular and renal diseases, among many others.85 One study involving diabetic children in Australia found that type 2 diabetic children had higher rates of developing both hypertension and microalbuminuria than their peers with type 1 diabetes. Diabetic retinopathy, however, was more common in type 1 diabetic children.91 In another study of 26 children with type 2 diabetes living in New York City, diabetic children were found to have significantly higher triglyceride concentrations and average systolic blood pressures, and 40% had microalbuminuria (with a mean duration of diabetes of 17 months).92 These risk factors for the complications of diabetes can become quite expensive to treat, and will likely be difficult for those from lower socioeconomic backgrounds to manage appropriately for this reason.
Diabetes in minority populations
Children and adolescents from minority populations, who are often living in lower socioeconomic regions of the country and may have fewer resources available to them, are at particularly high risk for developing type 2 diabetes. One study of newly-diagnosed, insulin-dependent diabetic individuals aged less than 20 years-old in Allegheny County, Pennsylvania found that in older adolescents (aged 15- to 19-years), the incidence of developing diabetes was almost three times higher in non-whites (30.4/100,000 people) than in whites (11.2/100,000).93 This was a statistically significant difference (P=0.001). Of note, this study did not differentiate between children with type 1 or type 2 diabetes. The authors noted that this was the first time in the history of their registry (which began recording patient information in 1965) that non-white children had a higher incidence of diabetes than white children. They theorized that this increase in diabetes, particularly in adolescents aged 15- to 19-years, could be related to an increase in forms of diabetes besides ‘classical’, insulin-dependent diabetes, and suggested that this increase might be related to environmental changes, such as childhood weight gain.93
Other studies have supported the finding that the increase in type 2 diabetes in minority populations appears to increase with age. The previously described study of children living in south Texas from 1990 to 1998 found that 30% of Mexican American children had type 2 diabetes, but that they accounted for 82% of the type 2 diabetes in children in that population.90 The SEARCH for Diabetes in Youth study found that most children less than 10-years-of-age with diabetes had type 1 disease.8 Non-Hispanic white children made up the majority of these individuals (approximately 75%). However, children in this age group from minority populations (including African Americans, Hispanics, Asian/Pacific Islanders, and American Indians) were also more likely to have type 1 rather than type 2 diabetes. In children and adolescents aged 10 and older, however, the numbers were quite different. In these individuals the majority were from minority populations (74%). Non-Hispanic whites continued to have a predominance of type 1 diabetes (85% of all cases). But 58% of African American diabetics had type 2 disease, and in Asian/Pacific Islanders the percentage was even higher at 70%. In American Indians with diabetes, a striking 86% of individuals had type 2 disease. Interestingly, Hispanic children in this age group still have more type 1 diabetes than type 2 (54 versus 46%) (Table 6).
Table 6. Incidence rate of type 2 diabetes (reported with 95% confidence interval) in various age groups and ethnic populations.
Data from Dabelea D, Bell RA, D’Agostino RB, Jr., et al. Incidence of diabetes in youth in the United States. JAMA. Jun 27 2007;297(24):2716–2724.
| Incidence Rate of Type 2 Diabetes
| |
|---|---|
| Age Group | Incidence Rate (with 95% Confidence Interval) |
| 10–14 years | |
| Non-Hispanic white | 3.0 (2.3–4.0) |
| African American | 22.3 (18.1–27.5) |
| Hispanic | 8.9 (6.4–12.3) |
| Asian/Pacific Islander | 11.8 (7.9–17.5) |
| American Indian | 25.3 (16.4–39.0) |
| 15–19 years | |
| Non-Hispanic white | 5.6 (4.5–6.9) |
| African American | 19.4 (15.3–24.5) |
| Hispanic | 17.0 (13.3–21.8) |
| Asian/Pacific Islander | 22.7 (16.9–30.4) |
| American Indian | 49.4 (35.6–68.5) |
Socioeconomics and and the increased risk for developing diabetes
Lower socioeconomic status is associated with an increased risk for developing diabetes. A sub-analysis of data from NHANES III demonstrated that a lower SES (as defined by low income) was associated with a significantly increased risk for having type 2 diabetes in both African American and non-Hispanic white women.94 Education level and occupation status were also associated with having diabetes in white women. Interestingly, there were no significant associations between SES and the risk for having type 2 diabetes in African American men. White men, however, were at increased risk as their income level decreased. Nelson et al found that those children living in a mixed-race urban (low SES, high poverty population) or rural working-class environment (low SES, moderate-to-low minority population) were more likely to be overweight when compared with their peers living in newer suburban locations (high SES, low minority population).95 Another study of individuals in Alameda County, California found that children that grew up with a lower socioeconomic position (as defined by the participant’s father’s occupation or education level) were more likely to develop type 2 diabetes.96 As identified from the previous NHANES data, this finding was particularly strong in women. The authors hypothesized that lower socioeconomic position was associated with risk factors for developing diabetes, including physical inactivity, limited opportunity for socioeconomic advancement and poor nutrition.96
These socioeconomic differences do not carry over to the developing world, perhaps because of the relative scarcity of food resources in these countries. A study of school children living in Karachi, Pakistan, found that those living under low-income circumstances had fewer risk factors for developing diabetes than their middle-income counterparts. Children in middle-income groups were less active, watched more television, were more likely to be overweight and overall had a much stronger family history of diabetes.97 This underscores the point that many of the factors behind increases in diabetes in the United States along socioeconomic lines may have much to due with the food and activity discrepancies seen in the developed world.
Socioeconomic disparities in caring for diabetes
Diabetes is a very costly disease. According to a recent report from the American Diabetes Association (ADA), the total estimated cost from diabetes in the United States in 2007 was $174 billion dollars. Costs include both direct costs, such as visits to the doctor, hospitalizations related to diabetes complications and the costs of various pharmaceutical and blood glucose testing devices, as well as indirect costs, such as productivity time lost (estimated to be as much as $58 billion).98 As much as 50% of these costs involve hospitalizations for inpatient care, and children and adolescents with diabetes are much less likely to incur these types of costs given their shorter duration of disease. However, as the number of children and adolescents with diabetes increases both in the United States and in countries around the world, one can project significantly higher future costs for all of these individuals, especially if they do not have access to proper preventive care and treatment. The ADA notes that medical costs for individuals with diabetes are over twice that of someone without diabetes.98 While young children are not affected by loss of time at work, there are data from Canada suggesting that children with type 1 diabetes are more frequently absent from school.99 One significant reason for absence was “poor metabolic control”. Similar data for type 2 diabetes are not yet known.
Many individuals with chronic illnesses lack adequate health insurance, and those with diabetes are no exception. A recent study by Wilper et al. found that almost 1.5 million working-age Americans with diabetes lacked health insurance, and found that these individuals did not have the same access to healthcare as their insured counterparts.100 Further studies found that being uninsured was associated with having undetected diabetes, perhaps then increasing an individual’s likelihood of developing preventable complications.101 Some data regarding children and adolescents without adequate health insurance coverage also exists. In a study of type 1 diabetic children and adolescents aged less than 20, underinsurance (patients without any health insurance, with Medicaid or participating in their state’s resident discount program) was associated with an increased risk of severe hypoglycemia. Older children without adequate insurance coverage had a relative risk of ketoacidosis that was over two times that of those that had adequate insurance coverage.102
As the childhood and adolescent obesity epidemic continues to grow, so will the diabetes epidemic. We must develop better treatment and prevention strategies now if we are to stem this rising tide of disease, and must focus much of our effort on caring for those minority and socioeconomic groups that are at highest risk.
IV. Targeted Solutions to Improving Childhood Obesity and Diabetes
The past decade has demonstrated that it will be difficult to decrease rates of childhood obesity and diabetes, and it is also likely to be difficult to alter the societal patterns that result in socioeconomic discrepancies in obesity and diabetes. Improvements are likely to require large-scale interventions by government agencies and local communities. As one example, the obesity epidemic in the United States stimulated the 2001 U.S. Surgeon General’s Call to Action to Prevent and Decrease Overweight and Obesity, identifying five principles to guide the country towards a healthier lifestyle.103 These principles included enhanced recognition of obesity as a health problem, assisting Americans in balancing their nutrition and exercise, identifying effective and culturally appropriate interventions, encouraging environmental changes to foster nutritious eating habits and public-private partnerships to implement all of the above. Each decade, the government report “Healthy People” challenges individuals, communities and professionals to take specific steps to improve health. The most recent version, Healthy People 2010, not only outlined target percentages of adults and children who will be overweight or obese by 2010, but also directly addressed the inverse relationship of SES and childhood obesity among different races in America.104 The report identified obesity as a “result of a complex variety of social, behavioral, cultural, environmental, physiological and genetic factors.” Due to the complexity of this issue, that report emphasized that initiatives designed to maintain a healthy weight should start in early childhood to increase the likelihood of healthy habits throughout adolescence and adulthood. The “Dietary Guidelines for Americans” is updated frequently and outlines nutritious guidelines for choosing food but has also started to address portion sizes in recent reports.105
Targeted approaches to improving childhood nutrition
For children, the U.S. school system represents perhaps the most influential source of food away from home and a key area to target improvements. The opportunities for schools to positively impact the nutrition of U.S. children have been limited by decreasing budgets which have led to outsourcing food preparation and revenue generating partnerships with manufactures of energy-dense foods and beverages. The lost opportunity to provide abundant options for healthy food, rich in fruits and vegetables, to children from lower SES represents a great challenge to society. While the prevalence of obesity in lower SES families may only be decreased after decades of broad social reform, the protected school environment represents potential for rapid improvement in discrepancies in childhood food nutrition.
Some assistance has been offered by federal laws such as the 1994 “Healthy Meals for Healthy Americans Act” that required the National School Breakfast and Lunch (NSBP & NSLP) programs to meet the “Dietary Guidelines for Americans.” In 2004, the “Child Nutrition and Nutrition Program for Women, Infants, and Children (WIC) Reauthorization Act” required school districts participating in the NSBP and NSLP to create “wellness” policies to include nutrition by the school year 2006–2007.106 Further addressing the school environment, efforts such as the 2007 “Child Nutrition Promotion & School Lunch Protection Act” which is seeking to change the definition of “food of minimal nutritional value” to reflect modern nutritional recommendations and broaden the power of the USDA to regulate all foods & beverages (vending machines, snack bars, etc.) sold in schools, not just food from federal school lunches.107
On a state level, collaboration alliances between the public and private sector have has produced initiatives such as the 2006 “Alliance For A Healthier Generation-School Beverage Guidelines.” The “Alliance for a Healthier Generation” is a joint initiative between the American Heart Association, the Clinton Foundation and a number of food, beverage and dairy companies designed to phase out full-calorie carbonated soft drinks and restrict snacks sold outside of the national school breakfast and lunch program with a goal of 100% compliance nationally by 2010. The strategy is to replace those goods with bottled water, low-fat and non-fat milk, 100% fruit juices, and low calorie snacks. A 2008 progress report showed a 58% reduction of beverage calories shipped to U.S. elementary, middle and high schools under contract with such companies since 2004.
On a local level school districts have the power to enact their own initiatives to further improve the nutritional environment of school children. In 1995, twenty elementary schools with multiethnic populations in St. Paul, Minnesota combined behavioral curricula, parental involvement, school food service changes and industry support to increase lunchtime fruit and vegetable consumption at all participating schools. In 2005, twenty-five schools in Mississippi combined distribution of free fruit and vegetables with nutrition education activities for school children to increase consumption of healthier foods. Consumption of fruits inside school and overall increased significantly (p=<0.01) among 8th and 10th grade students, however vegetable consumption inside school decreased significantly (p=0.05) and remained unchanged overall.108 A 1995 study of 4th and 5th grade students in a multi-ethnic school district in Minnesota combined behavioral curricula, parental involvement, school food service changes and industry support to promote fruit and vegetable consumption. The initiative increased lunchtime combined fruit and vegetable consumption, vegetable consumption in girls as well as proportion of total daily calories from fruits and vegetables.109 Individual school districts have taken the initiative to ban unhealthy snacks and carbonated soda sales to all school campuses. In 2004, the school board of the country’s second largest school district, Los Angeles County, voted unanimously to ban unhealthy snacks and sugary carbonated beverages from its campuses.
The economic disparities in childhood and adult obesity are also being addressed at a local level through initiatives designed to alter the environment of poorer communities. Access to healthier options of affordable food is limited in low-income neighborhoods, making nearby fast-food and full-service restaurant options more frequent choices for low-income families.110 For this reason a 2008 Los Angeles City Council ordinance was passed that prohibited construction of new fast-food restaurants in a 32 square-mile area of South Los Angeles, inhabited by 700,000 low-income people. The goals of this ordinance were to allow city planners time to study the economic and environmental effects of over-proliferation of fast-food restaurants in the community and develop solutions such as attracting full-service grocery stores, health food alternatives and full-service restaurants.
Targeted approaches to increasing childhood activity
If we are to make a difference in the obesity and diabetes epidemics affecting our children and adolescents, we must increase their physical activity and decrease their sedentary behaviors. More importantly, we must help them realize the importance of such lifestyle changes in improving their overall health. Various methods have been used to reach children to discuss these issues, and many of these have included children from lower socioeconomic backgrounds.
Marcus et al. reviewed and discussed many different media campaigns for improving physical activity. These included print and television advertising, as well as radio announcements and mailings.111 Unfortunately, while many of these programs improved awareness of the need to increase physical activity in a community, they did not necessarily increase activity. However, there have been successful interventions. The Physical Activity for Risk Reduction (PARR) project involved a low-income community in Birmingham, Alabama, and hoped to improve and promote physical activity among its members. The intervention involved implementing various community programs, and incorporated educational pamphlets. While there were no statistically significant differences in activity levels between those in the intervention and those in the control groups at the study’s completion, the study did show significant improvements in physical activity levels in those areas of the community with stronger leadership and community organization.111, 112 This study suggested that in order for a campaign to be effective in promoting physical activity within a community, it must involve the leadership and existing organizational structure of that community.
Attempts to increase or improve physical activity during physical education in schools have also been evaluated. In France, a four-year study of middle school students (Intervention Centered on Adolescents’ Physical Activity and Sedentary Behavior, ICAPS) has been implemented, with goals of improving physical activity and education using the school as a central focus.113 In this study, individuals participate in educational opportunities highlighting the importance of physical activity for one’s health, and also have increased opportunities both during and after school for increased physical activity and sports participation. Early, six-month results indicate that participants are more involved in after-school physical activities (such as sports), and that students are involved in fewer sedentary behaviors (such as television-watching). Similar school-based programs have been completed or are underway in the United States, many of which have been reviewed by Stone et al.114 One, the Child and Adolescent Trial for Cardiovascular Health (CATCH),studied elementary school-age children in four states, from various ethnic backgrounds.115 They incorporated programs into the school curricula which promoted the importance of physical activity, and which increased physical activity is performed during physical education class. The program was able to increase the amount of moderate-to-vigorous physical activity among participants over the three years of the study. Importantly, follow up studies of this group have indicated maintenance of these improved levels of physical activity for up to three years after the end of the official study period.114
These programs show that attitudes can change and physical activity levels can increase in child populations. We must be sure to target those at highest risk for decreased levels of physical activity and increased sedentary behavior, including those from lower socioeconomic backgrounds, and must direct our interventions to involve local community leadership and existing organizational structures. National, state and local agencies must become involved in creating policies that will improve the physical activity and physical education of children. Along these lines, the U.S. Congress has passed legislation such as the “Promoting Lifelong Active Communities Every Day Act,” which promotes funding to help children, families and communities achieve the national recommendation of sixty minutes of physical activity every day.116 On the local level the Florida Senate passed a bill setting clear guidelines for elementary school districts to comply with 150 minutes per week of physical education. However, a major emphasis for prolonged change is likely to require parents to be involved in order to continue these improvements in activity at home.
Targeted solution to improving the prevention and care of diabetes in children
In order to reverse, or at the very least slow, the epidemic of type 2 diabetes in our children and adolescents, we must focus on programs that will improve the prevention of, screening for and therapies for the disease. We cannot ignore those from lower socioeconomic and less-privileged backgrounds when producing and funding such interventions. Important programs are already in place, or are in development, and come from national, state and community initiatives.
Lifestyle interventions, such as weight reduction, dietary changes and increases in physical activity have been shown to reduce the incidence of type 2 diabetes in adults at high-risk for developing the disease.117, 118 Studies in children and adolescents are fewer, though some have been performed. These studies, such as the Kahnawake Schools Diabetes Prevention Project (involving school-age children in a Native American community near Montreal, Canada), the Bienestar Health Program (involving fourth-grade Mexican American children) and the Zuni Diabetes Prevention Program (targeting a Native American high school age population),119–122 demonstrate that community-based health education programs can have an impact on traditional risk factors for the development of type 2 diabetes. These include poor diet (high fat, low fruit and vegetable content) and increased sedentary behaviors (with associated paucity of more active behaviors)119–121 However, 8-year follow up results form the Kahnawake study demonstrated that improvements early during an intervention often do not persist, and show the significant challenges confronted when attempting to alter a community’s high-risk lifestyle behaviors.122
Any prevention program involving a large group of individuals will likely be expensive. This fact needs to be taken into consideration when developing such a program for any community, but particularly for a community with limited resources. Also, the aforementioned studies have presented data regarding impacts on risk factors for the development of type 2 diabetes. Little data exists specifically looking at changes in the incidence of diabetes in a school-age population after such interventions. However, some studies have suggested a decrease in the prevalence of hyperinsulinemia, perhaps a surrogate for a prediabetic state.120
Early treatment of hyperglycemia and high blood pressure in type 2 diabetes has been shown to significantly reduce morbidity and mortality in adults.123, 124 This would indicate that earlier detection and treatment of diabetes should improve multiple outcomes, including the incidence of both micro- and macrovascular disease. Little data evaluating these clinical treatment outcomes in children with type 2 diabetes is available, making recommendations regarding screening less evidence-based. However, the American Diabetes Association recommends screening any child that is overweight, or has at least two risk factors placing them at increased risk for having type 2 diabetes (including evidence of insulin-resistance on clinical exam, such as acanthosis nigricans, hypertension or hyperlipidemia; family history of diabetes; and particular ethnic background, such as Native American or African American). Fasting blood glucose values and oral glucose tolerance tests are considered appropriate screening methods.125
Importantly, not all children have equal access to the medical care necessary for the screening, diagnosis and treatment of type 2 diabetes. Between 2000–2003 approximately 28% of U.S. children lacked health insurance for at least some portion of the year.126, 127 Programs such as Medicaid and the Children’s Health Insurance Program have been established in order to help overcome this critical hurdle to appropriate and necessary healthcare for children.128 Studies have suggested that improved access to healthcare through such programs reduces emergency room visits, improves regular physician visits, and reduces family stress when children are provided proper coverage.129 State and national governmental agencies must continue to do all that they can to ensure insurance coverage to as many children as possible, with a goal of improving preventive healthcare, as well as improving the care of those already diagnosed with chronic diseases such as diabetes.
CONCLUSION
In conclusion, the epidemic of obesity among children in the United States is due to multiple factors, but is rooted in changes in food intake and physical activity among American children. Many factors related to both nutrition and activity have disproportionately affected children of lower socioeconomic status. As our society attempts to act toward improving trends in pediatric obesity and diabetes, particular efforts should be made toward directing resources such that lower socioeconomic groups may benefit as well.
BIBLIOGRAPHY
- 1.Ogden CL, Carroll MD, Flegal KM. High body mass index for age among US children and adolescents, 2003–2006. Jama. 2008 May 28;299(20):2401–2405. doi: 10.1001/jama.299.20.2401. [DOI] [PubMed] [Google Scholar]
- 2.Freedman DS, Dietz WH, Srinivasan SR, Berenson GS. The relation of overweight to cardiovascular risk factors among children and adolescents: the Bogalusa Heart Study. Pediatrics. 1999 Jun;103(6 Pt 1):1175–1182. doi: 10.1542/peds.103.6.1175. [DOI] [PubMed] [Google Scholar]
- 3.Webber LS, Osganian V, Luepker RV, et al. Cardiovascular risk factors among third grade children in four regions of the United States. The CATCH Study. Child and Adolescent Trial for Cardiovascular Health. Am J Epidemiol. 1995 Mar 1;141(5):428–439. doi: 10.1093/oxfordjournals.aje.a117445. [DOI] [PubMed] [Google Scholar]
- 4.McNiece KL, Poffenbarger TS, Turner JL, Franco KD, Sorof JM, Portman RJ. Prevalence of hypertension and pre-hypertension among adolescents. J Pediatr. 2007 Jun;150(6):640–644. doi: 10.1016/j.jpeds.2007.01.052. 644 e641. [DOI] [PubMed] [Google Scholar]
- 5.Sorof JM, Turner J, Franco K, Portman RJ. Characteristics of hypertensive children identified by primary care referral compared with school-based screening. J Pediatr. 2004 Apr;144(4):485–489. doi: 10.1016/j.jpeds.2003.12.047. [DOI] [PubMed] [Google Scholar]
- 6.Sinha R, Fisch G, Teague B, et al. Prevalence of impaired glucose tolerance among children and adolescents with marked obesity. N Engl J Med. 2002 Mar 14;346(11):802–810. doi: 10.1056/NEJMoa012578. [DOI] [PubMed] [Google Scholar]
- 7.Weiss R, Dziura J, Burgert TS, et al. Obesity and the metabolic syndrome in children and adolescents. N Engl J Med. 2004 Jun 3;350(23):2362–2374. doi: 10.1056/NEJMoa031049. [DOI] [PubMed] [Google Scholar]
- 8.Dabelea D, Bell RA, D’Agostino RB, Jr, et al. Incidence of diabetes in youth in the United States. Jama. 2007 Jun 27;297(24):2716–2724. doi: 10.1001/jama.297.24.2716. [DOI] [PubMed] [Google Scholar]
- 9.Franks PW, Hanson RL, Knowler WC, et al. Childhood predictors of young-onset type 2 diabetes. Diabetes. 2007 Dec;56(12):2964–2972. doi: 10.2337/db06-1639. [DOI] [PMC free article] [PubMed] [Google Scholar]
- 10.Strauss RS, Barlow SE, Dietz WH. Prevalence of abnormal serum aminotransferase values in overweight and obese adolescents. J Pediatr. 2000 Jun;136(6):727–733. [PubMed] [Google Scholar]
- 11.Narayan KM, Boyle JP, Thompson TJ, Sorensen SW, Williamson DF. Lifetime risk for diabetes mellitus in the United States. Jama. 2003 Oct 8;290(14):1884–1890. doi: 10.1001/jama.290.14.1884. [DOI] [PubMed] [Google Scholar]
- 12.Delva J, Johnston LD, O’Malley PM. The epidemiology of overweight and related lifestyle behaviors: racial/ethnic and socioeconomic status differences among American youth. Am J Prev Med. 2007 Oct;33(4 Suppl):S178–186. doi: 10.1016/j.amepre.2007.07.008. [DOI] [PubMed] [Google Scholar]
- 13.Kumanyika S, Grier S. Targeting interventions for ethnic minority and low-income populations. Future Child. 2006 Spring;16(1):187–207. doi: 10.1353/foc.2006.0005. [DOI] [PubMed] [Google Scholar]
- 14.Rolls BJ, Drewnowski A, Ledikwe JH. Changing the energy density of the diet as a strategy for weight management. J Am Diet Assoc. 2005 May;105(5 Suppl 1):S98–103. doi: 10.1016/j.jada.2005.02.033. [DOI] [PubMed] [Google Scholar]
- 15.Ledikwe JH, Ello-Martin JA, Rolls BJ. Portion sizes and the obesity epidemic. J Nutr. 2005 Apr;135(4):905–909. doi: 10.1093/jn/135.4.905. [DOI] [PubMed] [Google Scholar]
- 16.McCrory MA, Fuss PJ, McCallum JE, et al. Dietary variety within food groups: association with energy intake and body fatness in men and women. Am J Clin Nutr. 1999 Mar;69(3):440–447. doi: 10.1093/ajcn/69.3.440. [DOI] [PubMed] [Google Scholar]
- 17.Rolls BJ, Roe LS, Meengs JS. The effect of large portion sizes on energy intake is sustained for 11 days. Obesity (Silver Spring) 2007 Jun;15(6):1535–1543. doi: 10.1038/oby.2007.182. [DOI] [PubMed] [Google Scholar]
- 18.Nestle M, Jacobson MF. Halting the obesity epidemic: a public health policy approach. Public Health Rep. 2000 Jan-Feb;115(1):12–24. doi: 10.1093/phr/115.1.12. [DOI] [PMC free article] [PubMed] [Google Scholar]
- 19.Freedman DS, Khan LK, Serdula MK, Ogden CL, Dietz WH. Racial and ethnic differences in secular trends for childhood BMI, weight, and height. Obesity (Silver Spring) 2006 Feb;14(2):301–308. doi: 10.1038/oby.2006.39. [DOI] [PubMed] [Google Scholar]
- 20.Kilmer G, Roberts H, Hughes E, et al. Surveillance of certain health behaviors and conditions among states and selected local areas–Behavioral Risk Factor Surveillance System (BRFSS), United States, 2006. MMWR Surveill Summ. 2008 Aug 15;57(7):1–188. [PubMed] [Google Scholar]
- 21.Powell LM, Slater S, Mirtcheva D, Bao Y, Chaloupka FJ. Food store availability and neighborhood characteristics in the United States. Prev Med. 2007 Mar;44(3):189–195. doi: 10.1016/j.ypmed.2006.08.008. [DOI] [PubMed] [Google Scholar]
- 22.Glanz K, Sallis JF, Saelens BE, Frank LD. Nutrition Environment Measures Survey in stores (NEMS-S): development and evaluation. Am J Prev Med. 2007 Apr;32(4):282–289. doi: 10.1016/j.amepre.2006.12.019. [DOI] [PubMed] [Google Scholar]
- 23.Ogden CL, Carroll MD, Curtin LR, McDowell MA, Tabak CJ, Flegal KM. Prevalence of overweight and obesity in the United States, 1999–2004. Jama. 2006 Apr 5;295(13):1549–1555. doi: 10.1001/jama.295.13.1549. [DOI] [PubMed] [Google Scholar]
- 24.Chang VW, Lauderdale DS. Income disparities in body mass index and obesity in the United States, 1971–2002. Arch Intern Med. 2005 Oct 10;165(18):2122–2128. doi: 10.1001/archinte.165.18.2122. [DOI] [PubMed] [Google Scholar]
- 25.Paeratakul S, Lovejoy JC, Ryan DH, Bray GA. The relation of gender, race and socioeconomic status to obesity and obesity comorbidities in a sample of US adults. Int J Obes Relat Metab Disord. 2002 Sep;26(9):1205–1210. doi: 10.1038/sj.ijo.0802026. [DOI] [PubMed] [Google Scholar]
- 26.Freedman DS, Ogden CL, Flegal KM, Khan LK, Serdula MK, Dietz WH. Childhood overweight and family income. MedGenMed. 2007;9(2):26. [PMC free article] [PubMed] [Google Scholar]
- 27.Cohany SR., SE . Monthly Labor Review, US Department of Labor, Division of Labor Force Stasticis. 2007. Trends of labor force participation of married mothers of infants; pp. 9–16. [Google Scholar]
- 28.Nestle M. Food Politics- How the Food Industry Influences Nutrition and Health. Berkley, CA: University of California Press; 2007. [Google Scholar]
- 29.McNeal J. Marketing to Kids: Myths and Realities. Ithica, NY: Paramount Market Publishing, Inc.; 1999. [Google Scholar]
- 30.Cavadini C, Siega-Riz AM, Popkin BM. US adolescent food intake trends from 1965 to 1996. Arch Dis Child. 2000 Jul;83(1):18–24. doi: 10.1136/adc.83.1.18. [DOI] [PMC free article] [PubMed] [Google Scholar]
- 31.Powell LM, Szczypka G, Chaloupka FJ. Adolescent exposure to food advertising on television. Am J Prev Med. 2007 Oct;33(4 Suppl):S251–256. doi: 10.1016/j.amepre.2007.07.009. [DOI] [PubMed] [Google Scholar]
- 32.Bhattacharya J, DeLeire T, Haider S, Currie J. Heat or eat? Cold-weather shocks and nutrition in poor American families. Am J Public Health. 2003 Jul;93(7):1149–1154. doi: 10.2105/ajph.93.7.1149. [DOI] [PMC free article] [PubMed] [Google Scholar]
- 33.Putnam J, Allshouse J. Food Consumption, Prices, and Expenditures. Statistical Bulletin-Econ Res Serv. 1996;SB-928:143. [Google Scholar]
- 34.Nayga R, Jr, Capps O., Jr Impact of Socio-Economic and Demographic Factors on Food Away from Home Consumption: Number of Meals and Type of Facility. Journal of Restaurant and Food Service Marketing. 1994(1):45–69. [Google Scholar]
- 35.Nielsen SJ, Siega-Riz AM, Popkin BM. Trends in energy intake in U.S. between 1977 and 1996: similar shifts seen across age groups. Obes Res. 2002 May;10(5):370–378. doi: 10.1038/oby.2002.51. [DOI] [PubMed] [Google Scholar]
- 36.United_States_Department-of_Agriculture. Nutrition Program Facts. Alexandria, VA: United States Department of Agriculture; 2002. [Google Scholar]
- 37.Wang Y. Cross-national comparison of childhood obesity: the epidemic and the relationship between obesity and socioeconomic status. Int J Epidemiol. 2001 Oct;30(5):1129–1136. doi: 10.1093/ije/30.5.1129. [DOI] [PubMed] [Google Scholar]
- 38.Critser G. Fat Land. New York, NY: Houghton Mifflin Company; 2003. [Google Scholar]
- 39.United_States_Department-of_Agriculture. USDA School Nutrition Dietary Assessment Study-III. Alexandria, VA: United States Department of Agriculture; 1997. [Google Scholar]
- 40.Johnston LD, Delva J, O’Malley PM. Soft drink availability, contracts, and revenues in American secondary schools. Am J Prev Med. 2007 Oct;33(4 Suppl):S209–225. doi: 10.1016/j.amepre.2007.07.006. [DOI] [PubMed] [Google Scholar]
- 41.Bowman S. Diets of individuals based on energy intakes from added sugars. Fam Econ Nutr Rev. 1999;12:31–38. [Google Scholar]
- 42.Guthrie JF, Morton JF. Food sources of added sweeteners in the diets of Americans. J Am Diet Assoc. 2000 Jan;100(1):43–51. doi: 10.1016/S0002-8223(00)00018-3. quiz 49–50. [DOI] [PubMed] [Google Scholar]
- 43.Ballew C, Kuester S, Gillespie C. Beverage choices affect adequacy of children’s nutrient intakes. Arch Pediatr Adolesc Med. 2000 Nov;154(11):1148–1152. doi: 10.1001/archpedi.154.11.1148. [DOI] [PubMed] [Google Scholar]
- 44.Marshall TA, Eichenberger Gilmore JM, Broffitt B, Stumbo PJ, Levy SM. Diet quality in young children is influenced by beverage consumption. J Am Coll Nutr. 2005 Feb;24(1):65–75. doi: 10.1080/07315724.2005.10719445. [DOI] [PubMed] [Google Scholar]
- 45.Ludwig DS, Peterson KE, Gortmaker SL. Relation between consumption of sugar-sweetened drinks and childhood obesity: a prospective, observational analysis. Lancet. 2001 Feb 17;357(9255):505–508. doi: 10.1016/S0140-6736(00)04041-1. [DOI] [PubMed] [Google Scholar]
- 46.O’Malley PM, Johnston LD, Delva J, Bachman JG, Schulenberg JE. Variation in obesity among American secondary school students by school and school characteristics. Am J Prev Med. 2007 Oct;33(4 Suppl):S187–194. doi: 10.1016/j.amepre.2007.07.001. [DOI] [PubMed] [Google Scholar]
- 47.Slusser WM, Cumberland WG, Browdy BL, Winham DM, Neumann CG. Overweight in urban, low-income, African American and Hispanic children attending Los Angeles elementary schools: research stimulating action. Public Health Nutr. 2005 Apr;8(2):141–148. doi: 10.1079/phn2004675. [DOI] [PubMed] [Google Scholar]
- 48.Dencker M, Andersen LB. Health-related aspects of objectively measured daily physical activity in children. Clin Physiol Funct Imaging. 2008 May;28(3):133–144. doi: 10.1111/j.1475-097X.2008.00788.x. [DOI] [PubMed] [Google Scholar]
- 49.Corder K, Ekelund U, Steele RM, Wareham NJ, Brage S. Assessment of physical activity in youth. J Appl Physiol. 2008 Sep;105(3):977–987. doi: 10.1152/japplphysiol.00094.2008. [DOI] [PubMed] [Google Scholar]
- 50.Rowlands AV. Accelerometer assessment of physical activity in children: an update. Pediatr Exerc Sci. 2007 Aug;19(3):252–266. doi: 10.1123/pes.19.3.252. [DOI] [PubMed] [Google Scholar]
- 51.Daniels SR, Arnett DK, Eckel RH, et al. Overweight in children and adolescents: pathophysiology, consequences, prevention, and treatment. Circulation. 2005 Apr 19;111(15):1999–2012. doi: 10.1161/01.CIR.0000161369.71722.10. [DOI] [PubMed] [Google Scholar]
- 52.Nader PR, Bradley RH, Houts RM, McRitchie SL, O’Brien M. Moderate-to-vigorous physical activity from ages 9 to 15 years. Jama. 2008 Jul 16;300(3):295–305. doi: 10.1001/jama.300.3.295. [DOI] [PubMed] [Google Scholar]
- 53.Troiano RP, Berrigan D, Dodd KW, Masse LC, Tilert T, McDowell M. Physical activity in the United States measured by accelerometer. Med Sci Sports Exerc. 2008 Jan;40(1):181–188. doi: 10.1249/mss.0b013e31815a51b3. [DOI] [PubMed] [Google Scholar]
- 54.Eisenmann JC, Bartee RT, Wang MQ. Physical activity, TV viewing, and weight in U.S. youth: 1999 Youth Risk Behavior Survey. Obes Res. 2002 May;10(5):379–385. doi: 10.1038/oby.2002.52. [DOI] [PubMed] [Google Scholar]
- 55.Guo SS, Roche AF, Chumlea WC, Gardner JD, Siervogel RM. The predictive value of childhood body mass index values for overweight at age 35 y. Am J Clin Nutr. 1994 Apr;59(4):810–819. doi: 10.1093/ajcn/59.4.810. [DOI] [PubMed] [Google Scholar]
- 56.Pinhas-Hamiel O, Dolan LM, Daniels SR, Standiford D, Khoury PR, Zeitler P. Increased incidence of non-insulin-dependent diabetes mellitus among adolescents. J Pediatr. 1996 May;128(5 Pt 1):608–615. doi: 10.1016/s0022-3476(96)80124-7. [DOI] [PubMed] [Google Scholar]
- 57.Grinstein G, Muzumdar R, Aponte L, Vuguin P, Saenger P, DiMartino-Nardi J. Presentation and 5-year follow-up of type 2 diabetes mellitus in African-American and Caribbean-Hispanic adolescents. Horm Res. 2003;60(3):121–126. doi: 10.1159/000072523. [DOI] [PubMed] [Google Scholar]
- 58.Hu FB, Leitzmann MF, Stampfer MJ, Colditz GA, Willett WC, Rimm EB. Physical activity and television watching in relation to risk for type 2 diabetes mellitus in men. Arch Intern Med. 2001 Jun 25;161(12):1542–1548. doi: 10.1001/archinte.161.12.1542. [DOI] [PubMed] [Google Scholar]
- 59.Hu FB, Li TY, Colditz GA, Willett WC, Manson JE. Television watching and other sedentary behaviors in relation to risk of obesity and type 2 diabetes mellitus in women. Jama. 2003 Apr 9;289(14):1785–1791. doi: 10.1001/jama.289.14.1785. [DOI] [PubMed] [Google Scholar]
- 60.Margeirsdottir HD, Larsen JR, Brunborg C, Sandvik L, Dahl-Jorgensen K. Strong association between time watching television and blood glucose control in children and adolescents with type 1 diabetes. Diabetes Care. 2007 Jun;30(6):1567–1570. doi: 10.2337/dc06-2112. [DOI] [PubMed] [Google Scholar]
- 61.Strauss RS, Rodzilsky D, Burack G, Colin M. Psychosocial correlates of physical activity in healthy children. Arch Pediatr Adolesc Med. 2001 Aug;155(8):897–902. doi: 10.1001/archpedi.155.8.897. [DOI] [PubMed] [Google Scholar]
- 62.Wang F, Veugelers PJ. Self-esteem and cognitive development in the era of the childhood obesity epidemic. Obes Rev. 2008 Jul 16; doi: 10.1111/j.1467-789X.2008.00507.x. [DOI] [PubMed] [Google Scholar]
- 63.Kemper HC, Twisk JW, van Mechelen W, Post GB, Roos JC, Lips P. A fifteen-year longitudinal study in young adults on the relation of physical activity and fitness with the development of the bone mass: The Amsterdam Growth And Health Longitudinal Study. Bone. 2000 Dec;27(6):847–853. doi: 10.1016/s8756-3282(00)00397-5. [DOI] [PubMed] [Google Scholar]
- 64.Bakker I, Twisk JW, Van Mechelen W, Roos JC, Kemper HC. Ten-year longitudinal relationship between physical activity and lumbar bone mass in (young) adults. J Bone Miner Res. 2003 Feb;18(2):325–332. doi: 10.1359/jbmr.2003.18.2.325. [DOI] [PubMed] [Google Scholar]
- 65.Pate RR, Heath GW, Dowda M, Trost SG. Associations between physical activity and other health behaviors in a representative sample of US adolescents. Am J Public Health. 1996 Nov;86(11):1577–1581. doi: 10.2105/ajph.86.11.1577. [DOI] [PMC free article] [PubMed] [Google Scholar]
- 66.Pivarnik JM, Bray MS, Hergenroeder AC, Hill RB, Wong WW. Ethnicity affects aerobic fitness in US adolescent girls. Med Sci Sports Exerc. 1995 Dec;27(12):1635–1638. [PubMed] [Google Scholar]
- 67.Simons-Morton BG, McKenzie TJ, Stone E, et al. Physical activity in a multiethnic population of third graders in four states. Am J Public Health. 1997 Jan;87(1):45–50. doi: 10.2105/ajph.87.1.45. [DOI] [PMC free article] [PubMed] [Google Scholar]
- 68.Lindquist CH, Reynolds KD, Goran MI. Sociocultural determinants of physical activity among children. Prev Med. 1999 Oct;29(4):305–312. doi: 10.1006/pmed.1999.0546. [DOI] [PubMed] [Google Scholar]
- 69.Johnston LD, Delva J, O’Malley PM. Sports participation and physical education in American secondary schools: current levels and racial/ethnic and socioeconomic disparities. Am J Prev Med. 2007 Oct;33(4 Suppl):S195–208. doi: 10.1016/j.amepre.2007.07.015. [DOI] [PubMed] [Google Scholar]
- 70.Andersen RE, Crespo CJ, Bartlett SJ, Cheskin LJ, Pratt M. Relationship of physical activity and television watching with body weight and level of fatness among children: results from the Third National Health and Nutrition Examination Survey. Jama. 1998 Mar 25;279(12):938–942. doi: 10.1001/jama.279.12.938. [DOI] [PubMed] [Google Scholar]
- 71.Brodersen NH, Steptoe A, Boniface DR, Wardle J. Trends in physical activity and sedentary behaviour in adolescence: ethnic and socioeconomic differences. Br J Sports Med. 2007 Mar;41(3):140–144. doi: 10.1136/bjsm.2006.031138. [DOI] [PMC free article] [PubMed] [Google Scholar]
- 72.Graves L, Stratton G, Ridgers ND, Cable NT. Comparison of energy expenditure in adolescents when playing new generation and sedentary computer games: cross sectional study. Bmj. 2007 Dec 22;335(7633):1282–1284. doi: 10.1136/bmj.39415.632951.80. [DOI] [PMC free article] [PubMed] [Google Scholar]
- 73.Gordon-Larsen P, Nelson MC, Page P, Popkin BM. Inequality in the built environment underlies key health disparities in physical activity and obesity. Pediatrics. 2006 Feb;117(2):417–424. doi: 10.1542/peds.2005-0058. [DOI] [PubMed] [Google Scholar]
- 74.From the Centers for Disease Control and Prevention. Adult blood lead epidemiology and surveillance. Jama. 1993 Mar 17;269(11):1373. [PubMed] [Google Scholar]
- 75.Loukaitou-Sideris A, Eck JE. Crime prevention and active living. Am J Health Promot. 2007 Mar-Apr;21(4 Suppl):380–389, iii. doi: 10.4278/0890-1171-21.4s.380. [DOI] [PubMed] [Google Scholar]
- 76.Burdette HL, Whitaker RC. A national study of neighborhood safety, outdoor play, television viewing, and obesity in preschool children. Pediatrics. 2005 Sep;116(3):657–662. doi: 10.1542/peds.2004-2443. [DOI] [PubMed] [Google Scholar]
- 77.Romero AJ, Robinson TN, Kraemer HC, et al. Are perceived neighborhood hazards a barrier to physical activity in children? Arch Pediatr Adolesc Med. 2001 Oct;155(10):1143–1148. doi: 10.1001/archpedi.155.10.1143. [DOI] [PubMed] [Google Scholar]
- 78.Anderssen N, Wold B. Parental and peer influences on leisure-time physical activity in young adolescents. Res Q Exerc Sport. 1992 Dec;63(4):341–348. doi: 10.1080/02701367.1992.10608754. [DOI] [PubMed] [Google Scholar]
- 79.Cowie CC, Rust KF, Byrd-Holt DD, et al. Prevalence of diabetes and impaired fasting glucose in adults in the U.S. population: National Health And Nutrition Examination Survey 1999–2002. Diabetes Care. 2006 Jun;29(6):1263–1268. doi: 10.2337/dc06-0062. [DOI] [PubMed] [Google Scholar]
- 80.CDC w. Diabetes Fact Sheet 2007. http://www.cdc.gov/diabetes/pubs/pdf/ndfs_2007.pdf; accessed 12/1/2008.
- 81.Wild S, Roglic G, Green A, Sicree R, King H. Global prevalence of diabetes: estimates for the year 2000 and projections for 2030. Diabetes Care. 2004 May;27(5):1047–1053. doi: 10.2337/diacare.27.5.1047. [DOI] [PubMed] [Google Scholar]
- 82.Rosenbloom AL, Joe JR, Young RS, Winter WE. Emerging epidemic of type 2 diabetes in youth. Diabetes Care. 1999 Feb;22(2):345–354. doi: 10.2337/diacare.22.2.345. [DOI] [PubMed] [Google Scholar]
- 83.Connolly V, Unwin N, Sherriff P, Bilous R, Kelly W. Diabetes prevalence and socioeconomic status: a population based study showing increased prevalence of type 2 diabetes mellitus in deprived areas. J Epidemiol Community Health. 2000 Mar;54(3):173–177. doi: 10.1136/jech.54.3.173. [DOI] [PMC free article] [PubMed] [Google Scholar]
- 84.Type 2 diabetes in children and adolescents. American Diabetes Association. Diabetes Care. 2000 Mar;23(3):381–389. doi: 10.2337/diacare.23.3.381. [DOI] [PubMed] [Google Scholar]
- 85.Fagot-Campagna A, Pettitt DJ, Engelgau MM, et al. Type 2 diabetes among North American children and adolescents: an epidemiologic review and a public health perspective. J Pediatr. 2000 May;136(5):664–672. doi: 10.1067/mpd.2000.105141. [DOI] [PubMed] [Google Scholar]
- 86.Steinberger J, Daniels SR. Obesity, insulin resistance, diabetes, and cardiovascular risk in children: an American Heart Association scientific statement from the Atherosclerosis, Hypertension, and Obesity in the Young Committee (Council on Cardiovascular Disease in the Young) and the Diabetes Committee (Council on Nutrition, Physical Activity, and Metabolism) Circulation. 2003 Mar 18;107(10):1448–1453. doi: 10.1161/01.cir.0000060923.07573.f2. [DOI] [PubMed] [Google Scholar]
- 87.Williams KV, Erbey JR, Becker D, Arslanian S, Orchard TJ. Can clinical factors estimate insulin resistance in type 1 diabetes? Diabetes. 2000 Apr;49(4):626–632. doi: 10.2337/diabetes.49.4.626. [DOI] [PubMed] [Google Scholar]
- 88.Orchard TJ, Olson JC, Erbey JR, et al. Insulin resistance-related factors, but not glycemia, predict coronary artery disease in type 1 diabetes: 10-year follow-up data from the Pittsburgh Epidemiology of Diabetes Complications Study. Diabetes Care. 2003 May;26(5):1374–1379. doi: 10.2337/diacare.26.5.1374. [DOI] [PubMed] [Google Scholar]
- 89.Invitti C, Guzzaloni G, Gilardini L, Morabito F, Viberti G. Prevalence and concomitants of glucose intolerance in European obese children and adolescents. Diabetes Care. 2003 Jan;26(1):118–124. doi: 10.2337/diacare.26.1.118. [DOI] [PubMed] [Google Scholar]
- 90.Hale DE, Rupert G. The changing spectrum of diabetes in Mexican American youth. Rev Endocr Metab Disord. 2006 Sep;7(3):163–170. doi: 10.1007/s11154-006-9023-z. [DOI] [PubMed] [Google Scholar]
- 91.Eppens MC, Craig ME, Cusumano J, et al. Prevalence of diabetes complications in adolescents with type 2 compared with type 1 diabetes. Diabetes Care. 2006 Jun;29(6):1300–1306. doi: 10.2337/dc05-2470. [DOI] [PubMed] [Google Scholar]
- 92.Ettinger LM, Freeman K, DiMartino-Nardi JR, Flynn JT. Microalbuminuria and abnormal ambulatory blood pressure in adolescents with type 2 diabetes mellitus. J Pediatr. 2005 Jul;147(1):67–73. doi: 10.1016/j.jpeds.2005.02.003. [DOI] [PubMed] [Google Scholar]
- 93.Libman IM, LaPorte RE, Becker D, Dorman JS, Drash AL, Kuller L. Was there an epidemic of diabetes in nonwhite adolescents in Allegheny County, Pennsylvania? Diabetes Care. 1998 Aug;21(8):1278–1281. doi: 10.2337/diacare.21.8.1278. [DOI] [PubMed] [Google Scholar]
- 94.Robbins JM, Vaccarino V, Zhang H, Kasl SV. Socioeconomic status and type 2 diabetes in African American and non-Hispanic white women and men: evidence from the Third National Health and Nutrition Examination Survey. Am J Public Health. 2001 Jan;91(1):76–83. doi: 10.2105/ajph.91.1.76. [DOI] [PMC free article] [PubMed] [Google Scholar]
- 95.Nelson MC, Gordon-Larsen P, Song Y, Popkin BM. Built and social environments associations with adolescent overweight and activity. Am J Prev Med. 2006 Aug;31(2):109–117. doi: 10.1016/j.amepre.2006.03.026. [DOI] [PubMed] [Google Scholar]
- 96.Maty SC, Lynch JW, Raghunathan TE, Kaplan GA. Childhood socioeconomic position, gender, adult body mass index, and incidence of type 2 diabetes mellitus over 34 years in the Alameda County Study. Am J Public Health. 2008 Aug;98(8):1486–1494. doi: 10.2105/AJPH.2007.123653. [DOI] [PMC free article] [PubMed] [Google Scholar]
- 97.Hydrie MZ, Basit A, Ahmedani MY, Badruddin N, Masood MQ, Miyan Z. Comparison of risk factors for diabetes in children of different socioeconomic status. J Coll Physicians Surg Pak. 2005 Feb;15(2):74–77. [PubMed] [Google Scholar]
- 98.Economic costs of diabetes in the U.S. In 2007. Diabetes Care. 2008 Mar;31(3):596–615. doi: 10.2337/dc08-9017. [DOI] [PubMed] [Google Scholar]
- 99.Glaab LA, Brown R, Daneman D. School attendance in children with Type 1 diabetes. Diabet Med. 2005 Apr;22(4):421–426. doi: 10.1111/j.1464-5491.2005.01441.x. [DOI] [PubMed] [Google Scholar]
- 100.Wilper AP, Woolhandler S, Lasser KE, McCormick D, Bor DH, Himmelstein DU. A national study of chronic disease prevalence and access to care in uninsured U.S. adults. Ann Intern Med. 2008 Aug 5;149(3):170–176. doi: 10.7326/0003-4819-149-3-200808050-00006. [DOI] [PubMed] [Google Scholar]
- 101.Zhang X, Geiss LS, Cheng YJ, Beckles GL, Gregg EW, Kahn HS. The missed patient with diabetes: how access to health care affects the detection of diabetes. Diabetes Care. 2008 Sep;31(9):1748–1753. doi: 10.2337/dc08-0572. [DOI] [PMC free article] [PubMed] [Google Scholar]
- 102.Rewers A, Chase HP, Mackenzie T, et al. Predictors of acute complications in children with type 1 diabetes. Jama. 2002 May 15;287(19):2511–2518. doi: 10.1001/jama.287.19.2511. [DOI] [PubMed] [Google Scholar]
- 103.General OotS. Call to Action to Prevent and Decrease Overweight and Obesity. 2001 [PubMed] [Google Scholar]
- 104.U.S._Department_of_Health_and_Human_Services. Healthy People 2010: Understanding and Improving Health. 2nd. Washington, DC: U.S. Government Printing Office; 2000. [Google Scholar]
- 105.U.S._Department_of_Health_and_Human_Services_and_U.S._Department_of_Agriculture. Dietary Guidelines for Americans, 2005. 6th. Washington, D.C: U.S. Government Printing Office; 2005. [Google Scholar]
- 106.Masse LC, Frosh MM, Chriqui JF, et al. Development of a School Nutrition-Environment State Policy Classification System (SNESPCS) Am J Prev Med. 2007 Oct;33(4 Suppl):S277–291. doi: 10.1016/j.amepre.2007.07.017. [DOI] [PubMed] [Google Scholar]
- 107.GovTrack.us. S. 771–110th Congress (2007) Child Nutrition Promotion and School Lunch Protection Act of 2007. 2007 [Google Scholar]
- 108.CDC. Evaluation of a Fruit and Vegetable Distribution Program — Mississippi, 2004–05 School Year. Morbidity and Mortality Weekly Report. 2006;55(35):957–961. [PubMed] [Google Scholar]
- 109.Perry CL, Bishop DB, Taylor G, et al. Changing fruit and vegetable consumption among children: the 5-a-Day Power Plus program in St. Paul, Minnesota. Am J Public Health. 1998 Apr;88(4):603–609. doi: 10.2105/ajph.88.4.603. [DOI] [PMC free article] [PubMed] [Google Scholar]
- 110.Ayala GX, Mueller K, Lopez-Madurga E, Campbell NR, Elder JP. Restaurant and food shopping selections among Latino women in Southern California. J Am Diet Assoc. 2005 Jan;105(1):38–45. doi: 10.1016/j.jada.2004.10.023. [DOI] [PubMed] [Google Scholar]
- 111.Marcus BH, Owen N, Forsyth LH, Cavill NA, Fridinger F. Physical activity interventions using mass media, print media, and information technology. Am J Prev Med. 1998 Nov;15(4):362–378. doi: 10.1016/s0749-3797(98)00079-8. [DOI] [PubMed] [Google Scholar]
- 112.Lewis CE, Raczynski JM, Heath GW, Levinson R, Hilyer JC, Jr, Cutter GR. Promoting physical activity in low-income African-American communities: the PARR project. Ethn Dis. 1993 Spring;3(2):106–118. [PubMed] [Google Scholar]
- 113.Simon C, Wagner A, Platat C, et al. ICAPS: a multilevel program to improve physical activity in adolescents. Diabetes Metab. 2006 Feb;32(1):41–49. doi: 10.1016/s1262-3636(07)70245-8. [DOI] [PubMed] [Google Scholar]
- 114.Stone EJ, McKenzie TL, Welk GJ, Booth ML. Effects of physical activity interventions in youth. Review and synthesis. Am J Prev Med. 1998 Nov;15(4):298–315. doi: 10.1016/s0749-3797(98)00082-8. [DOI] [PubMed] [Google Scholar]
- 115.Luepker RV, Perry CL, McKinlay SM, et al. Outcomes of a field trial to improve children’s dietary patterns and physical activity. The Child and Adolescent Trial for Cardiovascular Health. CATCH collaborative group. Jama. 1996 Mar 13;275(10):768–776. doi: 10.1001/jama.1996.03530340032026. [DOI] [PubMed] [Google Scholar]
- 116.GovTrack.us. S. 1342–110th Congress 2007. Healthy Lifestyles and Prevention America Act. 2007 [Google Scholar]
- 117.Tuomilehto J, Lindstrom J, Eriksson JG, et al. Prevention of type 2 diabetes mellitus by changes in lifestyle among subjects with impaired glucose tolerance. N Engl J Med. 2001 May 3;344(18):1343–1350. doi: 10.1056/NEJM200105033441801. [DOI] [PubMed] [Google Scholar]
- 118.Knowler WC, Barrett-Connor E, Fowler SE, et al. Reduction in the incidence of type 2 diabetes with lifestyle intervention or metformin. N Engl J Med. 2002 Feb 7;346(6):393–403. doi: 10.1056/NEJMoa012512. [DOI] [PMC free article] [PubMed] [Google Scholar]
- 119.Macaulay AC, Paradis G, Potvin L, et al. The Kahnawake Schools Diabetes Prevention Project: intervention, evaluation, and baseline results of a diabetes primary prevention program with a native community in Canada. Prev Med. 1997 Nov-Dec;26(6):779–790. doi: 10.1006/pmed.1997.0241. [DOI] [PubMed] [Google Scholar]
- 120.Teufel NI, Ritenbaugh CK. Development of a primary prevention program: insight gained in the Zuni Diabetes Prevention Program. Clin Pediatr (Phila) Feb. 1998;37(2):131–141. doi: 10.1177/000992289803700211. [DOI] [PubMed] [Google Scholar]
- 121.Trevino RP, Pugh JA, Hernandez AE, Menchaca VD, Ramirez RR, Mendoza M. Bienestar: a diabetes risk-factor prevention program. J Sch Health. 1998 Feb;68(2):62–67. doi: 10.1111/j.1746-1561.1998.tb07192.x. [DOI] [PubMed] [Google Scholar]
- 122.Paradis G, Levesque L, Macaulay AC, et al. Impact of a diabetes prevention program on body size, physical activity, and diet among Kanien’keha:ka (Mohawk) children 6 to 11 years old: 8-year results from the Kahnawake Schools Diabetes Prevention Project. Pediatrics. 2005 Feb;115(2):333–339. doi: 10.1542/peds.2004-0745. [DOI] [PubMed] [Google Scholar]
- 123.Holman RR, Paul SK, Bethel MA, Matthews DR, Neil HA. 10-year follow-up of intensive glucose control in type 2 diabetes. N Engl J Med. 2008 Oct 9;359(15):1577–1589. doi: 10.1056/NEJMoa0806470. [DOI] [PubMed] [Google Scholar]
- 124.Holman RR, Paul SK, Bethel MA, Neil HA, Matthews DR. Long-term follow-up after tight control of blood pressure in type 2 diabetes. N Engl J Med. 2008 Oct 9;359(15):1565–1576. doi: 10.1056/NEJMoa0806359. [DOI] [PubMed] [Google Scholar]
- 125.Ludwig DS, Ebbeling CB. Type 2 diabetes mellitus in children: primary care and public health considerations. Jama. 2001 Sep 26;286(12):1427–1430. doi: 10.1001/jama.286.12.1427. [DOI] [PubMed] [Google Scholar]
- 126.Olson LM, Tang SF, Newacheck PW. Children in the United States with discontinuous health insurance coverage. N Engl J Med. 2005 Jul 28;353(4):382–391. doi: 10.1056/NEJMsa043878. [DOI] [PubMed] [Google Scholar]
- 127.Cassedy A, Fairbrother G, Newacheck PW. The impact of insurance instability on children’s access, utilization, and satisfaction with health care. Ambul Pediatr. 2008 Sep-Oct;8(5):321–328. doi: 10.1016/j.ambp.2008.04.007. [DOI] [PubMed] [Google Scholar]
- 128.Sommers BD. Protecting low-income children’s access to care: are physician visits associated with reduced patient dropout from Medicaid and the Children’s Health Insurance Program? Pediatrics. 2006 Jul;118(1):e36–42. doi: 10.1542/peds.2005-2685. [DOI] [PubMed] [Google Scholar]
- 129.Lave JR, Keane CR, Lin CJ, Ricci EM, Amersbach G, LaVallee CP. Impact of a children’s health insurance program on newly enrolled children. Jama. 1998 Jun 10;279(22):1820–1825. doi: 10.1001/jama.279.22.1820. [DOI] [PubMed] [Google Scholar]