

Abstract
Objectives
Processing necessary to remove immunogenic components of human nerve allograft render it acellular. Seeding allograft with supportive cells may improve axon regeneration. Little has been done to identify the best method for physically implanting cells. We aim to identify the method associated with implantation of the greatest volume and most even distribution.
Methods
Hypodermic needle injection was compared to soaking in solution under both normal and pressurized conditions after micropuncture of the allograft. Distribution within the allograft was measured using an in vitro model of fluorescent beads, as well as cultured schwann cells.
Results
Injection treatment resulted in larger volumes implanted and a more uniform cross-sectional distribution of cells and beads. Beads and cells behaved similarly relative to the measured outcomes.
Conclusions
At time zero, injection appears to instill larger cell volumes with a more uniform distribution compared to a variety of soaking techniques. In vivo testing may evaluate whether these techniques vary relative to cell survival, cell migration, and clinical outcomes. Size- and concentration-matched fluorescent beads may represent a viable model for analyzing cell implantation.
Keywords: Cold preserved processed acellular human nerve allograft, neuro-supportive cells, cell delivery, in-vitro model, microneedle
Introduction
Over the last several years, processed acellular allograft has become a viable alternative to autograft for short and moderate sized peripheral nerve defects. Though there is mounting evidence in support of this technology, the reliable working length of acellular allograft is in question.1,2 Processing of nerve allograft, a necessary step to ensure immunotolerance, maintains the in situ supportive intraneural architecture of the graft while removing debris from the endoneurial tubes. This debris includes the neurotrophic cells essential for axonal regeneration.1 Once implanted, in vivo host Schwann cells from the connecting nerve stumps repopulate the graft.3–5 Without these cells, the allograft cannot support axonal regeneration. Cells appear capable of only a finite migration into the graft. This Schwann cell senescence is felt to be a key deterrent to extended axonal regeneration in acellular nerve allograft.2
A large body of research has focused on adding neurosupportive cells to either replace or augment missing Schwann cells. These cells ideally produce nerve growth factors, guide axonal growth, and create a supportive environment.6 The most recognized for improving and lengthening neurite outgrowth are cultured Schwann cells.7,8 Schwann cells isolated, expanded, and injected into cold preserved primate allograft improve axonal regeneration.1 Schwann cells are difficult to isolate and require a long and complex culturing process.9 Stem cells derived from a variety of sources including bone marrow, adipose, and skin are easier to harvest, can differentiate into Schwann cell-like cells, and have been evaluated as possible alternatives.6, 10–13 Schwann cells, and mesenchymal stem cells derived from adipose and bone marrow all improved axon regeneration when added to acellular allograft in a rodent model.6
Regardless of which neurosupportive cell is utilized, seeding the nerve allograft is a challenge. All aforementioned studies used a hypodermic needle to inject a slurry of cells into either end of the nerve allograft, as described by Jesuraj et al.14 Intuitively, one may expect this process to result in mechanical damage to the graft’s internal architecture. Additionally, shear stress to the donor cell may substantially decrease the percentage of viable cells inoculated into the graft. This is affected by needle lumen size and the velocity of injection.14 One may additionally consider that even viable cells injected into the mid-substance of a thick nerve allograft may exist in a nutritionally deprived state, isolated from supportive diffusion of nutrients immediately after implantation.
Microneedles are fabricated out of silicon, metal, ceramic, or polymer. In clinical development for the past decade primarily for novel and less painful drug delivery, these are usually manufactured in arrays of dozens or even hundreds of microscopic spines measuring from 100 to 15,000 microns.15 Based on theoretical advantages of technical ease, minimal trauma to the internal nerve architecture, and the possibility of a more uniform distribution of the cells, we hypothesized that graft preparation with microneedle rollers prior to bathing in cell-suspension may offer an alternative technique for cell seeding. We further theorized, that bathing grafts in cell-suspension in a pressurized chamber may improve cell penetration.
Because of the resource-intensive process of culturing and testing cells in vivo, researchers would benefit from a cheap and facile in-vitro model to accurately test the physical implantation of cells within the nerve architecture. We hypothesized that fluorescent beads sized to simulate candidate cells17, 18,19 in solution could serve as a model.
Materials and Methods
Fluorescent Bead Model
Thirteen 5mm and thirteen 2mm processed human acellular nerve allografts (Advance Nerve Allograft, AxoGen Inc., Alachua Florida) were obtained and maintained in a frozen state. Grafts were cut to a standard 5.5cm and 3.5cm in length for the 5mm and 2mm groups respectively. Experimental groups were designated based on size (‘5’ or ‘2’ mm sample) and preparation technique: INJ (injected), N1 (bathed at 1 atm), N3 (bathed at 3 atm), MN1 (bathed at 1 atm after microneedle puncture), or MN3 (bathed at 3 atm after microneedle puncture). For example, a 5mm allograft that underwent microneedle puncture followed by soaking at 3 atmospheres was designated 5MN3.
Individual injected samples were sequentially allowed to thaw in 1–2ml of normal saline at room temperature for 2–3 minutes. Two marking sutures were then placed at the midpoint of each nerve. A 1% weight/volume solution of 18.0–24.9 micron (mean 20.1micron) Yellow fluorescent particles in deionized water with 0.02% Sodium Azide buffer (Catalog No. FP-20052-5, Lot No. AD01, Spherotech Inc., Lake Forest, IL) was injected from either end of the nerve sample per the methods of Jesuraj et al.14 For 2mm nerve samples, 0.100 ml total was injected (based on previous publications). To determine an equivalent injection volume for 5mm specimens, a correction factor was calculated based on the differing cross sectional areas of ideal 2mm and 5mm specimens. The volume of a cylindrical nerve can be approximated using the formula Volume = πr2 × length. The 2mm and 5mm samples differed only in cross sectional diameter (π and length constant). Thus, the ratio of radii squared ((1mm)2 : (2.5mm)2) yields a value of 6.25. Therefore, 0.625 ml total was injected in 5mm samples.
The nerve was then divided at its midpoint between marking sutures yielding two test specimens. Cross sectional tissue samples were obtained from the graft material at predetermined points (C1 and C2) as demonstrated in Figure 1. C1 and C2 segments were placed in micro centrifuge tubes and “snap” frozen by submersion within an impermeable vessel in liquid nitrogen. They were then maintained in a frozen state until sectioning.
Figure 1. Preparation of bathed samples.
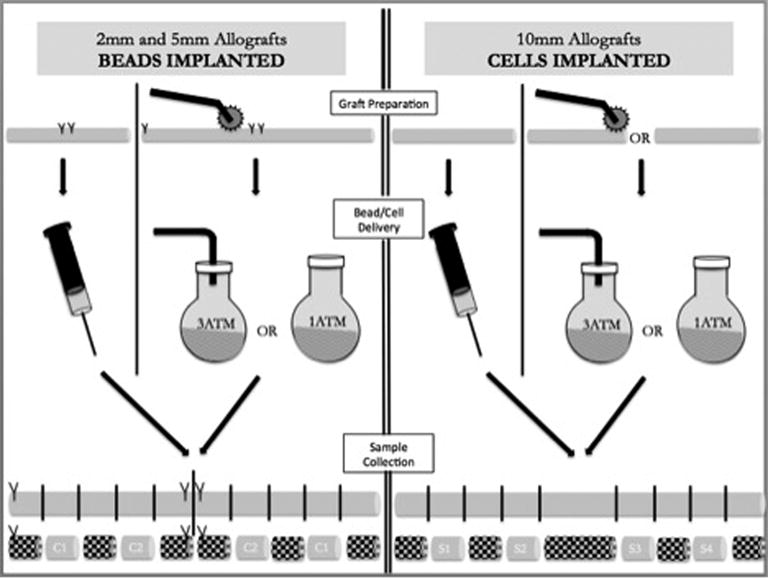
Samples bathed in “cell” suspension underwent microneedle preparation on one half of the nerve prior to bathing at either 1 or 3 atmospheres pressure. They were then removed and sectioned as displayed. Test specimens represented by ‘C1’ and ‘C2’. Shaded sections discarded.
Samples destined for bathing were marked with sutures immediately upon removal from the freezer without thawing in order to facilitate micropuncture with the microneedle roller over ½ of the nerve while in a partially frozen state. This facilitated ease of manipulation and was felt to result in a more thorough and even puncturing process against a less pliable sample based on preliminary trialing. On one half of each graft, the microneedle roller (Model No DER100, Risen Beauty Technology Co., Ltd., Beijing, China) was rolled vigorously for three passes with the roller removed and replaced between each subsequent pass. The nerve was then rolled ¼ turn and the microroller re-applied until all four sides had been punctured three times. Two millimeter and five millimeter samples were rolled with the 0.25mm and 1.5mm microneedles respectively. Specimens were then placed in 2.5ml bath of 1% weight/volume solution of 18.0–24.9 micron (mean 20.3 micron) Nile Red fluorescent particles in deionized water with 0.02% Sodium Azide buffer (Catalog No. FP-20056-5, Lot No. AD01, Spherotech Inc., Lake Forest, IL). Half of the grafts were allowed to bathe at 1ATM in a sterile plastic cup for 15 minutes with frequent manual agitation, while the remaining half were bathed in a pressure-rated round bottom glass flask (Ace Glass, Vineland, NJ) coupled to compressed air at 3ATM for 15 minutes with frequent manual agitation. At the conclusion of the bathing period, each individual sample was removed, allowed to dry for 5 minutes, sectioned according to Figure 1 and snap frozen as described above.
Frozen samples were embedded in cryo-embedding medium (HistoPrep Frozen Tissue Embedding, Catalog No. SH75125D, Fisher Scientific Company LLC, Nazareth, PA) and sectioned on the cryotome (FSE Cryostat, Thermo Scientific). A single 40-micron section was obtained from the mid-substance of C1 and C2 for each sample yielding study groups listed in Table 1.
Table 1. Summary of Experimental Treatments in Fluorescent Bead Model.
Sections excluded for inadequacy of cross section for reliable analysis. Reasons for exclusion included fractionation during sectioning, oblique section, and poor fluorescent signal detection. MN – Microneedle preparation
| Treatment Name | PNA length | Technique | PNA (n) | Cross Sections Collected (n) | Cross Sections Excluded (n) |
|---|---|---|---|---|---|
| 5INJ | 5 mm | Injection | 5 | 10 | 1 |
| 5N1 | Bath, 1 atm | 2 | |||
| 5N3 | Bath, 3 atm | 0 | |||
| 5MN1 | MN, Bath, 1 atm | 1 | |||
| 5MN3 | MN, Bath, 3 atm | 1 | |||
| 2INJ | 2 mm | Injection | 0 | ||
| 2N1 | Bath, 1 atm | 3 | |||
| 2N3 | Bath, 3 atm | 2 | |||
| 2MN1 | MN, Bath, 1 atm | 0 | |||
| 2MN3 | MN, Bath, 3 atm | 1 |
Cell Model
Schwan Cells (SCs) were purchased (Cat# R1700; ScienCell Research Laboratories, Carlsbad, CA) plated, and grown to reach the numbers required for allograft seeding. An SC isolation protocol by Kaewkhaw et al. was adapted to fit the project’s cell culture needs in order to grow large quantities.20 SC purity and viability was assessed using fluorescent antibody labeling. Once the SCs were passaged and had proliferated to a point where 1×10⁶ SC/5μL suspension of cells was available for use per allograft, they were labeled with a fluorescent tag.
All implantable SCs were labeled with 5-(and-6)-carboxyfluorescein diacetate succinimidyl ester (CFSE) marker (Molecular Probes, Inc., Eugene, OR) prior to allograft seeding and implantation. SCs were incubated for one minute in a 5μM solution of CFSE for maximum ester uptake.21 The CFSE enters the SC where it is cleaved by esterase activity and is afterwards unable to leave the SC cytosol. The SCs were incubated in CFSE solution immediately before seeding the acellular nerve allograft.
Twenty rodent acellular nerve allografts, approximately 10mm by 1.5mm, were the subject of study in this investigation. Allografts were prepared, frozen, and shipped to our facility by AxoGen, Inc. (Alachua, FL) using the same proprietary method used to prepare commercially available acellular human allograft (Avance, Axogen, Inc.). The allografts were divided into seven treatments with four allografts per experimental treatment (Table 2).
Table 2. Summary of Experimental Treatments in Cell Model.
Due to uncorrectable errors in the image rendering process, cross sections from 10N3 were excluded from the analysis. MN – Microneedle preparation
| Treatment Name | PNA length | Technique | PNA (n) | Cross Sections Collected (n) | Cross Sections Excluded (n) |
|---|---|---|---|---|---|
| 10INJ | 10 mm | Injection | 4 | 16 | 0 |
| 10N | No cells | 0 | |||
| 10N1 | Bath, 1 atm | 0 | |||
| 10N3 | Bath, 3 atm | 16 | |||
| 10MN | MN, No cells | 0 | |||
| 10MN1 | MN, Bath, 1 atm | 0 | |||
| 10MN3 | MN, Bath, 3 atm | 0 |
Allografts from the treatments characterized in Table 2 underwent similar instillation procedures with the following exceptions. Allografts were soaked in a 2.5mL bath of, or injected with 0.1mL solution of a 1×10⁶ SC/5μL suspension.48 After fixation, four sections of each sample were taken at 1mm, 3.7mm, 6.3mm, and 9mm from the end of the graft. The allografts with CFSE labeled SCs were sectioned and incubated in rabbit anti-p75 neurotrophin receptor polyclonal IgG (Promega Corp., Madison, WI) followed by Texas Red-conjugated secondary goat anti-rabbit antibody (Santa Cruz Biotechnology, Dallas TX) to detect endogenous SCs. These antibodies have different excitation/emission spectrums to allow for comparison of all SCs expressing Texas Red to the cells expressing both Texas Red and CFSE.
Microscopy and Analysis
Confocal laser scanning microscopy (LSM 710 System, Carl Zeiss Microscopy) was utilized to capture digital images of the unstained fresh frozen cross sections for analysis. Under 10× magnification, utilizing multichannel detecting and automatic stitching, the differential interference contrast microscopy (DIC) channel revealed tissue cross sections with the fluorescence detector channel overlay revealing bead/cell penetration of nerve tissue. Excitation and emission spectra for beads and cells provided by the respective manufacturers (detailed above) were utilized to configure the appropriate laser channels/wavelengths for detection of the respective beads or cells. The composite image as well as the “bead only” channel were saved as .tif files and subsequently imported to NIH ImageJ freeware (National Institutes of Health, Bethesda, MD) as an image stack for subsequent analysis. Samples were excluded if fractionated by sectioning, presented an oblique section, or inappropriate digital offset or gain complicated identification of bead signal threshold relative to nerve tissue.
Within ImageJ, each nerve section was oriented so that its long axis was aligned with either the x- or y-axis and a digital grid was established over the multi-channel image. Major and minor diameters derived from this grid were then used to calculate elliptical cross sectional area (CSA) of the cross section. The grid was divided into 4 quadrants and “inner”, “middle”, and “outer” zones as illustrated in Figure 2. To establish dimensions of the elliptical zones, the major and minor radii were divided into thirds marking cross points on the x- and y-axes for zone borders. All free beads outside the established grid were excluded from analysis. The “fluorescence only” channel image was rendered to an 8-bit image and threshold set to detect the bead or SC signal. The threshold was set automatically for the bead analysis and manually for the SC analysis (based on a small sample) and applied to all images in order to diminish user bias. By defining the area for analysis on the grid image, the bead/SC area of the entire specimen and within each defined zone was determined on the “fluorescence only” channel.
Figure 2. Image Analysis.
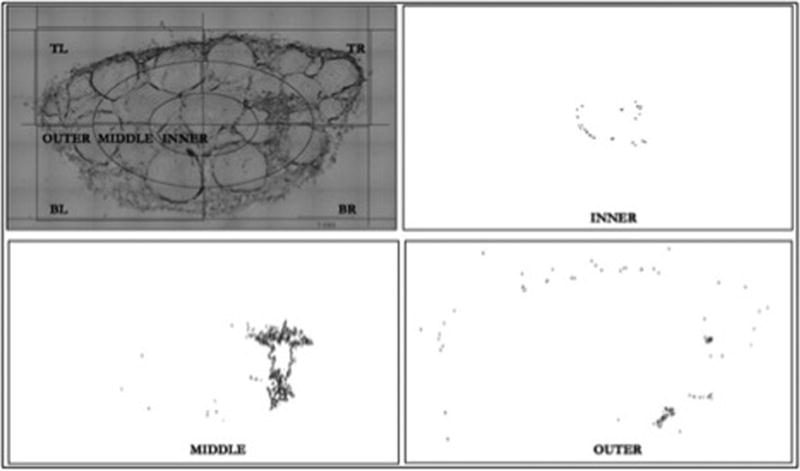
Images made binary through threshold manipulation of 8-bit image so that only the fluorescent signal of beads detectable. Grid established over the combined image channel, which was used for referencing in order to measure bead area on the fluorescent (“bead only”) channel for each subsection. Example displays zonal analysis of inner, middle, and outer zones of an injected specimen.
The total bead/SC instillation per cross section was defined as the percent area occupied by beads or SCs - calculated as the total cross sectional area of all specified fluorescence divided by the nerve CSA. Sub-quadrant and zonal analyses were undertaken in a similar fashion and percent total bead or SC area calculated for each quadrant and zone. Uniformity of distribution of beads within each cross section was calculated as the variance to mean ratio (VTMR) of bead area (Figure 3). The calculated variance (SD2) of all quadrants or zones was divided by the mean bead area per quadrant or zone to normalize the value to cross sections with varying total bead area.
Figure 3. Illustration of Quadrant and Zonal VTMR of Injected and Bathed Samples.
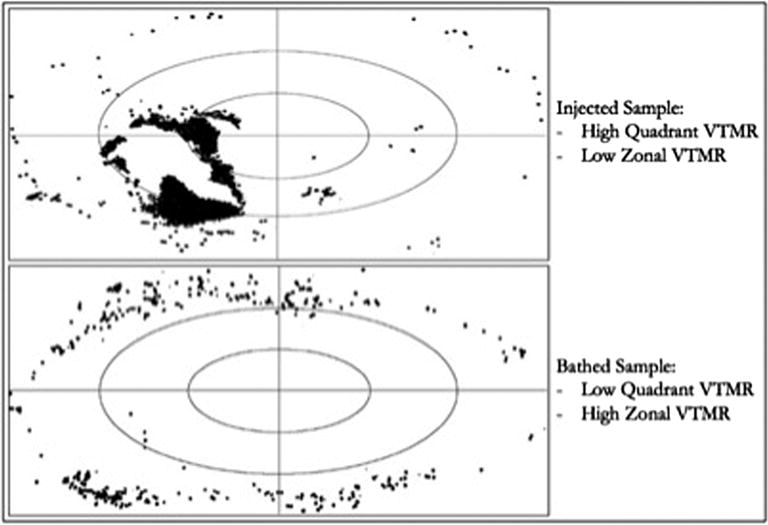
Low VTMR represents more uniform distribution of beads between quadrants/zones. Abbreviations: VTMR – Variance to Mean Ratio.
For the bead and SC experiments, all cross sections for each nerve size in each experimental treatment were then combined, tabulated, and analyzed to assess for mean percent area, mean percent bead/SC area occupying the inner/middle/outer zones, and VTMR by quadrants and zones.
Due to the varying sizes of allografts used in each analysis (Table 3), the method of instillation was compared within each group using one-way ANOVA with Tukey-Kramer post-hoc pairwise comparison. Statistical significance was set at p ≤ 0.05 to assess for differences between treatments (Prism 6, GraphPad Software, Inc.). Trends between groups were then compared.
Table 3.
Description of Groups and methods tested within each individual group.
| Group 1 (10 mm using cells) | Group 2 (5 mm using beads) | Group 3 (2 mm using beads) |
|---|---|---|
| 10MN1 | 5MN1 | 2MN1 |
| 10MN3 | 5MN3 | 2MN3 |
| 10N1 | 5N1 | 2N1 |
| ––––––––––- | 5N3 | 2N3 |
| 10MN (Control) | ––––––––––- | ––––––––––- |
| 10N (Control) | ––––––––––- | ––––––––––- |
| 10INJ | 5INJ | 2INJ |
Results
By comparison of percent cross sectional area occupied by fluorescent beads or cells within each processed nerve allograft (PNA) cross section, it was observed that injection treatment delivered more beads/cells than any other treatment group (Group 1 p<0.01, Group 3 p<0.05). No statistically significant difference in total bead/cell instillation was observed between all soaking treatments. Figure 4.
Figure 4.
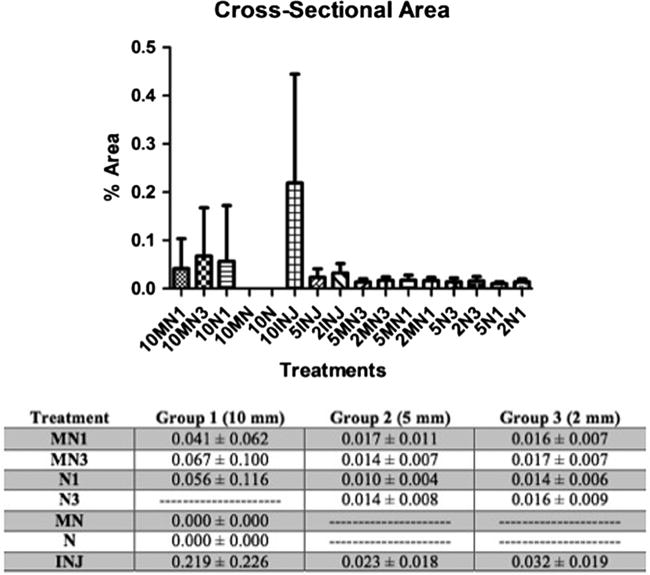
Percent Cross Sectional Area of Beads/Cells per nerve cross section. The values are means ± SD.
Injection treatment delivered a statistically significant higher proportion of total beads/cells instilled into the inner (Group 1 p<0.01, Group 2p <0.01, Group3 p<0.05) and middle (Group 1 p<0.01, Group 2 p <0.01, Group 3 p <0.01) zones compared to all other treatments. Injection treatment delivered a statistically significant smaller proportion of beads/cells into the outer zone (Group 1 p <0.01, Group 2 p <0.01, Group 3 p<0.01) compared to all other treatments. No significant differences in cell/bead distribution between inner, middle, and outer zones were observed between all soaking treatments. Figure 5.
Figure 5.
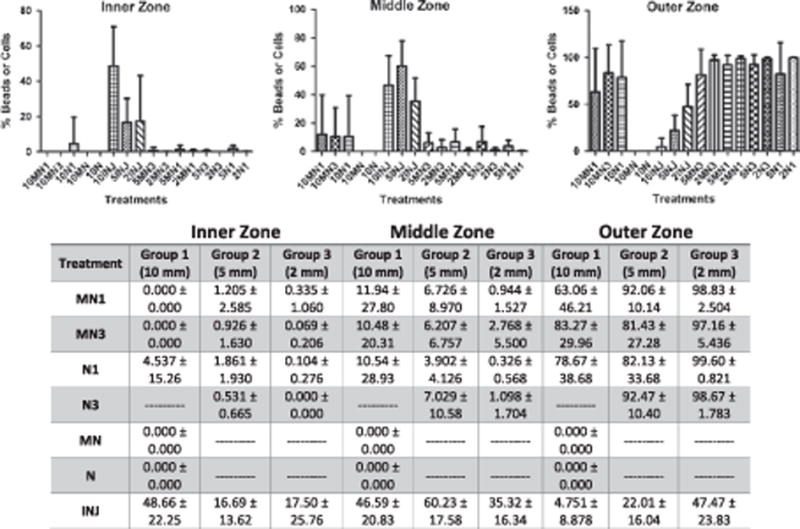
Distribution of instillation. Percent of total beads/cells per inner, middle, and outer zone. The values are means ± SD.
Processed nerve allografts treated with injection exhibited a statistically significant more uniform distribution between inner, middle, and outer zones than any other treatment based on ‘zonal variance to mean ratio (ZVTMR)’ (Group 1 p <0.01, Group 2 p<0.05, Group 3 p <0.01). By analysis of the ‘quadrant variance to mean ratio (QVTMR)’ the uniformity of distribution was less consistent between beads and cells. In the cell group (Group 1), injection treatment resulted in a more uniform distribution between quadrants compared to 10MN3 and 10N1 (not statistically significant), however in one bead group (Group 2) injection treatment exhibited a significantly less uniform distribution between quadrants than any other treatment (p<0.01). Figure 6.
Figure 6.
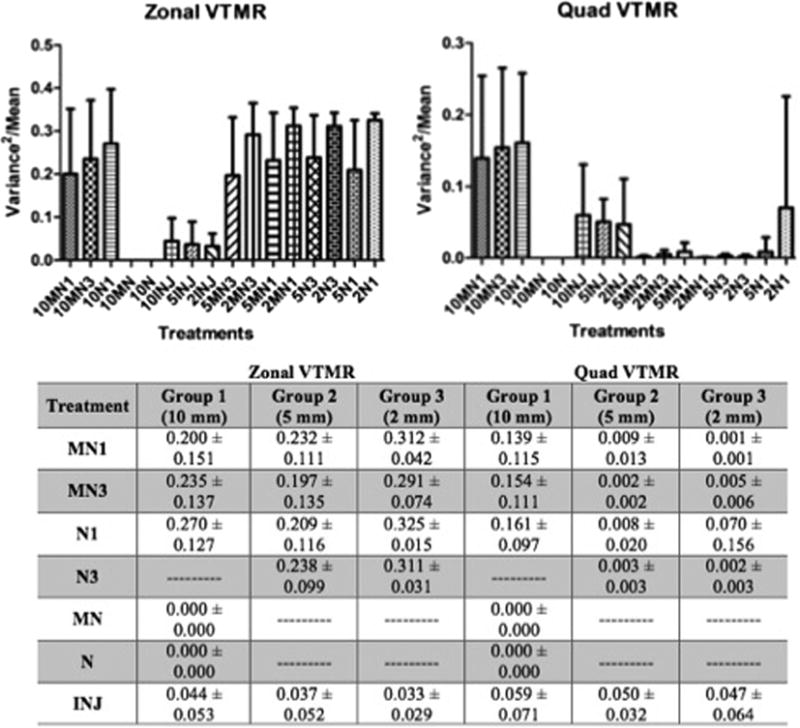
Uniformity of Distribution. Variance to mean ratio of beads/cells per zone and quadrant. The values are means ± SD.
Analysis of digital microscopic composite images of injected samples revealed bead/cell distribution typically in a clustered pattern located eccentrically within the cross section. With the exception of one sample in which intra-fascicular injection is suspected (in the bead sub-group), the beads were present within the inner epineurium in discrete large clusters with radial spread along the surrounding inner epineurium. With the exception of the single sample mentioned above, significant intra-fascicular instillation was not observed. Few instances of expansile damage to the nerve architecture were noted, though these were not associated with damage to the overall macrostructure of the nerve architecture or surrounding fascicles.
Samples bathed in solution displayed a more even circumferential distribution of beads/cells, which existed almost entirely within the outer epineurium and residual perineural tissue. Penetration beyond the outer third was rare and no discernable disparity in depth of penetration was noted between preparation or bathing techniques based on gross microscopic examination alone. No recognizable evidence of damage to the nerve structure was identified as a results of microneedle preparation.
Discussion
Seeding of cold preserved processed acellular allografts with neurosupportive cells improves graft performance in peripheral nerve repair.6–10,13 The currently employed technique of injecting cells into the graft has been associated with mixed results which may be attributable to the limitations of injection with regard to cell viability and cell survival following injection.14 Little has been published regarding alternative techniques for allograft seeding with cells. In the current study, we assess the mechanical distribution of an in vitro model of cells in solution between injection and bathing techniques.
Total bead instillation was found to be greater with injection compared to all bathing techniques. Jesuraj et al14 suggest that a threshold of cell implantation may be responsible for disparate outcomes in nerve repair with seeded grafts. Based on this understanding, injection appears to be the favored method in terms of total number of cells implanted. Patterns of physical distribution of cells within the graft, however, have not previously been considered relative to implanted cell viability and subsequent graft success.
Uniformity of distribution of cells within the nerve architecture may have biological implications in vivo. A more uniform cell population (as opposed to interspersed clusters) may provide more uniform support to growing axons and thus a better overall regeneration rate (though our model could not assess the effects of cell migration). Cell clustering may also negatively impact cell survival and proliferation since the microenvironment at the center of the cluster may be relatively deficient of nutrients and oxygen. In general, injected samples displayed more even distribution from the inner to the outer portions of the nerve. Circumferential uniformity of distribution may not be influenced by the study parameters. The practical clinical significance of this outcome has not been established.
All bathing techniques resulted in statistically significant greater proportion of beads/cells located in the outer third of the nerve allograft. Concentration in the outer third of the nerve, we postulate, may place seeded cells in a biological milieu more supportive of survival and proliferation, however in-vivo studies are required to make further conclusions in this regard. We did not assess the longitudinal distribution of beads/cells and this outcome is likely to be more variable with injection compared to bathing techniques.
When bathing methods were utilized, neither microneedle preparation nor pressurization appeared to add significantly to the quantity or depth of penetration of beads/cells within the nerve architecture. Considering the suggestion of previous authors that a critical threshold of implanted cells exists14, significant differences may potentially be elucidated biologically with in-vivo testing with cells, as a small increase in number of beads may equate to a larger and disproportionate biological effect.
The lack of a detectable effect of pressurization may be related to the fact that a significant gradient may not be established for small tissue samples with small potential intraneural space exposed globally to increased pressure. Though microneedle preparation was not associated with a difference in bead/cell penetration, in vivo testing of microneedle-prepared grafts may be worthwhile. An increased permeability of the outer epinerium to interstitial fluid might impact cell proliferation and axonal regeneration.
Within these limitations, the goals of the investigation were met. Disparities in bead/cell implantation and distribution between seeding techniques were observed. Beads are less resource intensive and appear to behave similarly to cells. Thus, beads size- and concentration-matched to candidate neurosupportive cells in solution may represent a viable low cost alternative to preliminary studies assessing the physical implantation of cells into nerve allografts.
Conclusions
At time zero, injection of neurosupportive cells into processed acellular nerve allografts appears to instill larger cell volumes with a more uniform distribution compared to a variety of bathing techniques. Size- and concentration-matched fluorescent beads may represent a viable model for cell implantation. In vivo testing must be completed to evaluate the possibility that these techniques vary with regard to cell survival, implanted and endogenous cell migration, and clinical outcomes.
Acknowledgments
Funding Details
Microscopy was performed at the VCU Department of Anatomy and Neurobiology Microscopy Facility, supported, in part, with funding from the NIH-NINDS Center core grant (5P30NS047463).
AxoGen Incorporated (Alalucha, FL) provided nerve allograft samples and fluorescent micro beads utilized for this investigation.
Biographies
Matthew J. Thompson M.D. – PGY-5 orthopaedic surgery resident who will complete orthopaedic oncology fellowship during the 2016–2017 academic year.
Gaurangkumar Patel – Lab specialist
Jonathan Isaacs M.D. – Chief, Division of Hand Surgery
John McMurtry M.D. - PGY-4 orthopaedic surgery resident who will complete hand fellowship during the 2017–2018 academic year.
Nathan Richards – Masters of Science candidate entering medical school 2016.
William Daner M.D. - PGY-5 orthopaedic surgery resident who will complete shoulder and elbow fellowship during the 2016–2017 academic year.
Footnotes
Declaration of Interests
Jonathan Isaacs M.D. has received speaking fees and contracted research support from Axogen, Incorporated. The remaining authors have no personal declarations of interest related to this work.
References
- 1.Hess JR, Brenner MJ, Fox IK, et al. Use of cold-preserved allografts seeded with autologous Schwann cells in the treatment of a long-gap peripheral nerve injury. Plast Reconstr Surg. 2007;119(1):246–259. doi: 10.1097/01.prs.0000245341.71666.97. [DOI] [PubMed] [Google Scholar]
- 2.Saheb-Al-Zamani M, Yan Y, Farber SJ, et al. Limited regeneration in long acellular nerve allografts is associated with increased Schwann cell senescence. Exp Neurol. 2013;247C:165–177. doi: 10.1016/j.expneurol.2013.04.011. [DOI] [PMC free article] [PubMed] [Google Scholar]
- 3.Fornaro M, Tos P, Geuna S, et al. Confocal imaging of Schwann-cell migration along muscle-vein combined grafts used to bridge nerve defects in the rat. Microsurgery. 2001;21(4):153–155. doi: 10.1002/micr.1029. [DOI] [PubMed] [Google Scholar]
- 4.Hayashi A, Koob JW, Liu DZ, et al. A double-transgenic mouse used to track migrating Schwann cells and regenerating axons following engraftment of injured nerves. Exp Neurol. 2007;207(1):128–138. doi: 10.1016/j.expneurol.2007.06.004. [DOI] [PMC free article] [PubMed] [Google Scholar]
- 5.Tseng CY, Hu G, Ambron RT, Chiu DT. Histologic analysis of Schwann cell migration and peripheral nerve regeneration in the autogenous venous nerve conduit (AVNC) J Reconstr Microsurg. 2003;19(5):331–340. doi: 10.1055/s-2003-42502. [DOI] [PubMed] [Google Scholar]
- 6.Wang Y, Zhao Z, Ren Z, et al. Recellularized nerve allografts with differentiated mesenchymal stem cells promote peripheral nerve regeneration. Neurosci Lett. 2012;514(1):96–101. doi: 10.1016/j.neulet.2012.02.066. [DOI] [PubMed] [Google Scholar]
- 7.Sun XH, Che YQ, Tong XJ, et al. Improving nerve regeneration of acellular nerve allografts seeded with SCs bridging the sciatic nerve defects of rat. Cell Mol Neurobiol. 2009;29(3):347–353. doi: 10.1007/s10571-008-9326-6. [DOI] [PMC free article] [PubMed] [Google Scholar]
- 8.Armstrong SJ, Wiberg M, Terenghi G, Kingham PJ. Laminin activates NF-kappaB in Schwann cells to enhance neurite outgrowth. Neurosci Lett. 2008;439(1):42–46. doi: 10.1016/j.neulet.2008.04.091. [DOI] [PubMed] [Google Scholar]
- 9.Bell JH, Haycock JW. Next generation nerve guides: materials, fabrication, growth factors, and cell delivery. Tissue engineering Part B, Reviews. 2012;18(2):116–128. doi: 10.1089/ten.TEB.2011.0498. [DOI] [PubMed] [Google Scholar]
- 10.Hu J, Zhu QT, Liu XL, Xu YB, Zhu JK. Repair of extended peripheral nerve lesions in rhesus monkeys using acellular allogenic nerve grafts implanted with autologous mesenchymal stem cells. Exp Neurol. 2007;204(2):658–666. doi: 10.1016/j.expneurol.2006.11.018. [DOI] [PubMed] [Google Scholar]
- 11.Wang D, Liu XL, Zhu JK, et al. Repairing large radial nerve defects by acellular nerve allografts seeded with autologous bone marrow stromal cells in a monkey model. J Neurotrauma. 2010;27(10):1935–1943. doi: 10.1089/neu.2010.1352. [DOI] [PubMed] [Google Scholar]
- 12.di Summa PG, Kalbermatten DF, Pralong E, Raffoul W, Kingham PJ, Terenghi G. Long-term in vivo regeneration of peripheral nerves through bioengineered nerve grafts. Neuroscience. 2011;181:278–291. doi: 10.1016/j.neuroscience.2011.02.052. [DOI] [PubMed] [Google Scholar]
- 13.Walsh S, Biernaskie J, Kemp SW, Midha R. Supplementation of acellular nerve grafts with skin derived precursor cells promotes peripheral nerve regeneration. Neuroscience. 2009;164(3):1097–1107. doi: 10.1016/j.neuroscience.2009.08.072. [DOI] [PubMed] [Google Scholar]
- 14.Jesuraj NJ, Santosa KB, Newton P, et al. A systematic evaluation of Schwann cell injection into acellular cold-preserved nerve grafts. J Neurosci Methods. 2011;197(2):209–215. doi: 10.1016/j.jneumeth.2011.02.015. [DOI] [PMC free article] [PubMed] [Google Scholar]
- 15.Kim YC, Park JH, Prausnitz MR. Microneedles for drug and vaccine delivery. Advanced drug delivery reviews. 2012;64(14):1547–1568. doi: 10.1016/j.addr.2012.04.005. [DOI] [PMC free article] [PubMed] [Google Scholar]
- 16.McAllister DV, Wang PM, Davis SP, et al. Microfabricated needles for transdermal delivery of macromolecules and nanoparticles: fabrication methods and transport studies. Proc Natl Acad Sci U S A. 2003;100(24):13755–13760. doi: 10.1073/pnas.2331316100. [DOI] [PMC free article] [PubMed] [Google Scholar]
- 17.Lo Surdo JL, Millis BA, Bauer SR. Automated microscopy as a quantitative method to measure differences in adipogenic differentiation in preparations of human mesenchymal stromal cells. Cytotherapy. 2013;15(12):1527–1540. doi: 10.1016/j.jcyt.2013.04.010. [DOI] [PMC free article] [PubMed] [Google Scholar]
- 18.Lo Surdo J, Bauer SR. Quantitative approaches to detect donor and passage differences in adipogenic potential ad clonogenicity in human bone marrow-derived mesenchymal stem cells. Tissue engineering Part C, Methods. 2012;18(11):877–889. doi: 10.1089/ten.tec.2011.0736. [DOI] [PMC free article] [PubMed] [Google Scholar]
- 19.Carlsen F, Knappeis GG, Behse F. Schwann cell length in unmyelinated fibres of human sural nerve. J Anat. 1974;117(Pt 3):463–467. [PMC free article] [PubMed] [Google Scholar]
- 20.Kaewkhaw R, Scutt AM, Haycock JW. Integrated culture and purification of rat Schwann cells from freshly isolated adult tissue. Nat Protoc. 2012;7(11):1996–2004. doi: 10.1038/nprot.2012.118. [DOI] [PubMed] [Google Scholar]
- 21.Li X, Dancausse H, Grijalva I, et al. Labeling Schwann cells with CFSE-an in vitro and in vivo study. J Neurosci Methods. 2003;125(1–2):83–91. doi: 10.1016/s0165-0270(03)00044-x. [DOI] [PubMed] [Google Scholar]
- 22.Sun XH, Che YQ, Tong XJ, et al. Improving Nerve Regeneration of Acellular Nerve Allografts Seeded with SCs Bridging the Sciatic Nerve Defects of Rat. Cell Mol Neurobiol. 2009;29(3):347–353. doi: 10.1007/s10571-008-9326-6. [DOI] [PMC free article] [PubMed] [Google Scholar]