Abstract
Background:
The global prevalence of type 2 diabetes continues to rise. Interest has been increasing recently in noninvasive diagnostic procedure. Hence, an attempt has been made by the present study to analyze the changes in cytomorphometry in exfoliated buccal and gingival mucosa cells in type 2 diabetic patients.
Aim:
The aim of this study was to analyze the cytomorphometric changes in exfoliated cells of gingiva and buccal mucosa as an adjunct to diagnosis of diabetes.
Materials and Methods:
In the present study, fifty known type 2 diabetic patients were taken as study group, and the control group was comprised of fifty healthy individuals. Smear was prepared from buccal mucosa and gingival epithelium of both study and control groups and was stained by rapid Papanicolaou (Pap) stain. Stained smears were subjected to cytomorphometric analysis using Lynx Biolux (Lawrence and Mayo) image analysis software. In each Pap smear, 100 cells were evaluated for nuclear area (NA), cytoplasmic area (CA) and cytoplasm to nuclear ratio (CNR).
Results:
Mean NA was significantly higher (P < 0.05) in study group whereas mean CA did not exhibit any statistically significant difference (P > 0.05). The mean CNR was significantly lower in the study group (P < 0.05).
Conclusion:
This study contributes to the general understanding of the alterations in the cellular pattern of buccal and gingival mucosa cells in diabetic patients and can be used as an additional tool to aid in the evaluation of oral mucosal alterations in diabetes mellitus.
Keywords: Cytomorphometry, diabetes mellitus, exfoliative cytology
INTRODUCTION
Diabetes is certain to be one of the most challenging health problems in the 21st century.[1] The term diabetes mellitus (DM) describes a metabolic disorder of multiple etiology characterized by chronic hyperglycemia with disturbances of carbohydrate, fat and protein metabolism resulting from defects in insulin secretion, insulin action, or both.[2]
According to World Health Organization, some 382 million people worldwide, or 8.3% of adults, are estimated to have diabetes in 2013. About 80% live in low- and middle-income countries. If these trends continue, by 2035, some 592 million people, or one adult in ten, will have diabetes.[3]
Type 2 DM is a heterogeneous group of disorder usually characterized by variable degrees of insulin resistance, impaired insulin secretion and increased glucose production.[4] Several soft tissue abnormalities have been reported to be associated with DM in the oral cavity. These complications include periodontal diseases (periodontitis and gingivitis), salivary dysfunction leading to a reduction in salivary flow and changes in saliva composition and taste dysfunction. Periodontal diseases have been proposed as the sixth most prevalent complication of DM following the other diabetic complications. Oral fungal and bacterial infections have also been reported in patients with diabetes.[5] Tissue repair is damaged, and dysfunction of the oral mucosa occurs due to alterations in salivary flow and constituents, changes in nutrition, reduced immune defences leading to changes in microbial oral flora & a greater tendency to infection.[6]
In diabetes, changes in blood glucose and the disease itself reduce the viability of invasive techniques such as incisional or excisional biopsy for evaluation of oral mucosal changes. Accordingly, exfoliative cytology which is a straight forward and noninvasive diagnostic method can be considered as more practical technique to evaluate the oral mucosa in diabetes.[6]
With the advancement in the field of quantitative exfoliative cytology, oral exfoliative cytology has come out as a powerful diagnostic tool. It is a nonaggressive technique and easily accepted by the patients. Therefore, it can be a very good option for the early diagnosis of epithelial atypia, oral cancer and squamous cell carcinoma. After recent advancements, planimeters are replaced by semiautomatic image analysis techniques, which give faster, more accurate and more reproducible results. Modern image analysis software can encompass morphometry, densitometry, neural network and expert system with better accuracy and in a very less time period.[7]
Studies have shown morphological changes in the oral epithelial cells in diabetics, with significant results when compared to healthy controls. In the present study, we have made an attempt to study cytologic changes using morphometric analysis in the exfoliated cells of gingiva and buccal mucosa of normal controls and type 2 diabetic patients which can be used as an adjunct to diagnosis of diabetes.
MATERIALS AND METHODS
In the present study, fifty known type 2 diabetic patients were taken as study group, and the control group was comprised of fifty healthy individuals. Patients were considered as diabetic when the fasting blood sugar (FBS) level was ≥126 mg/dl (as per American Diabetic Association criteria for the diagnosis of DM), whereas patients with FBS levels <110 mg/dl were considered normal.
For the preparation of smears, clean, fresh and dry glass slides were used. The smear was taken from buccal mucosa and gingiva of both study and control groups and spread over a large area preventing clumping of cells. The slides were immediately sprayed with Biofix™ spray fixative to ensure proper fixation. Smear was then stained as per rapid Papanicolaou (Pap) staining technique. Slides were observed under microscope.
The images were captured using complementary metal oxide semiconductor camera which is attached to research microscope. The Pap-stained smears were subjected to cytomorphometric analysis using Lynx Biolux (Lawrence and Mayo) image analysis software shown in Figure 1. The final images captured, had a magnification of ×400 on the monitor. One hundred unfolded cells with clear outline and predominant staining in each prepared smear were selected in a stepwise manner moving the microscope stage from left to right and then down and across in order to avoid measuring the same cell again. Images of Pap-stained cytological smear representative of buccal and gingival cells of both study and control groups are shown in Figures 2 and 3.
Figure 1.
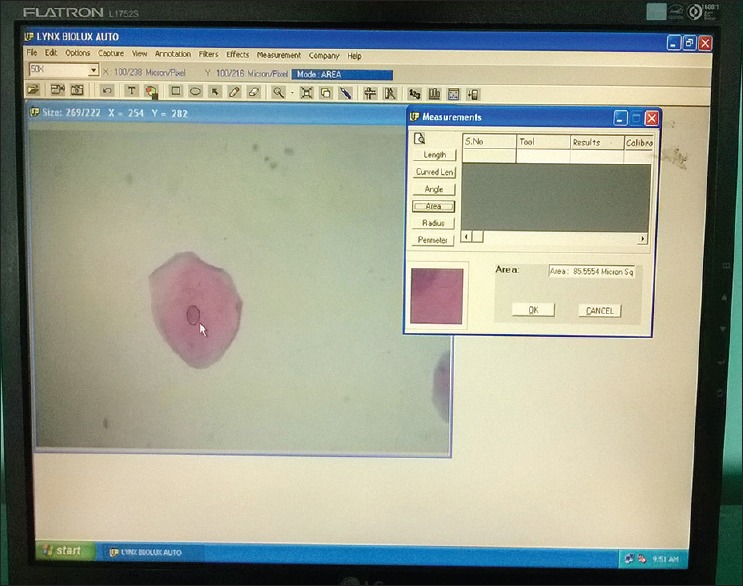
Screen-shot demonstrating the measurement of nuclear area using computer image analysis software
Figure 2.
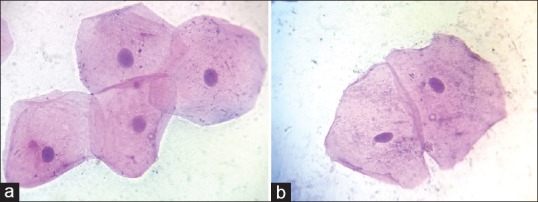
(a) Pap-stained cytological smear representative of diabetic group buccal cells (×100), (b) Pap-stained cytological smear representative of normal healthy control group buccal cells (×100)
Figure 3.
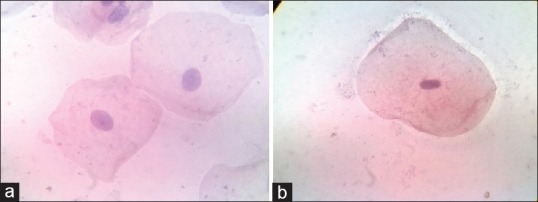
(a) Pap-stained cytological smear representative of diabetic group gingival cells (×100). (b) Pap-stained cytological smear representative of normal control group gingival cells (×100)
Cell area was measured in square microns (μm2). For measurements, the cell boundary was traced with digitalized cursor using interactive measurement tool, and the software automatically calculated the cell area. Nuclear area (NA) was measured in square micron (μm2) automatically on tracing the nuclear boundary. Cytoplasmic area (CA) was calculated by using the formula: CA = Cell area – NA. Cytoplasm to nuclear ratio (CNR) was another parameter calculated by using the formula: CNR = CA/NA.
RESULTS
Student's unpaired t-test was used for comparing the mean NA, CA and CNR between the study and control group from two different sites. Several proportions such as age and gender were compared using Chi-square test.
The result of the present study showed that NA of the exfoliated cells from the buccal mucosa of study group ranged from 72.83 to 117.73 μm2 with a mean value of 92.57 ± 10.12 μm2. In control group, the NA ranged from 62.13 to 95.51 μm2 with a mean value of 83.63 ± 8.35 μm2 [Table 1 and Graph 1].
Table 1.
Comparison of cytoplasmic area, nuclear area and cytoplasmic area/nuclear area ratio of buccal cells (μm2) in both the groups

Graph 1.
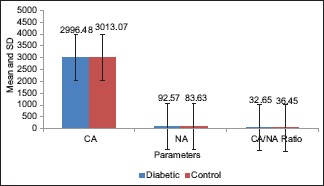
Comparison of cytoplasmic area, nuclear area and cytoplasmic area/nuclear area ratio of buccal cells (μm2) in both the groups
Furthermore, the result of the present study showed that NA of the exfoliated cells from the gingiva of study group ranged from 75.63 to 120.84 μm2 with a mean value of 93.58 ± 12.40 μm2. In control group, the NA ranged from 58.12 to 97.65 μm2 with a mean value of 82.80 ± 9.25 μm2 [Table 2 and Graph 2]. On statistical analysis, significant difference was found in mean values between the two groups (P < 0.05).
Table 2.
Comparison of cytoplasmic area, nuclear area and cytoplasmic area/nuclear area ratio of gingival cells (μm2) in both the groups

Graph 2.
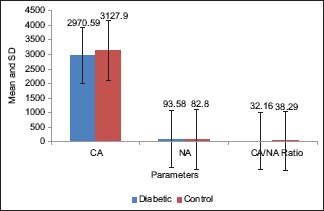
Comparison of cytoplasmic area, nuclear area and cytoplasmic area/nuclear area ratio of gingival cells (μm2) in both the groups
The CA of the exfoliated cells from the buccal mucosa of the study group showed a mean value of 2996.48 ± 399.42 μm2. In control group, the CA had a mean value of 3013.07 ± 440.79 μm2 [Table 1 and Graph 1].
Moreover, the CA of the exfoliated cells from the gingiva of the study group showed a mean value of 2970.59 ± 421.25 μm2. In control group, the CA had a mean value of 3127.90 ± 425.85 μm2 [Table 2 and Graph 2]. On statistical analysis of both buccal and gingival sites, the difference in mean CA between the two groups was not significant (P > 0.05).
The CNR of the exfoliated cells from the buccal mucosa of the study group showed a mean value of 32.65 ± 4.96 whereas in control group, the CNR had a mean of 36.45 ± 6.93 [Table 1 and Graph 1]. Moreover, the CNR of the exfoliated cells from the gingiva of the study group showed a mean value of 32.16 ± 5.59 whereas in control group, the CNR had a mean of 38.29 ± 7.13 [Table 2 and Graph 2]. On statistical analysis from both the sites, significant difference was found in the mean values of CNR between the two groups (P < 0.05).
DISCUSSION
DM is a syndrome characterized by abnormal carbohydrate, fat and protein metabolism that results in acute or chronic complications due to absolute or relative lack of insulin.[8]
Several studies have examined the deleterious effects of DM on oral mucosa with reports stating its adverse effects on the morphology of oral mucosa, which in turn may compromise tissue function to favor the occurrence of oral infections and oral neoplasia.[9,10] In diabetes, there is a loss of oxidation equilibrium, whereby the activities of the antioxidant scavengers and enzymes are depressed by elevated glucose concentration, excessive formation of free radicals and protein glycation. These noxious processes can cause serious damage to the biological structures at a molecular level which can be appreciated by oral exfoliative cytology.
Hence, the present study was done to analyze the cytomorphometric changes in exfoliated cells of gingiva and buccal mucosa as an adjunct to diagnosis of diabetes.
The present study showed an increase in NA, but CA did not present statistically significant difference whereas the CNR was diminished significantly in diabetics. These results were inconsistent with the studies done by Alberti et al.,[11] Shareef et al.,[12] Prasad et al.,[13] Sonawane et al.[14] and Suvarna et al.[15]
Increase in NA in the buccal mucosa of type 2 diabetic patient could be due to delay in keratinization process caused by decreased cellular turnover. In diabetics, the glycation of proteins, lipids and nucleic acid increases with sustained hyperglycemia causing much greater accumulation of advanced glycation end products in the walls of large vessels as well as basement membrane of microvasculature. The effect of this is a progressive narrowing of vessel lumen, decreased perfusion of affected tissues and decreased turnover which may cause delay in keratinization process of the epithelium. This delay in the differentiation process of epithelium leads to increase in the cells which present a large nucleus as a primary characteristic.[6,11]
Diabetic patients also suffer from dehydration due to the decreased salivary flow rates that may lead to mucosal atrophy. Hence, when smears from atrophic oral mucosa are made, the larger basal/spinous cells are inadvertently included in the sample. Thus, the primary pattern encompasses nonkeratinized cells of parabasal layers which are smaller in cell size but have relatively larger nuclei, thus giving an impression of nuclear enlargement, with or without pleomorphism.[16]
Other possible hypothesis for explaining the increase in mean NA is as follows: an increased glucose level directly favors cell growth because of its pivotal role in metabolic processes. An actively growing cell is characterized by a prominent and large nucleus.[15]
The preservation of CA in the diabetic group may be a compensatory mechanism to maintain the cell function in stress conditions such as DM. It can be explained on the fact that in a cell, the enzymes that are normally inactive often can be activated when needed. As previously mentioned, there is decreased perfusion of affected tissues and decreased turnover, and the cell may remain in a stressful situation. When most of the adenosine triphosphate (ATP) has been depleted in the cell, a considerable amount of cyclic adenosine monophosphate (c-AMP) is found as a breakdown product of ATP. The presence of this c-AMP in turn immediately activates the glycogen-splitting enzyme and phosphorylase-liberating glucose molecule that is rapidly metabolized to provide energy which is used for replenishment of ATP stores. The c-AMP acts as an enzyme activator for phosphorylase and control intracellular ATP concentration, thus maintaining the functions even in stressful condition. In this way, constant cross-feed between the synthetic systems results in almost equal amount of substance in the cell at all times. The enzyme system can either be activated or inhibited according to the need of the cell. This regulatory mechanism most often functions as feedback control system that continuously monitors the cell biochemical composition and makes correction as needed even in adverse condition.[17]
CONCLUSION
There is increase in nuclear parameters, decrease in cytoplasmic parameters and decrease in the ratio of cytoplasmic to nuclear parameters in smears from diabetics as compared to normal controls. This study thus contributes to the general understanding of the alterations in the cellular pattern of buccal and gingival mucosa cells in diabetic patients and can be used as an additional tool to aid in the evaluation of oral mucosal alterations in DM. Further prospective studies have to be conducted with a larger sample size, and comparison with controlled and uncontrolled diabetes causing cytomorphometric changes is necessary to determine the predictive value of this method.
Financial support and sponsorship
Nil.
Conflicts of interest
There are no conflicts of interest.
REFERENCES
- 1.Richard S, Jonathan S, Paul Z. The global burden diabetes and impaired glucose tolerance. IDF Diabetes Atlas. 4th ed. Brussels Belgium: Baker ID Heart and Diabetes Institute; 2013. [Google Scholar]
- 2.Alberti KG, Aschner P. World Health Organization: Definition, Diagnosis and Classification of Diabetes Mellitus and its Complications: Report of a WHO/IDF Consultation. Geneva: World Health Organization; 1999. [Google Scholar]
- 3.Aguirre F, Brown A, Cho NH, Dahlquist G. International Diabetes Federation Diabetes Atlas. 6th ed. 2013. Available from: http://www.idf.org/diabetesatlas .
- 4.Powers AC. Diabetes mellitus. In: Longo DL, Fauci AS, Kasper DL, Hauser SL, Jameson JL, Loscalzo J, editors. Harrisons Principles of Internal Medicine. 18th ed. New York: McGraw Hill Company; 2012. pp. 2968–3002. [Google Scholar]
- 5.Al-Maskari AY, Al-Maskari MY, Al-Sudairy S. Oral manifestations and complications of diabetes mellitus – A review. Oman Med J. 2011;11:179–86. [PMC free article] [PubMed] [Google Scholar]
- 6.Jajarm HH, Mohtasham N, Moshaverinia M, Rangiani A. Evaluation of oral mucosa epithelium in type II diabetic patients by an exfoliative cytology method. J Oral Sci. 2008;50:335–40. doi: 10.2334/josnusd.50.335. [DOI] [PubMed] [Google Scholar]
- 7.Ogden GR, Cowpe JG, Wight AJ. Oral exfoliative cytology: Review of methods of assessment. J Oral Pathol Med. 1997;26:201–5. doi: 10.1111/j.1600-0714.1997.tb01224.x. [DOI] [PubMed] [Google Scholar]
- 8.Ship JA. Diabetes and oral health: An overview. J Am Dent Assoc. 2003;134:4S–10S. doi: 10.14219/jada.archive.2003.0367. [DOI] [PubMed] [Google Scholar]
- 9.Auluck A. Diabetes mellitus: An emerging risk factor for oral cancer? J Can Dent Assoc. 2007;73:501–3. [PubMed] [Google Scholar]
- 10.Acha A, Ruesga MT, Rodríguez MJ, Martínez de Pancorbo MA, Aguirre JM. Applications of the oral scraped (exfoliative) cytology in oral cancer and precancer. Med Oral Patol Oral Cir Bucal. 2005;10:95–102. [PubMed] [Google Scholar]
- 11.Alberti S, Spadella CT, Francischone TR, Assis GF, Cestari TM, Taveira LA. Exfoliative cytology of the oral mucosa in type II diabetic patients: Morphology and cytomorphometry. J Oral Pathol Med. 2003;32:538–43. doi: 10.1034/j.1600-0714.2003.00162.x. [DOI] [PubMed] [Google Scholar]
- 12.Shareef BT, Ang KT, Naik VR. Qualitative and quantitative exfoliative cytology of normal oral mucosa in type 2 diabetic patients. Med Oral Patol Oral Cir Bucal. 2008;13:E693–6. [PubMed] [Google Scholar]
- 13.Prasad H, Ramesh V, Balamurali P. Morphologic and cytomorphometric analysis of exfoliated buccal mucosal cells in diabetes patients. J Cytol. 2010;27:113–7. doi: 10.4103/0970-9371.73291. [DOI] [PMC free article] [PubMed] [Google Scholar]
- 14.Sonawane K, Jain S, Gupta I, Karthik BV, Singaraju S, Singaraju M. Cytomorphometric analysis of oral mucosa in diabetic patients in Bhopal region an in situ study. Int J Clin Dent Sci. 2011;2:12–5. [Google Scholar]
- 15.Suvarna M, Anuradha C, Kumar KK, Shekhar PC, Chandra KL, Reddy BV. Cytomorphometric analysis of exfoliative buccal cells in type II diabetic patients. J NTR Univ Health Sci. 2012;1:33–7. [Google Scholar]
- 16.Nandita KP, Boaz K, Srikant N, Lewis AJ, Manaktala N. Oral epithelium in diabetics: A cytomorphometric correlation. Dent Hypotheses. 2014;5:59–65. [Google Scholar]
- 17.Guyton AC, Hall E, editors. Textbook of Medical Physiology. 11th ed. Philadelphia: Elsevier Saunders; 2006. [Google Scholar]


