Abstract
Watching a single molecule move on its intrinsic time scale—one of the central goals of modern nanoscience—calls for measurements that combine ultrafast temporal resolution1–8 with atomic spatial resolution9–30. Steady-state experiments achieve the requisite spatial resolution, as illustrated by direct imaging of individual molecular orbitals using scanning tunnelling microscopy9–11 or the acquisition of tip-enhanced Raman and luminescence spectra with sub-molecular resolution27–29. But tracking the dynamics of a single molecule directly in the time domain faces the challenge that single-molecule excitations need to be confined to an ultrashort time window. A first step towards overcoming this challenge has combined scanning tunnelling microscopy with so-called ‘lightwave electronics”1–8, which uses the oscillating carrier wave of tailored light pulses to directly manipulate electronic motion on time scales faster even than that of a single cycle of light. Here we use such ultrafast terahertz scanning tunnelling microscopy to access a state-selective tunnelling regime, where the peak of a terahertz electric-field waveform transiently opens an otherwise forbidden tunnelling channel through a single molecular state and thereby removes a single electron from an individual pentacene molecule’s highest occupied molecular orbital within a time window shorter than one oscillation cycle of the terahertz wave. We exploit this effect to record ~100 fs snapshot images of the structure of the orbital involved, and to reveal through pump-probe measurements coherent molecular vibrations at terahertz frequencies directly in the time domain and with sub-angstrom spatial resolution. We anticipate that the combination of lightwave electronics1–8 and atomic resolution of our approach will open the door to controlling electronic motion inside individual molecules at optical clock rates.
We investigate the π-conjugated organic molecule pentacene with low-current9, low-temperature terahertz scanning tunnelling microscopy18 (THz-STM). This involves focusing the electric field of a phase-stable, single-cycle THz waveform7,8 onto the STM junction and thereby adding to the electric potential across it, resulting in an ultrafast modulation of the applied bias voltage. To preserve the inherent electric properties of pentacene, the molecules are adsorbed on monolayer islands of NaCl that decouple them from the underlying Au(110) surface9 (Fig 1a; see Methods for further details of sample preparation and microscope setup).
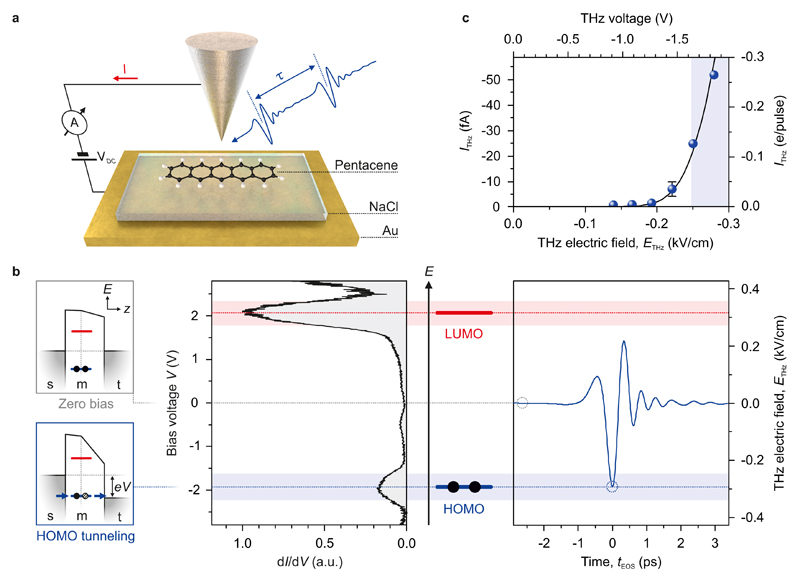
Figure 1. Ultrafast THz-induced tunnelling of a single electron out of a single molecule.
a, Schematic of our experimental setup. Two THz pulses separated by a variable delay time τ are coupled into the STM junction, which consists of a tungsten tip and a pentacene molecule decoupled from the Au(110) substrate by a monolayer NaCl film. The net current produced by the THz pulses was measured as a shift in the DC tunnel current, I. Bias voltages refer to the metal substrate with respect to the tip. Likewise, positive currents correspond to electrons tunnelling from the tip into the sample. b, Concept of steady-state and ultrafast tunnelling out of the HOMO of a single molecule. For low bias voltages, tunnelling electrons cannot access the molecular resonances (far left, top). In contrast, for voltages exceeding the LUMO or HOMO transport levels, sequential tunnelling sets in (far left, bottom). s: Au substrate; m: molecule; t: tip. Sequential tunnelling results in peaks in the steady-state differential conductance (dI/dV, centre). In the dynamic case, the THz pulse acts as an ultrafast voltage transient (right). Here, the steady-state bias is VDC = 0 and the THz peak field reaches the HOMO but not the LUMO, giving rise to state-selective sequential tunnelling through the HOMO. The waveform (blue curve) is the electro-optically measured far-field trace used in the experiment. c, THz-induced tunnel current out of a single pentacene molecule on monolayer NaCl as a function of THz field strength, showing the onset of electron tunnelling out of the HOMO (VDC = 0 V). Rescaling the time-average current (left axis) to electrons tunnelled per THz pulse (right axis, see Methods) reveals currents of less than 1 electron / pulse. Under the assumption that the THz electric field results in a voltage transient with a scaling factor determined by the tip-enhancement of the field (see Extended Data Figure 3), the onset of THz-induced current is well reproduced (solid line). The error bar indicates the standard deviation from the fit.
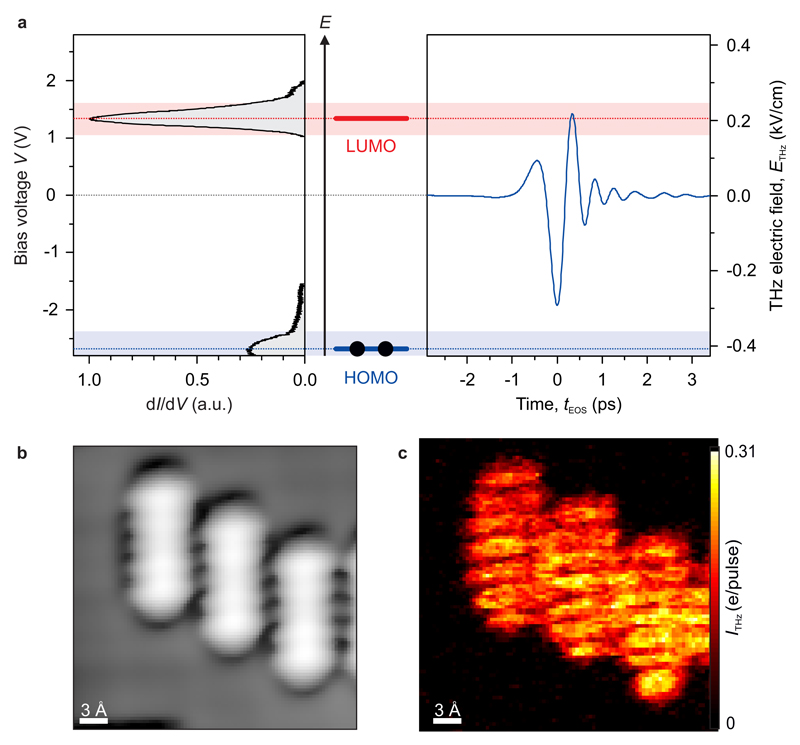
Fig. 1b depicts the novel energy-selective tunnelling regime at the heart of this study. It builds on the orbital-specific tunnelling of conventional STM enabled by the use of insulating films9, where the double-barrier (salt, vacuum) geometry leads to two very distinct tunnelling mechanisms (Fig. 1b, left). For low bias voltages, tunnelling electrons cannot access molecular orbitals and must tunnel between the tip and metal substrate in a single step. But once the voltage reaches a threshold so that either the lowest unoccupied molecular orbital (LUMO) or the highest occupied molecular orbital (HOMO) is inside the bias voltage window, the electron will localize in the corresponding molecular state after having tunnelled through the first and before tunnelling through the second barrier. The alignment of the LUMO or HOMO transport level with the Fermi energy of the tip thus opens up a new tunnelling channel, and consequently appears as a peak in the differential conductance (Fig. 1b, centre).
To understand how this situation enables a new regime in THz-STM, we now consider the dynamic analogue of this process, where a THz pulse replaces the steady-state bias (Fig. 1b, right). Light-matter interactions with intense THz fields are often characterized by different competing quantum effects4–6, occurring at the crossover of the photon versus classical-field regimes. The semi-classical picture discussed in the following is justified by the experimental results presented further below, but cannot be assumed a priori. To facilitate the discussion, however, we will introduce the new regime directly in the context of this picture, in which the THz waveform is viewed as a transient bias voltage and hence a transient modification to the level alignment of the system. Thus, it is expected to temporarily open an otherwise forbidden tunnelling channel through the HOMO when the peak of the waveform matches the corresponding transport level. This concept of THz-induced sequential tunnelling has the potential to yield optimally short current responses that are ultimately limited only by the linewidth of the resonance. Moreover, the asymmetry of the THz waveform should allow us to drive tunnelling out of the HOMO without accessing the LUMO, and create a unipolar current burst with a duration defined by the width of the THz waveform crest. Finally, we note that sensitivity to rectified currents below one electron per THz pulse is a prerequisite to explore this new ultrafast state-selective tunnelling regime. In the experiment, we position the STM tip over a pentacene molecule, turn off the STM feedback loop as well as the bias voltage, and measure the net THz-induced tunnel current through the molecule as a function of the THz peak field. We observe a rectified current onset in the negative bias direction (Fig. 1c) and currents approaching one electron per THz pulse. The threshold peak field is about 0.25 kV/cm, corresponding – due to the large field enhancement at the tip – to a peak bias voltage of about -1.65 V.
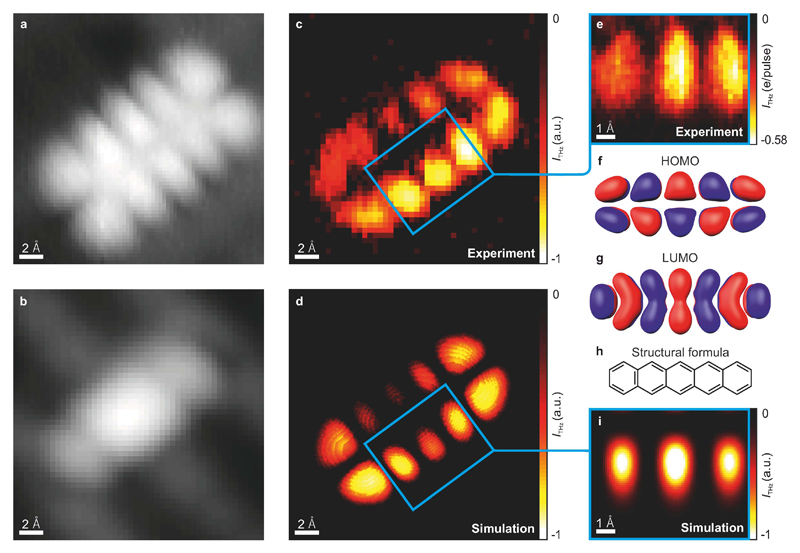
The ultimate test of whether this signal is due to THz-induced sequential tunnelling is the spatial distribution of the rectified current. Steady-state STM imaging with the bias set to the HOMO transport level directly reveals the HOMO density contours of the free molecule9. Figure 2a shows such a steady-state, constant-current STM image of a pentacene molecule recorded at a voltage near the HOMO level (bias voltage, VDC = -1.7 V), and features the ten lobes of the HOMO protruding towards the tip9. In contrast, these lobes are absent from the steady-state STM image when the bias voltage window does not include a molecular resonance (shown in Fig. 2b, VDC = +6 mV) and only one-step tunnelling is permitted. The THz-STM image recorded simultaneously, however, differs dramatically (Fig. 2c). It clearly shows ten lobes in the spatial distribution of the rectified current, and is strikingly similar to the HOMO density, indicating that the THz waveform indeed drives tunnelling through the HOMO. The contrast between the lobes of the HOMO even appears sharper in the THz-STM image than in the conventional image.
Figure 2. Ultrafast THz-STM imaging of a pentacene molecular orbital.
a, Steady-state, constant-current STM image of the HOMO at VDC = -1.7 V and I = 0.83 pA. Greyscale range = 2.3 Å. b, Steady-state STM image at VDC = 6 mV and I = 2.2 pA. The Au(110) missing-row reconstruction beneath the NaCl film gives rise to an overall stripe pattern that affects the low-voltage appearance of pentacene, which is featureless otherwise9. Greyscale range = 2.0 Å. c, THz-STM image taken at the same time as the topography image in b with the THz voltage set to VTHzpeak ≈ -2.05 V. The THz-induced current was in the direction of electron tunnelling from the HOMO to the tip, even though the DC bias was positive and far from either molecular resonance. d, Simulated THz-STM image calculated based on the Tersoff-Hamann approximation with the tip position following the topography shown in b. e, THz-STM image (close-up of blue rectangle in c) measured at constant height, with VDC = 0 V, VTHzpeak ≈ -2.05 V, and a time resolution of 115 fs. The THz-induced current is calibrated in units of rectified electrons per THz pulse (e/pulse). f, g, DFT-derived HOMO and LUMO contours of the free pentacene molecule, respectively. h, Molecular structure of pentacene. i, Simulated constant-height THz-STM image (close-up of blue rectangle in d).
For easy comparison, Figs. 2f and 2g show the HOMO and LUMO determined from density functional theory calculations, respectively, alongside the structural formula of pentacene (Fig. 2h). The central nodal plane of the HOMO, which is not present in the LUMO, can be clearly identified in the THz-STM images. The deviations of the THz-STM image (Fig. 2c) from the HOMO density are explained by the fact that the tip follows the low-voltage topography during image acquisition. This can be seen in the corresponding image simulation (Fig. 2d), in which we display the square of the matrix element between the tip wavefunction and the HOMO for tip positions following the experimental low-voltage topography acquired simultaneously (Fig. 2b). The simulation reproduces the THz-STM image in great detail (cf. Fig. 2d and 2c), including the asymmetry in the orbital, which arises from a slight shift of the low-bias topography relative to the HOMO, likely due to an asymmetric tip shape.
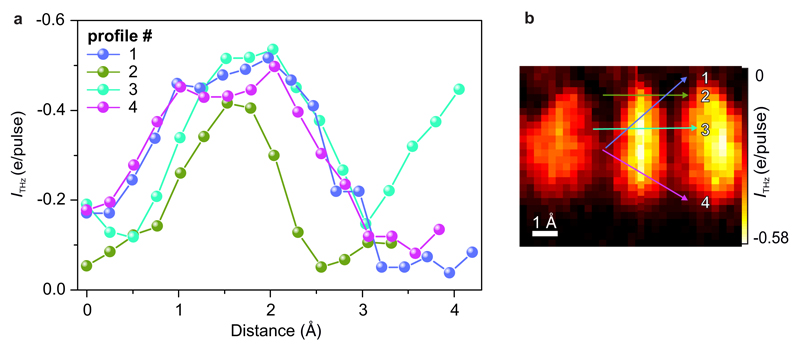
Ultrafast THz-STM imaging can also be performed with the STM bias voltage and feedback loop completely turned off. This mode avoids artefacts from the low-bias topography. Figure 2e shows a constant-height THz-STM scan (VDC = 0 V) of three central lobes. Here, the THz pulses apply the only voltage to the system. Nevertheless, with their peak voltages set near the HOMO resonance, they induce a rectified current on the scale of 0.6 electrons per THz pulse, revealing orbital lobes (simulated in Fig. 2i) with detail on the scale of 0.6 angstroms (see Extended Data Figure 1 and Methods). Hence, not only can a THz pulse be used to remove a single electron from a single molecule with femtosecond control over the tunnelling time window, but this can also be done with sub-angstrom precision and orbital selectivity. As the THz pulses are phase stable, this tunnelling time window is locked to a fixed point within the pulse envelope irrespective of the tip position, resulting in a stroboscopic femtosecond snapshot image of a single orbital recorded pixel by pixel. Under different experimental conditions, we can also trace the LUMO with the THz-driven tunnel current (see Extended Data Figure 2).
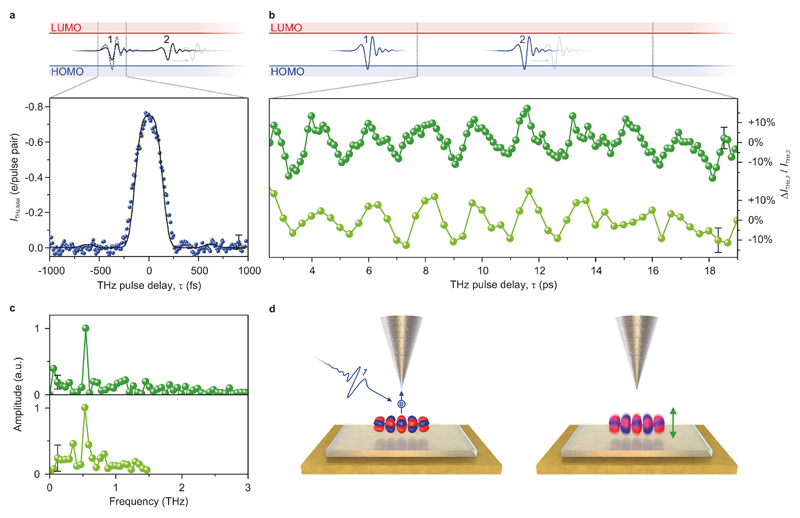
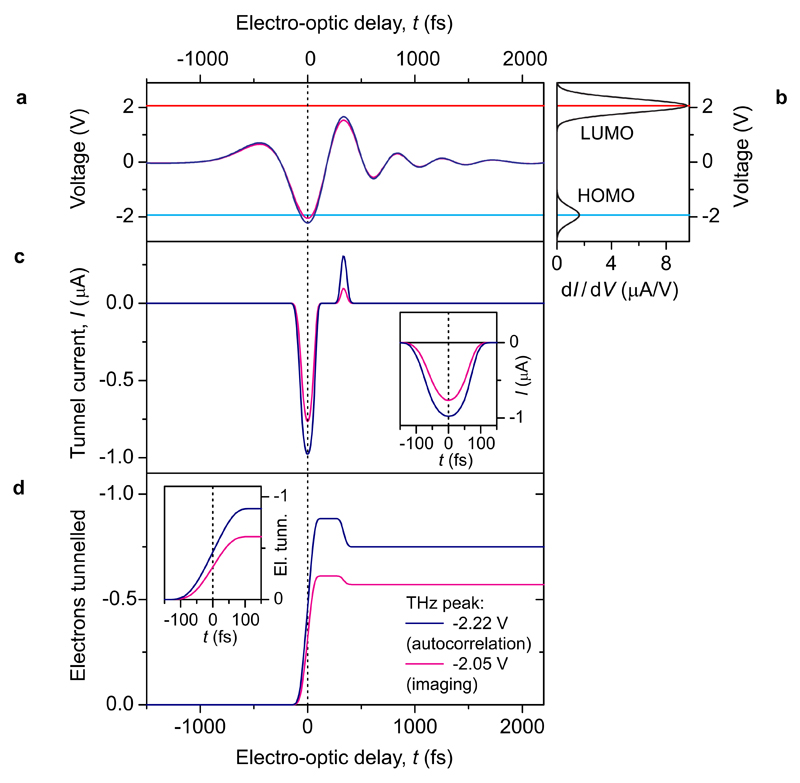
The time resolution of the snapshot in Fig. 2 can be extracted from a THz autocorrelation18 measurement over a central pentacene HOMO lobe (data points in Fig. 3a), where the rectified current is recorded as a function of delay between two identical THz pulses, τ (Fig. 3a, top). To simulate the experimental trace, we account for the tunnelling conductance of the HOMO and LUMO levels and compute the rectified current induced by time-delayed pairs of THz waveforms, as measured by electro-optic sampling (see Methods for details of the model) under the assumption that the voltage transient equals the THz-electric field times a scaling factor, which acts as the only fit parameter. Good agreement is found between the simulated (Fig. 3a, black curve) and measured autocorrelations for a peak voltage of -2.22 V ± 0.07 V at τ = 0 fs, supporting our assertion that THz pulses tuned to the HOMO resonance drive sequential tunnelling. Yet more fundamentally, this result verifies that the THz waveform modulates the bias voltage of the junction quasi-instantaneously, even on the sub-cycle scale. In this regime, the simulations allow us to retrieve the average temporal shape of the rectified current pulse. As shown in Extended Data Figure 3, the rectified current is generated within a time window as short as 130 fs for a voltage peak of -2.22 V. Furthermore, we estimate that the THz peak was only -2.05 V during THz-STM imaging (Fig. 2, see Extended Data Figure 3 for details). Therefore, the temporal window for tunnelling in the single-orbital snapshot image (cf. Fig. 2c and 2e) is determined to be only 115 fs (see Extended Data Figure 3).
Figure 3. Ultrafast dynamics of a single molecule.
a, THz-pulse autocorrelation for two identical THz pulses in units of rectified electrons per THz pulse pair measured with the STM tip located over a pentacene HOMO lobe. Each individual THz pulse (solid line in schematic) is too weak (THz far-field amplitude, 0.12 kV/cm) to enable sequential tunnelling through the HOMO. Upon perfect overlap (τ = 0), however, the resulting transient does reach the HOMO level (dashed line). The experimental ITHz,total(τ) (dots) is fit (solid line) by a simulation based on rectifying the electro-optically measured THz waveform using a dI/dV represented by the sum of two Gaussians. The best fit yields a time resolution of 130 fs here and 115 fs for the settings used for imaging. b, Measurement of a single pentacene molecule’s time dynamics in a two-pulse experiment. Here, each individual THz pulse is strong enough (THz far-field amplitude, 0.22 kV/cm) to facilitate HOMO tunnelling. The current due to the second pulse exhibits coherent oscillations as a function of delay time τ. This pump-induced variation ΔITHz,2 of the average current ITHz,2 originating from the second pulse is shown (dark green points, curve). A second scan taken on the same molecule confirms a fixed phase relation (light green points, curve). c, The Fourier spectra of the measurements in b exhibit sharp peaks at ~0.5 THz. d, Illustration of the two-pulse measurement. The first THz pulse excites a vertical vibration by removing an electron from the HOMO. The second pulse detects the instantaneous height of the oscillating molecule as a change in the net current. Error bars indicate the standard deviation from the fit (a and b) and the corresponding standard deviation in the frequency domain (c).
Femtosecond control over the tunnelling time window can be used to capture the ultrafast dynamics of an individual molecule following a single tunnelling event (Fig. 3b). To this end, we introduce a new quantum pump / probe scheme, where two successive, identical THz pulses are tuned in resonance with the pentacene HOMO (Fig. 3b, top). Ultrafast dynamics driven by the first field transient (pump) thus potentially modifies the rectified current ĨTHz,2 induced by the second (probe). Remarkably, this probe current measured as a function of the pump-probe delay, τ, (Fig. 3b) indeed exhibits a marked oscillation at a frequency of 0.5 THz (Fig. 3c).
We interpret this behaviour as a coherent vibration of the molecule, which may be understood as a manifestation of the Franck-Condon principle on the single-molecule level: The pump stimulates tunnelling of an electron from the HOMO to the tip, leaving the molecule temporarily charged. The abrupt change to the Coulomb and van der Waals forces on the molecule imparts an impulse that prepares a dominantly vertical vibration of the molecular frame over the salt layer30. We expect the HOMO to be refilled on the ~100 fs timescale (see Methods), so vibrations occur about the equilibrium position of the neutral molecule. The probe pulse subsequently samples the resulting oscillation of the molecule’s position (Fig. 3d), which is well defined because the time window for tunnelling out of the molecule is much shorter than the vibrational period of the relatively heavy molecular frame. Assuming that the ±10 % oscillations of the probe current (Fig. 3b) originate from a modulation of the tunnelling barrier thickness due to the molecule’s motion, its average oscillation amplitude can be estimated to be ±4 pm from the tunnelling decay rate (current vs. barrier thickness).
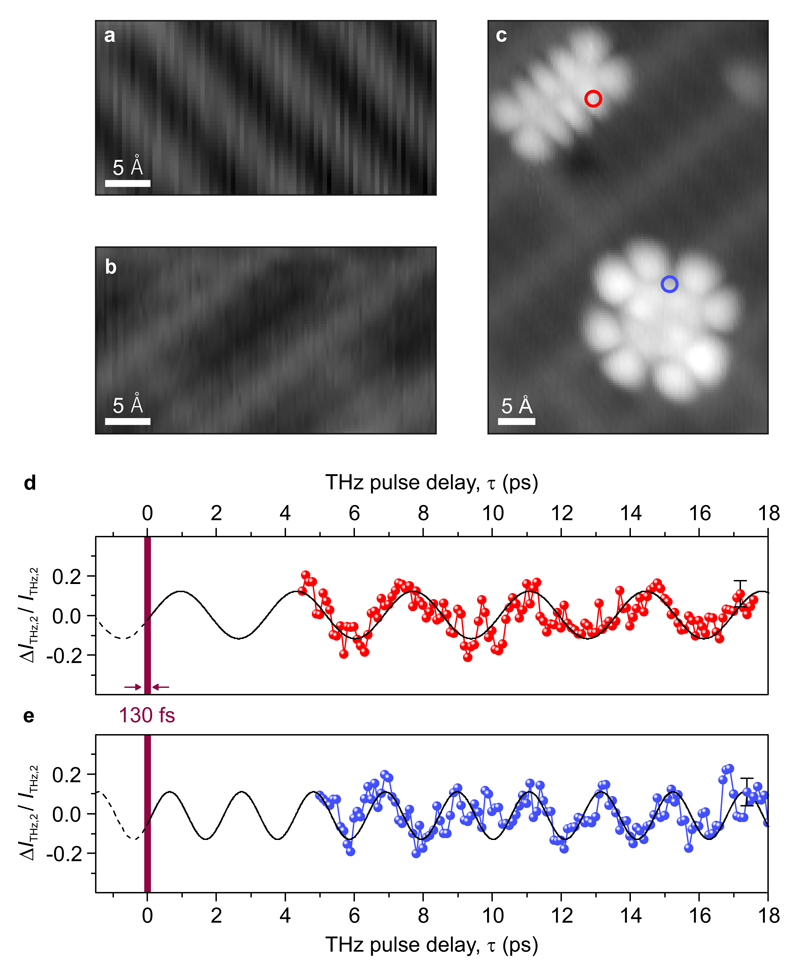
The oscillatory mode of the molecule is characteristic to the specific van der Waals interaction between pentacene and the substrate. We demonstrate this in Fig. 4, where we prepare monolayer salt islands at a higher temperature (see Methods), thereby removing the missing-row reconstruction of the Au surface underneath (Fig. 4a and 4b). Pump / probe measurements recorded over an adsorbed pentacene molecule (at the position indicated by the red circle in Fig. 4c) reveal a molecular oscillation frequency of 0.3 THz (Fig. 4d), which is different from the oscillation frequency observed for pentacene on the previous substrate (Fig. 3b and 3c). The shift is a direct result of altering the Au reconstruction underneath the decoupling layer, as this modifies the pentacene adsorption potential. Furthermore, under identical experimental conditions to those in Fig. 4d, we observe a different oscillation frequency (Fig. 4e) for a copper phthalocyanine molecule adsorbed on the same salt island (recorded at the blue circle in Fig. 4c), excluding alternative mechanisms as the origin of the observed current oscillations (see Methods). In each case, we coherently stimulate and resolve the oscillatory mode of the molecule in the time domain, and can even trace the oscillations back to identify the absolute phase at the triggering event (see Fig. 4d and 4e). We find that for all observed oscillations, the initial phase is identical regardless of the oscillation frequency and is consistent with a 130 fs long excitation window. In contrast to frequency-based spectroscopy, our coherent pump / probe tunnelling scheme reveals molecular modes that are normally obscured by incoherent broadening, while simultaneously providing sub-orbital spatial resolution. Molecular motion on the scale of single vibrational quanta can thus be both tracked and manipulated by controlled tunnelling events, where we define the energy, position, and time window of lightwave-driven tunnelling.
Figure 4. Influence of substrate surface and molecular species on ultrafast single-molecule dynamics.
a, b, Constant-current DC-STM images of NaCl/Au(110) islands with (a) and without (b) the missing-row Au(110) reconstruction beneath the monolayer NaCl film. Greyscale range = 2.0 Å c, Constant-current DC-STM image of a pentacene molecule HOMO (top left) and a copper phthalocyanine molecule HOMO (bottom right), which are adsorbed next to one another on the same NaCl monolayer island shown in b (VDC = -1.75 V, I = 0.83 pA). Greyscale range = 3.0 Å. The red and blue circles indicate the positions at which pump / probe dynamics shown in d and e were measured on each molecule. d, e, Quantum pump / probe measurements recorded over the pentacene molecule (d, red) and the copper phthalocyanine molecule (e, blue). While the experimental conditions were identical for d and e, they show coherent oscillations at different frequencies (0.3 THz and 0.5 THz, respectively). Error bars indicate the standard deviation from the fit. Sinusoidal fits to the time-domain oscillations (black lines in d and e) identify the dominant spectral component in each case. Tracing each fit back to τ = 0 reveals a consistent absolute phase with a temporal offset of less than 130 fs (vertical purple belt). Sinusoidal fits to the oscillations in Fig. 3b also give the same phase.
Ultrafast THz-STM of well-defined quantum states opens the door to a qualitatively new experimental domain in nanoscience. Now, the femtosecond quantum motion of molecules, ranging from vibrations to electronic excitations, can be probed on the scale of a single electronic orbital. Furthermore, the dynamics of the energy landscape associated with single electrons and phonons can be directly traced by ultrafast tunnelling, providing a route to explore few-particle quantum statistics in single molecules with sub-cycle time resolution. Moreover, combining an optical pump pulse with the THz-STM probe will provide access to a multitude of optical excitations, including those in the time window immediately following the pump pulse (τ < 2 ps). In the near future, we envisage watching single-electron lightwave electronics in molecular circuits, single-molecule movies, and chemical reactions in four dimensions, visualizing the initial reaction steps of key elementary processes in chemistry and biology.
Methods
THz optical setup
Intense, phase-locked THz pulses are generated by tilted-pulse-front optical rectification of femtosecond near-infrared pulses (centre wavelength, 1030 nm, pulse duration (FWHM), 250 fs) from a regenerative Yb:KGW laser amplifier (repetition rate, 0.61 MHz) in lithium niobate. The waveform of the generated single-cycle THz transients is directly measured by electro-optic sampling in a 0.5-mm-thick (110)-cut ZnTe crystal using femtosecond near-infrared gate pulses (centre wavelength, 800 nm, pulse duration, 10 fs). Pairs of mutually delayed THz transients are prepared by transmitting the THz pulses through a Michelson interferometer, in which the computer-controlled position of one end mirror sets the delay time, τ. The field amplitude can be continuously scaled without changing the waveform using wire grid polarizers. We note that the precise field enhancement at the tip depends on the local tip preparation for a specific experiment, but is constant as long as the tip shape is maintained.
STM setup and sample preparation
The homebuilt STM is based on a Besocke design31 and operates in ultrahigh vacuum (UHV; p ≈ 7 × 10⁻¹¹ mbar) and at low temperatures down to 11 K. The bias is applied to the sample, and the bias voltage window refers to the energy region between the tip and sample Fermi levels. A homebuilt, low-temperature (≈ 100 K), high-gain (G = 2.5 × 10¹⁰) preamplifier is used that is mounted in close proximity to the STM head. THz radiation enters the vacuum chamber through a sapphire viewport as a collimated beam and is focused onto the tip by a parabolic mirror that is fixed to the STM scan unit. NaCl is evaporated thermally onto the clean Au(110) sample under UHV conditions at a sample temperature of ≈ 295 K (missing-row reconstruction) and ≈ 400 K (no missing-row reconstruction), in two different preparations. Pentacene or copper phthalocyanine molecules are deposited onto the cold sample (T < 15 K) while it is located inside the STM.
THz-STM measurements
To detect the THz-induced current, we modulate the THz pulses at 475 Hz with an optical chopper (faster than the STM feedback loop bandwidth) and measure the AC tunnel current with lock-in detection. We note that the average current due to the THz pulse train is small relative to the DC setpoint current, which is typically on the order of 1 pA, and can be in the opposite direction. The average THz-induced current can be converted into the number of electrons / pulse by: ITHz(e/pulse) = ITHz (fA) / (f · e), where f is the repetition rate of the THz pulses and e is the elementary charge. For example, if only one THz pulse is produced per laser shot, 98 fA corresponds to 1 electron / pulse. The combination of our low-noise preamplifier, laser repetition rate, and lock-in detection therefore allows us to measure THz-induced currents down to 0.01 electrons / pulse. In an autocorrelation measurement (e.g. Fig. 3a), each generated THz pulse is split in two and separated by a variable delay time τ in the Michelson interferometer. The peak fields of the two identical THz pulses focused onto the tip are adjusted such that the combined peak field reaches the HOMO only when the pulses fully overlap (τ = 0). The optical generation beam is modulated, so the measured AC current corresponds to the total THz-induced current created by the two pulses. Conversely, pump / probe measurements (e.g. Fig. 3b, 4d, 4e) are made by modulating one of the two THz pulse trains in a pair independently (i.e. one arm of the Michelson interferometer contains a chopper). Additionally, in quantum pump / probe measurements, we adjust the peak field of each THz pulse in a pair such that the pulses access a particular orbital independently when separated (i.e. for large τ). We then compare the AC tunnel current ITHz,1 induced by the first pulse only, the corresponding current ITHz,2 solely caused by the second pulse, and ITHz,total(τ) measured when both THz fields act on the junction. Finally, we define ĨTHz,2(τ) = ITHz,total(τ) – ITHz,1 and ΔITHz,2(τ) = ĨTHz,2(τ) – ITHz,2. In the measurements shown here, we avoid the range τ < 2 ps because of interference. To obtain a detectable THz-induced current, the tunnelling rate between tip and molecule has to be large enough to ensure an appreciable probability for a corresponding tunnelling event during the ultrashort tunnelling time window at the THz peak. This high tunnelling rate is facilitated by a close tip-molecule distance and will – outside the THz peak – lead to an electron tunnelling from the tip refilling the HOMO at a similar rate. This process competes with the HOMO being refilled from the substrate, where extrapolation of the results in reference 32 indicate a tunnelling time on the order of 100 fs through a NaCl monolayer. The net tunnel current that is observed stems from those instances only, for which the HOMO is refilled from the substrate. Signals similar to the oscillations shown for τ > 2 ps are observed at negative delay times, when the roles of the identical THz pump and probe pulses are interchanged. Finally, we note that we observe a small tip expansion due to heating by the THz pulse train, but it is on the order of 10 pm and occurs on a timescale of seconds (which is far slower than our chopping frequency) and therefore has no effect on our measurements.
Simulations
To simulate the spatial distribution of the HOMO in the THz-STM images (Figs. 2d and 2i), we adopt the Bardeen model33, where the tunnel current is proportional to the square of the matrix element between the relevant tip and sample wavefunctions. As in the Tersoff-Hamann approach32, we approximate the tip wavefunction as an s-wave, whereas we use the DFT-derived HOMO of the free molecule as the sample wavefunction (calculated using the “Turbomole” computational framework34 in version 6.2 with the B3-LYP functional in the def2-TZVP basis set). To model the spatial dependence of the tunnel current, we evaluate the convolution of the HOMO with the s-wave tip for the experimentally measured topography (Fig. 2b). The best agreement between the simulations and the THz-STM images is obtained for s-waves with 1/e decay lengths ≤ 0.5 Å, which is consistent with the spatial resolution of the experimental image (0.6 Å, see Extended Data Figure 1).
Origin of different oscillation frequencies
For pentacene molecules adsorbed on NaCl monolayer islands on Au(110) with the missing-row reconstruction, we observed a consistent oscillation frequency of 0.5 THz (Fig. 3). We also investigated copper phthalocyanine (CuPc) molecules on the same substrate and observed a higher oscillation frequency of 0.7 THz (not shown). For pentacene and CuPc adsorbed on NaCl islands on Au(110) without the missing-row reconstruction, we found oscillation frequencies of 0.3 THz (Fig. 4d) and 0.5 THz (Fig. 4e), respectively. The higher frequency observed for CuPc molecules is consistent with the slightly polar character of the bonds inside CuPc, which results in an increased electrostatic interaction with the underlying ionic NaCl film that stiffens the binding to the substrate. Generally, though, the weak interaction of a relatively large π-conjugated organic molecule with an insulating substrate is very difficult to model and predict with theory or corresponding simulations. On the experimental side, vibrational frequencies of 6 to 8 meV have been reported for hydrocarbons directly adsorbed on Cu(100)35 and Ru(0001)36. It is expected that the interaction of the π-conjugated molecules with the substrate is substantially weakened by introducing an insulating film. Hence, for pentacene and CuPc on NaCl/Au(110) frequencies well below 6 meV are expected, in qualitative agreement with our observations. Most importantly, the occurrence of different oscillator frequencies for different molecular species and different surface reconstructions with otherwise identical conditions rules out many other potential causes for the observed oscillations, namely, plasmonic resonances of the junction, THz resonances of the entire tip which influence the THz coupling, interference effects of potential trailing oscillations of the THz waveform, and coherently excited surface modes that change the substrate-molecule tunnelling probability as a function of τ.
Extended Data
Extended Data Figure 1. Spatial resolution of THz-STM imaging.
a, Linescan cuts through constant-height, zero-bias THz-STM image in b. The pixel size in the image is 0.25 Å × 0.25 Å. The image contains edges where the signal rises from the background level to a maximum within 0.75 Å. The rise from 10% to 90% in these cases is approximately 0.6 Å, which provides an upper bound for the spatial resolution of the image. This estimate agrees with simulations of the spatial distribution of the rectified current (Figs. 2d and 2i). There, we calculate the square of the matrix element between the pentacene HOMO and the tip wavefunction (Bardeen model). The tip wavefunction, which ultimately determines the attainable spatial resolution, is modelled as an s-wave (as in the Tersoff-Hamann approach) and the spatial decay of this wavefunction is used as a fitting parameter, along with the tip height. The best agreement between the experimental and simulated images is found for s-waves with decay lengths ≤ 0.5 Å, consistent with our spatial resolution estimate of 0.6 Å based on the linescans in a.
Extended Data Figure 2. Ultrafast THz-STM imaging of the lowest unoccupied orbital of pentacene.
a, By replacing Au(110) with Cu(100) as the substrate, the HOMO and LUMO levels realign with respect to the Fermi level of the substrate in such a way that the LUMO can be probed by THz-induced currents. This situation is schematically depicted in analogy to Fig. 1b for adsorption on NaCl/Cu(100), where the very same THz waveform can induce sequential tunnelling into the pentacene LUMO at the most intense positive half-cycle, while the negative half-cycle is too weak to allow for HOMO tunnelling. b, Steady-state constant-current STM image of three pentacene molecules side-by-side at VDC = 100 mV and I = 1.4 pA. Greyscale range = 2.4 Å. c, Constant-height THz-STM image of the same sample area as in b with VDC = 0 mV and the maximum positive THz voltage set to VTHzpeak ≈ +1.3 V. The spatial distribution of the THz-induced current closely resembles the LUMO density for each molecule, indicating state-selective THz-induced LUMO tunnelling. The onset field for this process agrees with the modified alignment of the orbitals. Specifically, the peak THz voltage in the positive direction that is predicted based on the field enhancement determined from HOMO tunnelling is consistent with the new LUMO transport level voltage observed in the steady-state dI/dV curve here. This agreement lends further support to the proposed mechanism for THz-STM in this regime.
Extended Data Figure 3. Modelling ultrafast terahertz-induced tunnelling out of a pentacene HOMO.
a, Terahertz voltage waveforms used in the simulations. We approximate the time trace of the THz voltage with the THz electric-field waveform measured in the far field by electro-optic sampling. In all plots the pink curve corresponds to a waveform with a peak of -2.05 V and the navy blue curve corresponds to a waveform with a peak of -2.22 V. The scaling factor and resulting peak voltages are determined by fitting the shape of the experimental autocorrelation (Fig. 3a) as follows. We simulate the autocorrelation by taking the sum of two THz pulses and calculating the total rectified current from the resulting transient as a function of delay time between the pulses. b, The dI/dV characteristic needed for the simulation is obtained by modelling the HOMO and LUMO molecular resonance peaks in the experimental dI/dV curve (Fig. 2b, centre) with two Gaussians. This dI/dV curve is then scaled up to account for the significantly lower tip height for THz-STM imaging, with a scaling factor as a second parameter for the fit. Note that this second parameter does not affect the shape of the autocorrelation. Blue line: Centre of HOMO Gaussian, -1.93 V (0.62 V full width at half maximum, FWHM). Red line: Centre of LUMO Gaussian, 2.06 V (0.58 V FWHM). c, Resulting current response induced by the THz voltage waveform in a when applied to a junction with a dI/dV relation defined by b. The asymmetry of the THz voltage pulse leads to a much larger current response in the negative bias direction than in the positive bias direction. Inset: induced current response during the negative crest of the THz voltage waveform. Pink curve: 120 fs FWHM, Navy blue curve: 140 fs FWHM. d, Number of total electrons that have tunnelled across the junction, calculated from the integral of c. Negative numbers refer to the negative bias direction, i.e. electron tunnelling from the HOMO to the tip. Inset: rise of the rectified electron signal during the negative crest of the THz voltage waveform. Pink curve: 115 fs 10% to 90%; Navy blue curve: 130 fs 10% to 90%. The simulated autocorrelation for -2.22 V peak (navy blue curve) provides the best fit to the shape of the measured autocorrelation. The dI/dV curve is scaled such that the autocorrelation peak at -2.22 V matches the measured peak of ~ -0.75 electrons/THz pulse. The peak voltage of the THz pulses used in the imaging configuration, e.g. Fig. 2e, where the maximum observed signal is ~ -0.58 electrons/THz pulse, is then determined by finding the THz peak for which the simulations yield this number of rectified electrons per THz pulse. The best agreement is found for -2.05 V (pink curve). We note that the simulations are based on the assumption that the THz pulse modulates the bias of the junction quasi-instantaneously. In our simulations we disregard any blocking of tunnelling or other effects resulting from the finite time until an electron from the substrate refills the molecular state. This blocking is expected to become important if the THz-current reaches or even exceeds one electron per pulse.
Acknowledgements
We thank Andreas Pöllmann, Florian Albrecht, Rudolf Kronfeldner, Max Eisele, and Martin Furthmeier for assistance and Ferdinand Evers, Frank A. Hegmann, Vedran Jelic, Paul C. M. Planken, Milena Grifoni, and Klaus Richter for valuable discussions. Financial support from the Volkswagen Foundation (Lichtenberg program), the European Research Council through grant number 305003 (QUANTUMsubCYCLE) as well as the Deutsche Forschungsgemeinschaft (DFG) through GRK 1570 and Research Grant HU1598/3, and CO1492/1 is gratefully acknowledged. T.L.C. thanks the A. v. Humboldt Foundation.
Footnotes
Author Contributions T.L.C., D.P., P.Y., J.R. and R.H. conceived, set-up and carried out the experiments. T.L.C., D.P., J.R. and R.H. analysed the data and wrote the manuscript.
Author Information Reprints and permissions information is available at www.nature.com/reprints.
The authors declare no competing financial interests.
References
- 1.Itatani J, et al. Tomographic imaging of molecular orbitals. Nature. 2004;432:867–871. doi: 10.1038/nature03183. [DOI] [PubMed] [Google Scholar]
- 2.Goulielmakis E, et al. Attosecond Control and Measurement: Lightwave Electronics. Science. 2007;317:769–775. doi: 10.1126/science.1142855. [DOI] [PubMed] [Google Scholar]
- 3.Neppl S, et al. Direct observation of electron propagation and dielectric screening on the atomic length scale. Nature. 2015;517:342–346. doi: 10.1038/nature14094. [DOI] [PubMed] [Google Scholar]
- 4.Hohenleutner M, et al. Real-time observation of interfering crystal electrons in high-harmonic generation. Nature. 2015;523:572–575. doi: 10.1038/nature14652. [DOI] [PubMed] [Google Scholar]
- 5.Feist A, et al. Quantum coherent optical phase modulation in an ultrafast transmission electron microscope. Nature. 2015;521:200–203. doi: 10.1038/nature14463. [DOI] [PubMed] [Google Scholar]
- 6.Krüger M, Schenk M, Hommelhoff P. Attosecond control of electrons emitted from a nanoscale metal tip. Nature. 2011;475:78–81. doi: 10.1038/nature10196. [DOI] [PubMed] [Google Scholar]
- 7.Wimmer L, et al. Terahertz control of nanotip photoemission. Nature Phys. 2014;10:432–436. [Google Scholar]
- 8.Iwaszczuk K, Maksin Z, Strikwerda A, Jepsen PU. Nitrogen plasma formation through terahertz-induced ultrafast electron field emission. Optica. 2015;2:116–123. [Google Scholar]
- 9.Repp J, Meyer G, Stojković SM, Gourdon A, Joachim C. Molecules on Insulating Films: Scanning-Tunneling Microscopy Imaging of Individual Molecular Orbitals. Phys Rev Lett. 2005;94:026803. doi: 10.1103/PhysRevLett.94.026803. [DOI] [PubMed] [Google Scholar]
- 10.Stroscio JA, Celotta RJ. Controlling the Dynamics of a Single Atom in Lateral Atom Manipulation. Science. 2004;306:242–247. doi: 10.1126/science.1102370. [DOI] [PubMed] [Google Scholar]
- 11.Stipe BC, Rezaei MA, Ho W. Single-Molecule Vibrational Spectroscopy and Microscopy. Science. 1998;280:1732–1735. doi: 10.1126/science.280.5370.1732. [DOI] [PubMed] [Google Scholar]
- 12.Hamers RJ, Cahill DG. Ultrafast time resolution in scanned probe microscopies. Appl Phys Lett. 1990;57:2031. [Google Scholar]
- 13.Nunes G, Jr, Freeman MR. Picosecond Resolution in Scanning Tunneling Microscopy. Science. 1993;262:1029–1032. doi: 10.1126/science.262.5136.1029. [DOI] [PubMed] [Google Scholar]
- 14.Kemiktarak U, Ndukum T, Schwab KC, Ekinci KL. Radio-frequency scanning tunnelling microscopy. Nature. 2007;450:85–88. doi: 10.1038/nature06238. [DOI] [PubMed] [Google Scholar]
- 15.Terada Y, Yoshida S, Takeuchi O, Shigekawa H. Real-space imaging of transient carrier dynamics by nanoscale pump-probe microscopy. Nature Photon. 2010;4:869–874. [Google Scholar]
- 16.Loth S, Etzkorn M, Lutz C, Eigler DM, Heinrich AJ. Measurement of Fast Electron Spin Relaxation Times with Atomic Resolution. J. Science. 2010;329:1628–1630. doi: 10.1126/science.1191688. [DOI] [PubMed] [Google Scholar]
- 17.Wu SW, Ho W. Two-photon-induced hot-electron transfer to a single molecule in a scanning tunneling microscope. Phys Rev B. 2010;82:085444. [Google Scholar]
- 18.Cocker TL, et al. An ultrafast terahertz scanning tunnelling microscope. Nature Photon. 2013;7:620–625. [Google Scholar]
- 19.Yoshida S, et al. Probing ultrafast spin dynamics with optical pump-probe scanning tunnelling microscopy. Nature Nano. 2014;9:588–593. doi: 10.1038/nnano.2014.125. [DOI] [PubMed] [Google Scholar]
- 20.Merino P, Groβe C, Rosławska A, Kuhnke K, Kern K. Exciton dynamics of C60-based single-photon emitters explored by Hanbury Brown-Twiss scanning tunnelling microscopy. Nat Commun. 2015;6:8461. doi: 10.1038/ncomms9461. [DOI] [PMC free article] [PubMed] [Google Scholar]
- 21.Wagner M, et al. Ultrafast and Nanoscale Plasmonic Phenomena in Exfoliated Graphene Revealed by Infrared Pump-Probe Nanoscopy. Nano Lett. 2014;14:894–900. doi: 10.1021/nl4042577. [DOI] [PubMed] [Google Scholar]
- 22.Eisele M, et al. Ultrafast multi-terahertz nano-spectroscopy with sub-cycle temporal resolution. Nature Photon. 2014;8:841–845. [Google Scholar]
- 23.Gao M, et al. Mapping molecular motions leading to charge delocalization with ultrabright electrons. Nature. 2012;496:343–346. doi: 10.1038/nature12044. [DOI] [PubMed] [Google Scholar]
- 24.Zewail AH. Four-Dimensional Electron Microscopy. Science. 2010;328:187–193. doi: 10.1126/science.1166135. [DOI] [PubMed] [Google Scholar]
- 25.Feist A, et al. Quantum coherent optical phase modulation in an ultrafast transmission electron microscope. Nature. 2015;521:200–203. doi: 10.1038/nature14463. [DOI] [PubMed] [Google Scholar]
- 26.Jahng J, et al. Ultrafast pump-probe force microscopy with nanoscale resolution. Appl Phys Lett. 2015;106:083113. [Google Scholar]
- 27.Zhang R, et al. Chemical mapping of a single molecule by plasmon-enhanced Raman scattering. Nature. 2013;498:82–86. doi: 10.1038/nature12151. [DOI] [PubMed] [Google Scholar]
- 28.Lee J, et al. Vibronic Motion with Joint Angstrom–Femtosecond Resolution Observed through Fano Progressions Recorded within One Molecule. ACS Nano. 2014;8:54–63. doi: 10.1021/nn405335h. [DOI] [PubMed] [Google Scholar]
- 29.Zhang Y, et al. Visualizing coherent intermolecular dipole–dipole coupling in real space. Nature. 2016;531:623–627. doi: 10.1038/nature17428. [DOI] [PubMed] [Google Scholar]
- 30.Park H, Park J, Lim AKL, Anderson EH, Alivisatos AP, McEuen PL. Nanomechanical oscillations in a single-C60 transistor. Nature. 2000;407:57–60. doi: 10.1038/35024031. [DOI] [PubMed] [Google Scholar]
- 31.Meyer G. A simple low-temperature ultrahigh-vacuum scanning tunneling microscope capable of atomic manipulation. Rev Sci Instrum. 1996;67:2960. [Google Scholar]
- 32.Steurer W, Gross L, Meyer G. Local thickness determination of thin insulator films via localized states. Appl Phys Lett. 2014;104:231606. [Google Scholar]
- 33.Chen CJ. Introduction to Scanning Tunneling Microscopy. (Oxford Univ. Press); 1993. [Google Scholar]
- 34.Ahlrichs R, Bär M, Häser M, Horn M, Kölmel C. Electronic structure calculations on workstation computers: The program system turbomole. Chem Phys Lett. 1989;162:165. [Google Scholar]
- 35.Witte G, Wöll C. External vibrations of hydrocarbons on Cu(100) J Chem Phys. 1995;103:5860. [Google Scholar]
- 36.Witte G, Weiss K, Jakob P, Braun J, Kostov KL, Wöll C. Damping of Molecular Motion on a Solid Substrate: Evidence for Electron-Hole Pair Creation. Phys Rev Lett. 1998;80:121. [Google Scholar]


