

Abstract
Background and Purpose
To investigate age-corrected brain Magnetic Resonance Elastography findings in four dementia cohorts: Alzheimer’s disease, dementia with Lewy bodies, frontotemporal dementia and normal pressure hydrocephalus; and determine the potential use as a differentiating biomarker in dementia subtypes.
Materials and Methods
Institutional Review Board approval and written informed consent was obtained to perform Magnetic Resonance Elastography on 84 subjects: 20 normal pressure hydrocephalus patients; 8 Alzheimer’s disease patients; 5 dementia with Lewy bodies patients; 5 frontotemporal dementia patients; and 46 cognitively normal controls. Shear waves of 60 Hz vibration frequency were transmitted into the brain using a pillow-like passive driver, and brain stiffness was determined in eight different regions (cerebrum, frontal, occipital, parietal, temporal, deep grey matter/white matter, sensorimotor cortex and cerebellum). All stiffness values were age-corrected and compared with normal controls. The Wilcoxon rank sum test and linear regression were used for statistical analysis.
Results
Regional stiffness patterns unique to each dementing disorder were observed. Alzheimer’s disease and frontotemporal dementia patients showed decreased cerebral stiffness (p=0.001 and p=0.002 respectively), with regional softening of the frontal and temporal lobes. Alzheimer’s disease patients additionally showed parietal lobe and sensorimotor region softening (p=0.039 and p=0.018 respectively). Normal pressure hydrocephalus patients showed stiffening of the parietal, occipital and sensorimotor regions (p=0.007, p<0.001, and p<0.0001 respectively). Dementia with Lewy bodies patients did not show significant stiffness changes in any of the regions.
Conclusion
Quantitative Magnetic Resonance Elastography of changes in brain viscoelastic structure demonstrates unique regional brain stiffness patterns between common dementia subtypes.
INTRODUCTION
Dementia is a clinical disorder with symptoms characterized by progressive deterioration in different cognitive domains. It includes conditions such as memory loss, cognitive impairment, and/or personality and behavioral changes significant enough to interfere with the ability to perform daily activities. With its increasing prevalence in today’s aging society, dementia is a growing public health priority. Several different underlying neurological disorders can cause dementia. The most common are Alzheimer’s disease (AD), vascular dementia, dementia with Lewy bodies (DLB), frontotemporal dementia (FTD), and normal pressure hydrocephalus (NPH). Overlapping clinical and imaging features of dementias create diagnostic challenges, with current estimates suggesting that only 20–50% of dementia patients receive a formal diagnosis [1].
Early and accurate diagnosis of cognitive decline is of paramount importance in order to guide the course of treatment and entry of patients into relevant clinical trials. Therefore, there is a pressing need to identify diagnostic techniques that can differentiate between dementia subtypes. The two most commonly used neuroimaging biomarkers currently include MRI and radionucleotide imaging (i.e., PET and SPECT) [2]. Distinct patterns of volumetric change, hypometabolism and hypoperfusion occur in common forms of dementia and evolve over time. However, standard neuroimaging is often non-specific in the early stages of disease. Furthermore, visual impression does not accurately and reproducibly assess fine incremental grades of atrophy or metabolic change [3].
Magnetic Resonance Elastography (MRE) is an emerging noninvasive technique capable of quantitatively measuring tissue stiffness in vivo [4]. It is a three-step process beginning with the induction of shear waves in the tissue via an external vibration source. The waves are then imaged with a phase-contrast MRI technique by applying motion-encoding gradients synchronized to the external motion. Finally, the images are mathematically inverted to calculate tissue stiffness and generate a stiffness map (elastogram) [5]. MRE is increasingly being investigated to measure brain stiffness in a variety of neurological diseases. Previous studies have investigated the role of brain MRE in AD [6, 7], FTD [8] and NPH [9, 10]. To date the MRE literature has been concerned with differentiating a single specific dementia from healthy elderly controls [6–10]. The purpose of this study was to investigate age-corrected brain MRE findings in four dementia cohorts: AD, DLB, FTD and NPH; and determine the potential use as a differentiating biomarker in dementia subtypes.
MATERIALS AND METHODS
With the approval of our Institutional Review Board, and after obtaining written informed consent, MRE was performed on 84 subjects over a period of four years (March 2012 to February 2016). Subjects were consecutively recruited and included 20 NPH patients (10 males and 10 females, age range: 60–86 years); 8 AD patients (6 males and 2 females, age range: 78–87 years); 5 DLB patients (males, age range: 63–76 years); 5 FTD patients (males, age range: 54–65 years); and 46 cognitively normal controls (23 males and 23 females, age range: 56–89 years). The normal control subjects were recruited from a longitudinal study of aging [11] and were known to be cognitively normal with no abnormal amyloid burden according to Pittsburgh compound-B PET. The NPH patients were of the idiopathic type and were diagnosed based on clinical symptoms; ventriculomegaly out of proportion to atrophy on conventional neuroimaging; and symptom improvement following CSF drainage via a high-volume lumbar tap meeting the guidelines for probable idiopathic NPH published in Mori et al [12]. The AD group was amyloid PET-positive subjects diagnosed as probable AD according to the Diagnostic and Statistical Manual of Mental Disorders Revised Third Edition Criteria for dementia, and National Institute of Neurological and Communicative Disorders and Stroke/Alzheimer’s Disease and Related Disorders Association Criteria (NINCDS/ADRDA) for AD [13, 14]. The FTD patients represented the behavioral variant, diagnosed based on the guidelines from the International Behavioral Variant FTD Criteria Consortium as well as PET imaging and genetic testing [15]. The DLB patients were identified according to the third report of the DLB consortium in 2005 [16].
MRE image acquisition was conducted on a 3 Tesla MRI scanner (SIGNA Excite, GE Healthcare, Waukesha, WI) using a modified single-shot spin-echo EPI pulse sequence. Shear waves of 60 Hz vibration frequency were transmitted into the brain by a pillow-like passive driver placed under the subject’s head. Imaging was then performed with the following parameters: TR/TE = 3600/62 msec; field of view = 24 cm; bandwidth = 250 kHz; 72 × 72 imaging matrix reconstructed to 80 × 80; 3× parallel imaging acceleration; 48 contiguous 3-mm-thick axial slices; motion encoding in the positive and negative x, y, and z directions; and 8 phase offsets sampled over one period of the 60-Hz motion. The resulting images had a 3 mm isotropic resolution and were acquired in less than 7 minutes. A previously described post-processing technique [5] (that has been demonstrated to have less than 1% variation for global brain stiffness and less than 2% for the cerebellum and discrete cerebral lobes in reproducibility studies) was implemented to determine the stiffness across different brain regions. In brief, this involved calculating an elastogram, or stiffness map, by applying the inverse Helmholtz equation to the smoothed curled wave field [17]. Stiffness was measured in kilopascals (kPa) and calculated as the median magnitude of the complex shear modulus (|G*|). Based on the fact that every neurodegenerative disease has a predilection for particular brain regions, we measured the stiffness of 8 ROIs: cerebrum (entire brain excluding cerebellum), frontal, occipital, parietal, and temporal lobes, deep grey matter/white matter (GM/WM: insula, deep grey nuclei and white matter tracts), sensorimotor cortex (pre- and postcentral gyri) and cerebellum. The ROIs were automatically segmented from a T1-weighted image acquired during the MRE exam session, and all pixels with a probability of having greater than 50% CSF contribution were excluded from each ROI, as previously described [5]. All stiffness measurements were age-corrected using a general linear regression model (Table 1), and stiffness was evaluated at a normalized age of 76 years for all subjects. The |G*| of each region was compared between dementia subgroups and normal controls using the Wilcoxon rank sum test for statistical analysis and p<0.05 was considered significant. To test whether or not multiple comparisons were a limitation in this study we initially tested the full data set using a linear mixed effects model with fixed effects for patient cohort, brain region, the interaction of these two, as well as random slopes and intercepts for each individual. We then performed an ANOVA on the outcomes of the linear model, which showed that patient cohort, brain region, and their cross-terms all significantly impacted stiffness. Although significance with respect to these factors was justified, it was still unknown if each cohort followed a normal distribution. Therefore a Wilcoxon rank sum test was applied to test significance between cohorts in each brain region.
Table 1.
Parameter estimates of multiple linear regression models for all 46 cognitively normal volunteers.
| ROI | Age slope (kPa/year) (p-value) |
Stiffness |G*| (kPa) Intercept at age 76 |
|---|---|---|
| Cerebrum | −0.009 ± 0.001 (<0.0001) | 2.5 ± 0.1 |
| Frontal lobes | −0.010 ± 0.002 (<0.0001) | 2.5 ± 0.1 |
| Occipital lobes | −0.013 ± 0.002 (<0.0001) | 2.5 ± 0.1 |
| Parietal lobes | −0.009 ± 0.002 (<0.0001) | 2.3 ± 0.1 |
| Temporal lobes | −0.010 ± 0.002 (<0.0001) | 2.6 ± 0.1 |
| Deep GM/WM | −0.009 ± 0.004 (0.0164) | 2.8 ± 0.3 |
| Sensorimotor cortex | −0.003 ± 0.003 (0.4049) | 2.6 ± 0.2 |
| Cerebellum | −0.005 ± 0.002 (0.0053) | 2.1 ± 0.1 |
Stiffness |G*|= (intercept at age 76) + (age slope)(age-76) (±): standard deviation
RESULTS
Natural biological factors such as age and sex have been shown to affect the underlying viscoelastic properties of different brain regions [18, 19]. Using a multiple linear regression model on the cognitively normal volunteers, we estimated an annual decline of 0.009 ± 0.001 kPa in cerebral stiffness (Table 1), with no evidence of sexual dimorphism.
Following age-correction, a disease-specific pattern of regional brain stiffness alteration was observed in the 4 dementia subtypes (Table 2). The cerebrum of AD and FTD patients showed significant decreases in stiffness (|G*|) compared to cognitively normal controls (p=0.001 and p=0.002 respectively), while NPH patients showed an increase in cerebral stiffness that did not reach statistical significance (p=0.36). DLB patients showed no difference in cerebral stiffness compared to normal controls (p=0.9). The NPH group showed significant stiffening of the parietal (p=0.007), occipital (p<0.001) and sensorimotor regions (p<0.0001), in contrast to softening or no significant stiffness change in the AD, FTD and DLB groups. Both FTD and AD groups showed significant temporal lobe softening (p=0.003 and p=0.043 respectively), while no significant temporal stiffness change was observed in the NPH and DLB groups. The AD group additionally showed significant parietal lobe and sensorimotor region softening (p=0.039 and p=0.018 respectively) (Figure 1). The frontal lobe and deep GM/WM stiffness values of the three groups (AD, FTD and NPH) were significantly decreased compared to normal controls, while no significant stiffness change was observed in these regions in the DLB group (Figure 2). The cerebellum did not show a significant stiffness change in any of the 4 groups. A summary of these results is shown in Tables 2 and 3. Representative MR anatomic and elastography images of different dementia cases compared to normal controls are presented in Figures 3 and 4. The wave images in Figures 3 and 4 are the displacement wave fields illustrating motion in and out of the slice that are produced in the brain by the mechanical vibrations applied during the MRE acquisition. The wavelength of the displacement wave field becomes longer in stiffer tissue and shorter in softer tissue. Mathematical inversion algorithms estimate local wavelengths from the wave images to produce elastograms (stiffness maps).
Table 2.
Mean stiffness values of the dementia subjects (AD, FTD, NPH, and DLB subgroups) and normal controls across different brain regions after age-correction.
| ROI | Normal controls (kPa ± SD) |
AD (kPa ± SD) |
FTD (kPa ± SD) |
NPH (kPa ± SD) |
DLB (kPa ± SD) |
|---|---|---|---|---|---|
| Cerebrum | 2.44 ± 0.08 | 2.32 ± 0.09 * | 2.28 ± 0.10 * | 2.46 ± 0.08 | 2.43 ± 0.11 |
| Frontal lobes | 2.53 ± 0.11 | 2.36 ± 0.10 * | 2.31 ± 0.14 * | 2.47 ± 0.10 * | 2.54 ± 0.11 |
| Occipital lobes | 2.52 ± 0.12 | 2.54 ± 0.20 | 2.39 ± 0.16 | 2.67 ± 0.13 * | 2.45 ± 0.11 |
| Parietal lobes | 2.35 ± 0.10 | 2.26 ± 0.09 * | 2.27 ± 0.16 | 2.46 ± 0.17 * | 2.38 ± 0.13 |
| Temporal lobes | 2.60 ± 0.11 | 2.52 ± 0.09 * | 2.41 ± 0.06 * | 2.63 ± 0.12 | 2.54 ± 0.10 |
| Deep GM/WM | 2.73 ± 0.22 | 2.48 ± 0.24 * | 2.37 ± 0.28 * | 2.58 ± 0.23 * | 2.77 ± 0.41 |
| Sensorimotor cortex | 2.61 ± 0.19 | 2.46 ± 0.10 * | 2.75 ± 0.18 | 3.12 ± 0.41 * | 2.61 ± 0.16 |
| Cerebellum | 2.09 ± 0.11 | 2.05 ± 0.13 | 1.97 ± 0.13 | 2.08 ± 0.10 | 2.05 ± 0.05 |
Asterisks (*) indicate a statistically significant difference in stiffness (|G*|) compared to normal controls.
Figure 1.
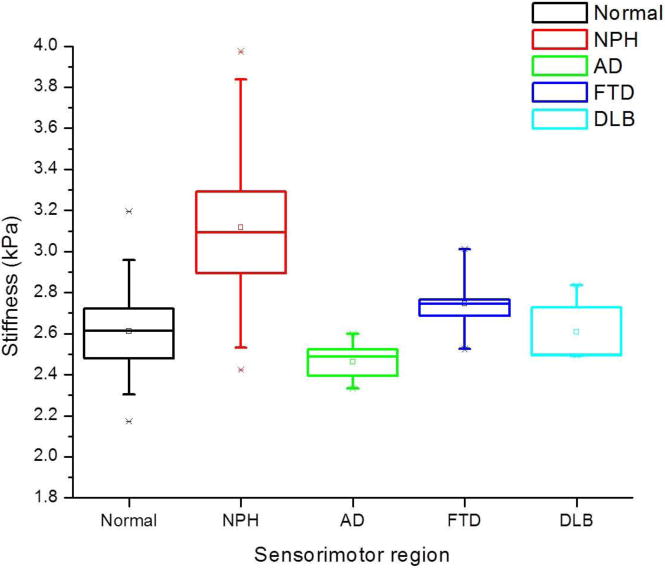
Summary box plots of sensorimotor region stiffness in NPH, AD, FTD, and DLB compared to normal controls. The NPH subgroup showed significant increase in stiffness, while the AD subgroup showed significant decline. No significant change in stiffness was noted in the FTD and DLB subgroups. The box depicts the lower (25th) and upper (75th) quartiles as well as the 50th percentile (median) and small square (mean). The whiskers are determined by the 5th and 95th percentiles.
Figure 2.
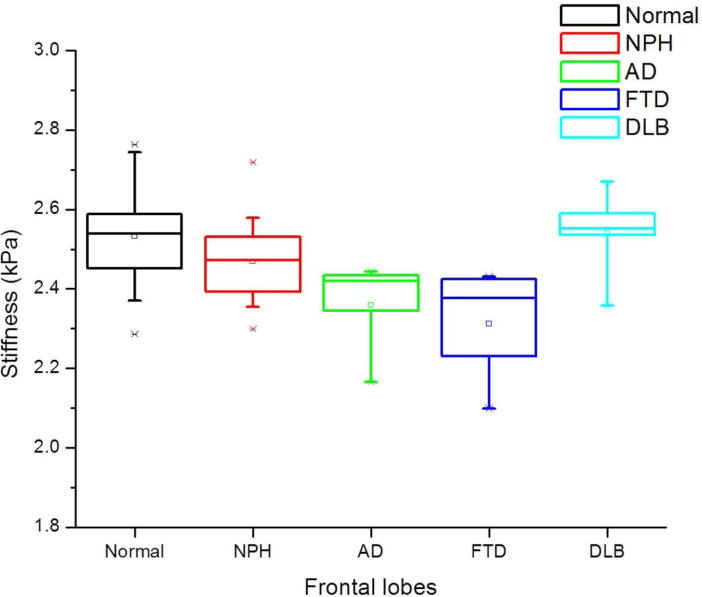
Summary box plots of frontal lobe stiffness in NPH, AD, FTD, and DLB compared to normal controls. Significant decrease in stiffness was noted in the NPH, AD and FTD subgroups, but not in the DLB subgroup.
Table 3.
Summary table of the regional stiffness differences that allow discrimination between dementia subgroups and normal controls.
| Dementia
|
AD | FTD | NPH | DLB |
|---|---|---|---|---|
| ROI | ||||
| Cerebrum | ↓ | ↓ | − | − |
| Occipital | − | − | ↑ | − |
| Parietal | ↓ | − | ↑ | − |
| Temporal | ↓ | ↓ | − | − |
| Sensorimotor | ↓ | − | ↑ | − |
(↓) significant stiffness decline compared to normal controls
(↑) significant stiffness increase compared to normal controls
(−) no significant stiffness change compared to normal controls
Figure 3.
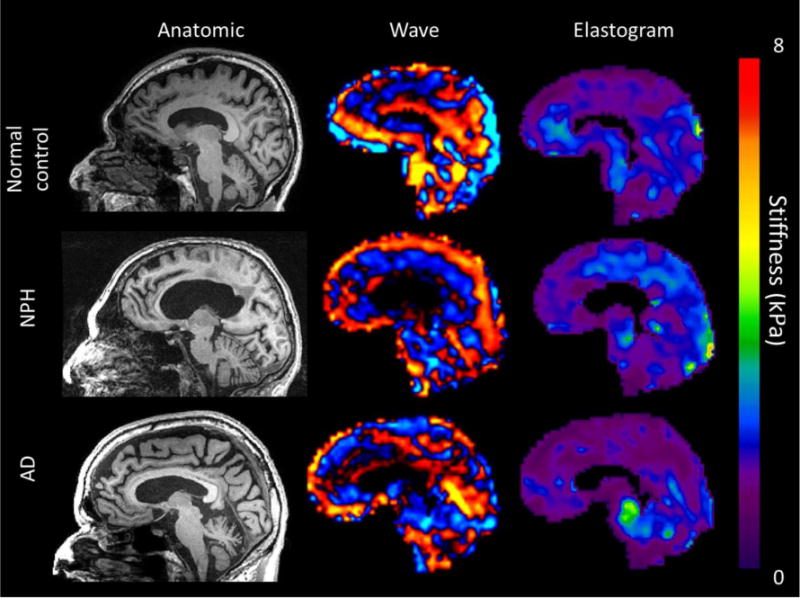
Sagittal T1WI, wave and elastogram images of three 86-year-old males: normal volunteer (top row), NPH patient (middle row), and AD patient (bottom row). Findings show increased parietal and occipital stiffness in the NPH subject, decreased frontal stiffness in both NPH and AD subjects, and decreased parietal stiffness in the AD subject.
Figure 4.
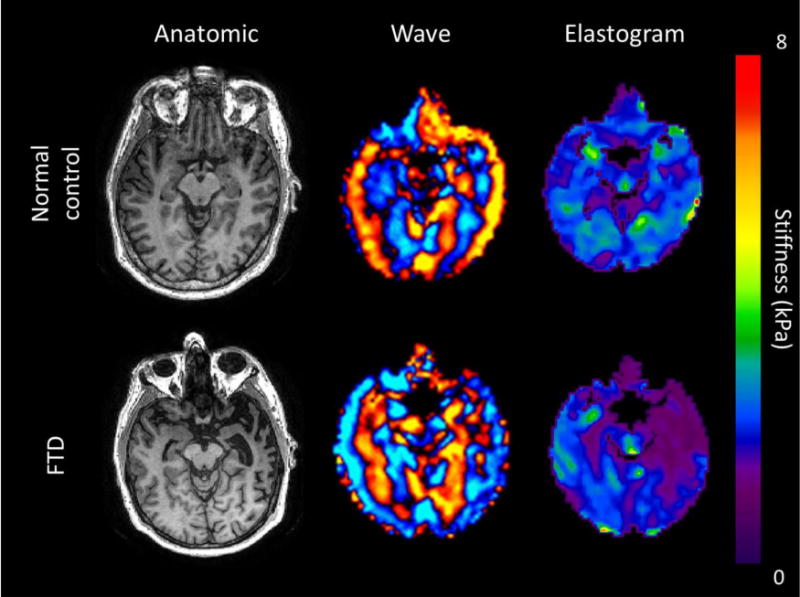
Axial T1WI, wave and elastogram images of two 65-year-old males: normal volunteer (top row) and FTD patient (bottom row). Findings show marked decrease of left temporal stiffness in the FTD patient with evident asymmetry. Note the corresponding “knife-blade” gyrus and widening of the left temporal horn on the anatomic image.
DISCUSSION
MRE shows promise for differentiating the major causes of dementia by quantitatively demonstrating their unique viscoelastic alterations of brain microstructure. Neurodegenerative types of dementia (AD & FTD) are associated with decreased stiffness as both diseases demonstrated significant softening of the entire cerebrum, as well as specific ROIs. Stiffness changes in the AD group occurred in accordance with the known topography of AD pathology and cortical atrophy [20]. Softening was primarily observed in the frontal, parietal and temporal lobes, mirroring the classically established patterns of FDG-PET [21]. It is currently known that AD pathology is not restricted to the cortex; white matter derangements also occur, as well as widespread cell death, neuronal and synaptic loss [2, 22, 23]. White matter damage has recently been suggested to occur even before grey matter damage [24]. This may explain the observed softening, and is consistent with findings of increased mean diffusivity and decreased fractional anisotropy on DTI [25, 26].
In FTD, the softening was prominent in the areas of expected anatomic involvement (the frontal and temporal lobes). This correlates with structural MRI and nuclear imaging studies, which show that fronto-temporal involvement is highly predictive of a diagnosis of FTD as opposed to AD [27, 28]. In addition, no significant stiffness differences were observed in any of the other brain lobes, demonstrating the specificity of the MRE technique to those regions affected in FTD. Since the parietal lobes and sensorimotor cortex are spared in FTD, their regional softening could potentially be used to differentiate AD from FTD. Additionally, asymmetrical atrophy of the frontal and temporal lobes is typical of FTD, but not as prominent in AD [29].
Because DLB did not show stiffness differences compared to normal controls, MRE could be used to differentiate DLB from other neurodegenerative dementias, which is often clinically difficult. Our findings correlate with MRI studies that have observed no significant structural changes in patients with DLB [30, 31]. The lack of stiffness change may be explained by α-synuclein deposition resulting in impaired brain function but limited cell death as opposed to amyloid- and tau-related dementias where cell death is a characteristic feature [32].
We observed a unique pattern of increased cerebral stiffness in NPH, one of the few treatable causes of dementia, most evident in the sensorimotor cortex. This may be attributed to underlying pathophysiologic theories explaining NPH including intermittent waves of increased intracranial pressure, low parenchymal compliance and increased pulse pressure [12, 33, 34]. A possible explanation for the sensorimotor strip stiffening could be the ventriculomegaly “squeezing” the high convexity gyri against the calvarium, corresponding to the high convexity gyral compression observed on structural MRI [12]. MRE could be a promising technique for further elucidating the uncertain pathophysiology of NPH.
We acknowledge several limitations in our study including the absence of vascular dementia in the study population. Also, even though all patients carefully fulfilled clinical criteria for the specific dementia types, there was no pathological confirmation of the diagnoses. Furthermore, most subjects were moderately advanced in the disease processes and it is necessary to determine how early in the disease process these stiffness changes are detectable. Hypothetically, MRE could potentially detect neurodegenerative softening early, before parenchymal atrophy occurs. Finally, overlap between the different dementia subtypes is known to occur and patients with multiple causes of dementia were not included in this study. In contrast to nuclear imaging, MRE is a noninvasive alternative, free of exposure to ionizing radiation and radioactive isotopes, and can be integrated within a structural MRI examination. The ability to measure characteristic viscoelastic alterations of brain stiffness in dementias may provide early disease detection and the ability to monitor disease progression as well as response to therapy.
CONCLUSIONS
In conclusion, MRE demonstrates a unique disease-specific, age-corrected, regional brain stiffness pattern in each of four subgroups of dementia patients (AD, DLB, FTD and NPH) in comparison to normal controls. Continued development of the MRE technique and future longitudinal studies will be important to expand our understanding of the clinical application of brain MRE in dementia.
ABBREVIATIONS
- MRE
Magnetic Resonance Elastography
- AD
Alzheimer’s disease
- DLB
Dementia with Lewy bodies
- FTD
Frontotemporal dementia
- NPH
Normal pressure hydrocephalus
- GM/WM
Grey matter/white matter
References
- 1.Alzheimer’s Disease International. World Alzheimer report. London: 2011. [Google Scholar]
- 2.Risacher SL, Saykin AJ. Neuroimaging biomarkers of neurodegenerative diseases and dementia. Semin Neurol. 2013;33:386–416. doi: 10.1055/s-0033-1359312. [DOI] [PMC free article] [PubMed] [Google Scholar]
- 3.Jack CR., Jr Alzheimer disease: new concepts on its neurobiology and the clinical role imaging will play. Radiology. 2012;263:344–361. doi: 10.1148/radiol.12110433. [DOI] [PMC free article] [PubMed] [Google Scholar]
- 4.Muthupillai R, Lomas DJ, Rossman PJ, Greenleaf JF, Manduca A, Ehman RL. Magnetic resonance elastography by direct visualization of propagating acoustic strain waves. Science. 1995;269:1854–1857. doi: 10.1126/science.7569924. [DOI] [PubMed] [Google Scholar]
- 5.Murphy MC, Huston J, 3rd, Jack CR, Jr, et al. Measuring the characteristic topography of brain stiffness with magnetic resonance elastography. PLoS One. 2013;8:e81668. doi: 10.1371/journal.pone.0081668. [DOI] [PMC free article] [PubMed] [Google Scholar]
- 6.Murphy MC, Huston J, 3rd, Jack CR, Jr, et al. Decreased brain stiffness in Alzheimer’s disease determined by magnetic resonance elastography. J Magn Reson Imaging. 2011;34:494–498. doi: 10.1002/jmri.22707. [DOI] [PMC free article] [PubMed] [Google Scholar]
- 7.Murphy MC, Jones DT, Jack CR, Jr, et al. Regional brain stiffness changes across the Alzheimer’s disease spectrum. Neuroimage Clin. 2016;10:283–290. doi: 10.1016/j.nicl.2015.12.007. [DOI] [PMC free article] [PubMed] [Google Scholar]
- 8.Huston J, 3rd, Murphy MC, Boeve BF, et al. Magnetic resonance elastography of frontotemporal dementia. J Magn Reson Imaging. 2016;43:474–478. doi: 10.1002/jmri.24977. [DOI] [PMC free article] [PubMed] [Google Scholar]
- 9.Streitberger KJ, Wiener E, Hoffmann J, et al. In vivo viscoelastic properties of the brain in normal pressure hydrocephalus. NMR Biomed. 2011;24:385–392. doi: 10.1002/nbm.1602. [DOI] [PubMed] [Google Scholar]
- 10.Fattahi N, Arani A, Perry A, et al. MR Elastography Demonstrates Increased Brain Stiffness in Normal Pressure Hydrocephalus. AJNR Am J Neuroradiol. 2016;37:462–467. doi: 10.3174/ajnr.A4560. [DOI] [PMC free article] [PubMed] [Google Scholar]
- 11.Roberts RO, Geda YE, Knopman DS, et al. The Mayo Clinic Study of Aging: design and sampling, participation, baseline measures and sample characteristics. Neuroepidemiology. 2008;30:58–69. doi: 10.1159/000115751. [DOI] [PMC free article] [PubMed] [Google Scholar]
- 12.Mori E, Ishikawa M, Kato T, et al. Guidelines for management of idiopathic normal pressure hydrocephalus: second edition. Neurol Med Chir (Tokyo) 2012;52:775–809. doi: 10.2176/nmc.52.775. [DOI] [PubMed] [Google Scholar]
- 13.McKhann G, Drachman D, Folstein M, Katzman R, Price D, Stadlan EM. Clinical diagnosis of Alzheimer’s disease: report of the NINCDS-ADRDA Work Group under the auspices of Department of Health and Human Services Task Force on Alzheimer’s Disease. Neurology. 1984;34:939–944. doi: 10.1212/wnl.34.7.939. [DOI] [PubMed] [Google Scholar]
- 14.McKhann GM, Knopman DS, Chertkow H, et al. The diagnosis of dementia due to Alzheimer’s disease: recommendations from the National Institute on Aging-Alzheimer’s Association workgroups on diagnostic guidelines for Alzheimer’s disease. Alzheimers Dement. 2011;7:263–269. doi: 10.1016/j.jalz.2011.03.005. [DOI] [PMC free article] [PubMed] [Google Scholar]
- 15.Rascovsky K, Hodges JR, Knopman D, et al. Sensitivity of revised diagnostic criteria for the behavioural variant of frontotemporal dementia. Brain. 2011;134:2456–2477. doi: 10.1093/brain/awr179. [DOI] [PMC free article] [PubMed] [Google Scholar]
- 16.McKeith IG, Dickson DW, Lowe J, et al. Diagnosis and management of dementia with Lewy bodies: third report of the DLB Consortium. Neurology. 2005;65:1863–1872. doi: 10.1212/01.wnl.0000187889.17253.b1. [DOI] [PubMed] [Google Scholar]
- 17.Manduca A, Oliphant TE, Dresner MA, et al. Magnetic resonance elastography: non-invasive mapping of tissue elasticity. Med Image Anal. 2001;5:237–254. doi: 10.1016/s1361-8415(00)00039-6. [DOI] [PubMed] [Google Scholar]
- 18.Sack I, Beierbach B, Wuerfel J, et al. The impact of aging and gender on brain viscoelasticity. Neuroimage. 2009;46:652–657. doi: 10.1016/j.neuroimage.2009.02.040. [DOI] [PubMed] [Google Scholar]
- 19.Arani A, Murphy MC, Glaser KJ, et al. Measuring the effects of aging and sex on regional brain stiffness with MR elastography in healthy older adults. Neuroimage. 2015;111:59–64. doi: 10.1016/j.neuroimage.2015.02.016. [DOI] [PMC free article] [PubMed] [Google Scholar]
- 20.Braak H, Braak E, Bohl J. Staging of Alzheimer-related cortical destruction. Eur Neurol. 1993;33:403–408. doi: 10.1159/000116984. [DOI] [PubMed] [Google Scholar]
- 21.Herholz K. PET studies in dementia. Ann Nucl Med. 2003;17:79–89. doi: 10.1007/BF02988444. [DOI] [PubMed] [Google Scholar]
- 22.Bertelson JA, Ajtai B. Neuroimaging of dementia. Neurol Clin. 2014;32:59–93. doi: 10.1016/j.ncl.2013.07.001. [DOI] [PubMed] [Google Scholar]
- 23.Bartzokis G, Cummings JL, Sultzer D, Henderson VW, Nuechterlein KH, Mintz J. White matter structural integrity in healthy aging adults and patients with Alzheimer disease: a magnetic resonance imaging study. Arch Neurol. 2003;60:393–398. doi: 10.1001/archneur.60.3.393. [DOI] [PubMed] [Google Scholar]
- 24.Amlien IK, Fjell AM. Diffusion tensor imaging of white matter degeneration in Alzheimer’s disease and mild cognitive impairment. Neuroscience. 2014;276:206–215. doi: 10.1016/j.neuroscience.2014.02.017. [DOI] [PubMed] [Google Scholar]
- 25.Sexton CE, Kalu UG, Filippini N, Mackay CE, Ebmeier KP. A meta-analysis of diffusion tensor imaging in mild cognitive impairment and Alzheimer’s disease. Neurobiol Aging. 2011;32:2322 e2325–2318. doi: 10.1016/j.neurobiolaging.2010.05.019. [DOI] [PubMed] [Google Scholar]
- 26.Damoiseaux JS, Smith SM, Witter MP, et al. White matter tract integrity in aging and Alzheimer’s disease. Hum Brain Mapp. 2009;30:1051–1059. doi: 10.1002/hbm.20563. [DOI] [PMC free article] [PubMed] [Google Scholar]
- 27.Talbot PR, Lloyd JJ, Snowden JS, Neary D, Testa HJ. A clinical role for 99mTc-HMPAO SPECT in the investigation of dementia? J Neurol Neurosurg Psychiatry. 1998;64:306–313. doi: 10.1136/jnnp.64.3.306. [DOI] [PMC free article] [PubMed] [Google Scholar]
- 28.Rosen HJ, Gorno-Tempini ML, Goldman WP, et al. Patterns of brain atrophy in frontotemporal dementia and semantic dementia. Neurology. 2002;58:198–208. doi: 10.1212/wnl.58.2.198. [DOI] [PubMed] [Google Scholar]
- 29.Boccardi M, Laakso MP, Bresciani L, et al. The MRI pattern of frontal and temporal brain atrophy in fronto-temporal dementia. Neurobiol Aging. 2003;24:95–103. doi: 10.1016/s0197-4580(02)00045-3. [DOI] [PubMed] [Google Scholar]
- 30.Kantarci K, Lowe VJ, Boeve BF, et al. Multimodality imaging characteristics of dementia with Lewy bodies. Neurobiol Aging. 2012;33:2091–2105. doi: 10.1016/j.neurobiolaging.2011.09.024. [DOI] [PMC free article] [PubMed] [Google Scholar]
- 31.Nedelska Z, Ferman TJ, Boeve BF, et al. Pattern of brain atrophy rates in autopsy-confirmed dementia with Lewy bodies. Neurobiol Aging. 2015;36:452–461. doi: 10.1016/j.neurobiolaging.2014.07.005. [DOI] [PMC free article] [PubMed] [Google Scholar]
- 32.Kovari E, Horvath J, Bouras C. Neuropathology of Lewy body disorders. Brain Res Bull. 2009;80:203–210. doi: 10.1016/j.brainresbull.2009.06.018. [DOI] [PubMed] [Google Scholar]
- 33.Hakim S, Adams RD. The special clinical problem of symptomatic hydrocephalus with normal cerebrospinal fluid pressure. Observations on cerebrospinal fluid hydrodynamics. J Neurol Sci. 1965;2:307–327. doi: 10.1016/0022-510x(65)90016-x. [DOI] [PubMed] [Google Scholar]
- 34.Mase M, Yamada K, Banno T, Miyachi T, Ohara S, Matsumoto T. Quantitative analysis of CSF flow dynamics using MRI in normal pressure hydrocephalus. Acta Neurochir Suppl. 1998;71:350–353. doi: 10.1007/978-3-7091-6475-4_101. [DOI] [PubMed] [Google Scholar]