

Abstract
RNA and DNA carry out diverse functions in biology including catalysis, splicing, gene regulation, and storage of genetic information. Interest has grown in understanding how nucleic acids perform such sophisticated functions given their limited molecular repertoire. RNA can fold into diverse shapes that often perturb pKa values and allow it to ionize appreciably under biological conditions, thereby extending its molecular diversity. The goal of this article is to enable experimental measurement of pKa's in RNA and DNA. A number of experimental methods for measuring pKa values in RNA and DNA have been developed over the last ten years, including RNA cleavage kinetics; UV-, fluorescence-, and NMR-detected pH titrations; and Raman crystallography. We begin with general considerations for choosing a pKa assay and then describe experimental conditions, advantages and disadvantages for these methods. Potential pitfalls in measuring a pKa are provided including the presence of apparent pKa's due to a kinetic pKa or coupled acid- and alkali-promoted RNA unfolding, as well as RNA degradation, precipitation of metal hydroxides and poor baselines. Use of multiple data fitting procedures and the study of appropriate mutants are described as ways to avoid some of these pitfalls. Application of these experimental methods to RNA and DNA will increase the number of nucleic acid pKa values in the literature, which should deepen insight into biology and provide benchmarks for calculations. Future directions for measuring pKa's in nucleic acids are discussed.
Keywords: pKa methods, theory, RNA biology, ribozyme, spectroscopy, absorbance, fluorescence, NMR, Raman crystallography
1. Introduction
Nucleic acids perform complex chemical functions such as catalysis, molecular recognition, and folding. The building blocks of RNA are rather simple, consisting of the ribose sugar-phosphate backbone, and four similar nucleobases. One way RNA achieves additional functionality is through ionization of its nucleobases and sugar-phosphate backbone. To motivate experimental measurement of RNA pKa values, we provide a brief background on RNA ionization and roles for charged bases in the Introduction; in-depth discussion of these issues is available elsewhere (Bevilacqua, Brown, Nakano, & Yajima, 2004; Wilcox, Ahluwalia, & Bevilacqua, 2011). The remainder of the article provides practical descriptions of various approaches available for measuring RNA pKa'sas well as potential problems.
Sites of ionization and unperturbed pKa values in RNA are provided in Figure 1. Typically, all four nucleobases are uncharged at biological pH: A and C are unprotonated on their imino nitrogens, while G and U are protonated. Under acidic pH conditions the imino nitrogens of A and C protonate and become cationic with unperturbed pKa values between ∼3.6-4.3 (Izatt, Christensen, & Rytting, 1971), while under basic pH conditions the imino nitrogens on G and U deprotonate and become anionic with unperturbed pKa values near ∼9.2-9.6 (Izatt et al., 1971). Each phosphodiester in the backbone has a low pKa, near ∼1, and so is negatively charged. Any terminal phosphate monoester has the potential for being dianionic, with the higher pKa being near neutrality. Biological importance of a phosphate monoester is unclear, however, given that most eukaryotic mRNAs have a 5′ cap. The 2′OH of the ribose sugar has a high pKa, between ∼12 to 14, and so is neutral at biological pH. Ionization of the 2′OH is important for ribozyme catalysis and RNA degradation (Izatt et al., 1971; Li & Breaker, 1999; Velikyan, Acharya, Trifonova, Földesi, & Chattopadhyaya, 2001).
Figure 1.
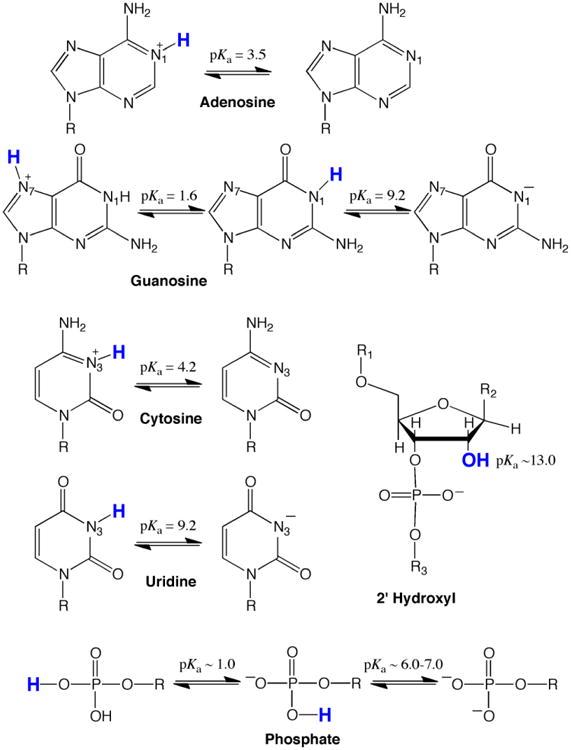
Sites of protonation and pKa's of the four nucleobases and the ribose-phosphate backbone. Note that all unperturbed nucleobases are primarily in their neutral form at biological pH (∼7.2). All nucleobase ionizations are on the Watson-Crick imino nitrogens, which are numbered, except for the left-hand ionization of guanosine, which is on the Hoogsteen face N7.
Individual pKa's in an RNA molecule are often perturbed from the above values, making measurement important. Secondary and tertiary structure, including hydrogen bonding, stacking, phosphate positioning, and metal-ion coordination, can perturb pKa values. For instance, hydrogen bondingi of the neutral nucleobases shifts the pKa of the imino nitrogen further away from neutrality owing to coupling of ionization and folding (Legault & Pardi, 1997; Moody, Lecomte, & Bevilacqua, 2005). The imino nitrogen pKa's for A and C thus shift even lower than 3.5, while those on G and U shift even higher than 9.5. In other words, hydrogen bonding of neutral bases generally disfavors nucleobase ionization. Hydrogen bonding of positively or negatively ionized nucleobases, on the other hand, typically shifts a pKa towards neutrality; additionally, a high local electrostatic potential can favor protonation (Bevilacqua et al., 2004; Moody et al., 2005; Tang, Alexov, Pyle, & Honig, 2007; Wilcox et al., 2011). Such pKa shifting may enable RNA to perform specialized catalytic and molecular recognition functions under biological conditions. Additionally, certain organelles (Tang et al., 2007) and disease states have altered pH gradient (both intra- and extra-cellular) (Gerweck & Seetharaman, 1996; Griffiths, 1991), which could generally facilitate ionization.
Prior experimental studies on a number of ribozymes have uncovered shifting of putative general acid adenine and cytosine pKa's towards neutrality including the HDV (Gong et al., 2007; Nakano & Bevilacqua, 2007; Nakano, Chadalavada, & Bevilacqua, 2000), hairpin (Cottrell, Scott, & Fedor, 2011; Guo et al., 2009) and lead-dependent ribozymes (Legault & Pardi, 1994), arguing for a role as a cationic protonated nucleobase in the reactant state. Additionally, studies have revealed importance of pKa shifting in ligand/cofactor binding to riboswitches as well. For example, the glmS riboswitch-ribozyme has a pKa for the exocyclic amine of the GlcN6P shifted downwards towards neutrality, while it has a pKa for the phosphate of GlcN6P shifted upwards towards neutrality. (Gong, Klein, Ferré-D'Amaré, & Carey, 2011) In addition, the purine riboswitch binds xanthine strongly at low pH but not at high pH, consistent with xanthine's pKa near neutrality.(Gilbert, Reyes, Edwards, & Batey, 2009) Experimental pKa approaches applied in these instances include kinetics, fluorescence, NMR, and Raman crystallography—all described herein. At the same time, fluorescence and kinetics experiments have indicated that putative general base guanine pKa's are shifted away from neutrality including in the hairpin and glmS ribozymes, arguing for a role as a neutral protonated nucleobase in the reactant state (Liu, Cottrell, Scott, & Fedor, 2009; Viladoms, Scott, & Fedor, 2011).
Lastly, the methods described herein apply equally to DNA in its single-stranded and double-stranded form, and should apply to complex DNAs such as deoxyribozymes. In fact, we have already applied these methods to dsDNA in several instances to reveal effects of helix position, temperature, and ionic strength on DNA pKa's using NMR and fluorescence (Moody, Brown, & Bevilacqua, 2004; Siegfried, O'Hare, & Bevilacqua, 2010; Wilcox & Bevilacqua, 2013).
Theory has potential to identify shifted pKa's and reveal molecular driving forces. Theoretical advances have been made in the area of pKa prediction (Lee, Salsbury, & Brooks, 2004; Moser, Range, & York, 2010; Tang et al., 2007). It is our hope that the experimental approaches described herein will lead to more RNA and DNA pKa measurements, which will benchmark and thus help advance nucleic acid pKa calculations.
2. Experimental Parameters For pH Titrations
In this section we outline key experimental considerations for choosing, designing, and interpreting a pKa experiment. Potential pitfalls in pKa determination are indicated, with emphasis placed on data fitting procedures and pKa assignments through appropriate mutants as ways to avoid these pitfalls. We also discuss general effects of pH on RNA conformation and configuration.
2.1. Potential pitfalls: pH-promoted RNA unfolding, RNA degradation, and poor baselines
In this article we describe obtaining pKa's on both folded and unfolded nucleic acids. The interest in folded RNA and DNA is that these species often have the pKa's closest to neutrality due to hydrogen bonding with ionized bases and due to electrostatic potentials, and they serve interesting biological roles. For instance, dsRNA is important for miRNA regulation of gene expression, ribozymes regulate viral replication and gene expression, and mutations in dsDNA are important for fidelity of DNA replication. The interest in unfolded RNA and DNA is that these provide pKa's for the functional groups that are furthest from neutrality, such as the 2′OH, and also serve to complete thermodynamic cycles linking pKa values and RNA folding (Moody et al., 2005).
The most difficult part of conducting a pKa experiment on a folded RNA or DNA is isolating the two-state ionization of interest from interfering processes. Ideally, the pH range in a pKa experiment should go from 2 units below the pKa to 2 units above. This range allows the fraction of protonated RNA to vary from ∼99% to ∼1% to provide linear baselines over the first and last ∼0.5 pH units. Optimally, 12 to 25 evenly spaced data points should be collected over this pH range. Achieving this four-unit pH range often poses a problem, however, as RNA unfolds at strongly acidic or alkaline pH. Acid- and alkali-promoted denaturation of RNA structure occurs because of competition for hydrogen bonding (Figure 2).
Figure 2.
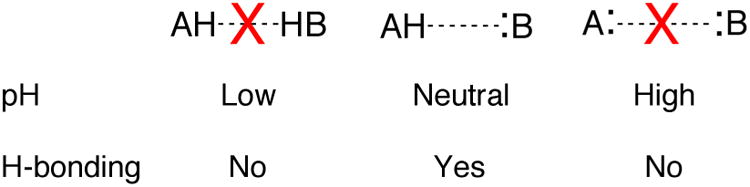
Schematic representing loss of hydrogen bonding under acidic and alkaline pH conditions. Note that neutral pH is optimum for hydrogen bonding. At very low and high values (<∼5 and >∼9), the pKa may become biased due to the competition of solvent ions with hydrogen bonding.
Acid or alkaline denaturation interferes strongly with pKa measurement, as its dependence on pH is often steep (Moody et al., 2005). We have provided a formalism for handling linkage between proton binding and folding in RNA (Moody et al., 2005) and recently applied it to NMR-detected pH titrations (Figure 3A) (Siegfried et al., 2010). While this treatment is beyond the scope of this paper, it is important to be mindful of the detrimental effects extreme pH can have on RNA folding. The experimental range should be limited in the pH 5 to 9 region and if pH 4 or 10 is needed, GC base pairing can be engineered to help avoid denaturation. If denaturation does occur, which should be obvious from steep outer transitions, we suggest showing the denaturation data but not including it in the fit (Figure 3B). Additionally, apparent pKa's (data that can be fit to a pKa equation but are not due to an ionization) that creep towards neutrality occur when multiple unperturbed ionizations independently affect RNA stability (Figure 3C) (Knitt & Herschlag, 1996). In this case there is no ionization near neutrality and the data should not be reported as such.
Figure 3.
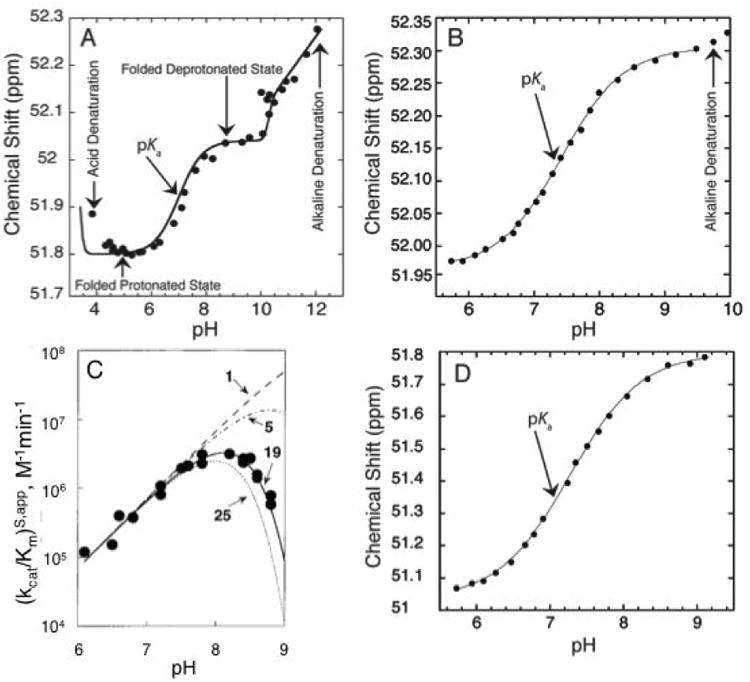
Different factors affecting observed pKa. A) 1P NMR-based pH titration over a wide pH range (4.0-12.0) of a 19 mer dsDNA containing an A+•C wobble base pair. The plot shows five regions: acid denaturation (negative slope between pH ∼3.8-4.5), protonated folded state (flat slope between pH ∼4.5-6.0), ionization of the wobble base pair (positive slope between pH∼6.0-8.0), deprotonated folded state (flat slope between pH ∼8.0-10.0), and alkaline dentaturation (positive slope between pH ∼10.0-12.0). Adapted with permission from Siegfried et al. 2010. Copyright (2010) American Chemical Society. B) 31P NMR-based pH titration of DNA with interference from alkaline denaturation. The data above pH 9.4 were not included in the fit to Eq. (3) to obtain pKa. Adapted with permission from Wilcox et al. 2013. Copyright (2013) American Chemical Society. C) The pH-dependent cleavage of RNA under constant Na+ concentration. The different lines represent the number of independent ionizations affecting the observed pKa. The solid line represents 19 independent ionization events each with a microscopic pKa∼9.4, which gives rise to an apparent pKa of ∼7.6. Adapted with permission from Knitt et al. 1996. Copyright (1996) American Chemical Society. D) 31P NMR-based pH titration of DNA with no interference from unfolding. The observed pKa is close to neutrality and is easily determined with the ideal complete baselines. Adapted with permission from Wilcox et al. 2013. Copyright (2013) American Chemical Society.
Considering the above issues of pH-promoted RNA unfolding and degradation, the easiest pKa's to measure experimentally in a folded RNA are close to neutrality. This is a nice coincidence since such pKa values are often the ones of greatest functional interest. Figure 3D provides an NMR-detected pH titration with a pKa near 7 that has ideal behavior—full baselines and no interference from RNA unfolding (Figure 3D). Most experiments on folded RNAs do not show such ideal behavior, however (Figure 3A-C): RNA functional groups either do not have pKa values in the neutral pH range or the signal change is not as strong. In these instances, a lower or upper limit to the pKa value may be all that one can obtain.
The most difficult part of conducting a pKa experiment on an unfolded RNA or DNA is obtaining quality data at high pH. Difficulties include precipitation of divalent metals as metal hydroxides and carbonates, and the high ionic strength that occurs at high pH (and thus at all pH if ionic strength is kept constant). These issues are described in Section 3.2., and procedures to estimate baselines for these cases are described in Section 4.1. Additionally, bear in mind that RNA can readily degrade at pH values greater than 10 in single stranded regions (Soukup & Breaker, 1999) and other hot spots (Kierzek, 1992a, 1992b). Such degradation is exacerbated at elevated temperatures and in the presence of divalent ions, especially transition metals. At the end of any titration, but especially one that extends above pH 10, the RNA should thus be checked for degradation by denaturing PAGE with Sybr Gold or 5′-kinase detection.
2.2. Choosing the pH probe and meter
When carrying out pH titrations, it is essential that the pH probe provide an accurate reading. The probe should be calibrated with pH standards within the range of the pH titration and at the temperature of the reaction. In general, we titrate from high to low pH through the introduction of small volumes of HCl (∼1 μL additions of a pH ∼1 solution). This approach avoids adding metal ions via a metal hydroxide. We aim for 12-25 evenly spaced pH data points and adjust the concentration of HCl empirically to accomplish this with additions of just a 1-2 microliters; note that we do not attempt to get certain exact pH values. We therefore first calibrate the meter with pH 7 and 10 standards. For fluorescence experiments, we use colorless calibration standards (BDH General-VWR) to avoid potential contamination of the probe with fluorophores. Also, fresh standards are used for calibration to avoid any problems with breakdown of the standards, dissolved CO2 (g), or cross-contamination. Note: The use of buffers is described in Section 2.3.
The pH of the solution should be measured before and after each data point to ensure that pH is maintained throughout the course of the measurement. Good mixing of the sample and the acid is critical and can obtained either by multiple inversions or multiple mixings with a Pipetman set to 1 mL. In general, the two pH readings should agree within 0.05 units and their average is used in the pKa fitting. If the two readings differ by more than this, then the probe should be recalibrated and the measurement repeated. While the spectrum of interest is being collected, we submerge the probe in the pH 7 standard. During the course of the titration, once the pH nears ∼7, the probe should be recalibrated in the pH 4 and 7 standards.
Our lab has used an Accumet 3 mm micro combination electrode with a calomel reference or a Mettler Toledo 3 mm diameter AgCl reference measured on a Corning 430 or Accument AB15 basic pH meter (Moody et al., 2004). More recently, we have employed a stainless steel ISFET micro pH probe (IQ Scientific Instruments) with a Hach IQ150 or IQ160 pH meter (Siegfried, O'Hare, & Bevilacqua, 2010; Wilcox & Bevilacqua, 2013; Ganguly et al., 2014). This probe, which is inert to RNA and DNA and considerably more durable than the glass probe, fits inside tubes of >3 mm diameter. It can thus be used to measure pH directly in 4 mm NMR tubes (see section 4.4); in these cases only ∼200 μL of sample is need to obtain a reading.
2.3. Whether to use a buffer
For assays where the RNA concentration is very low (e.g. nM) such as ribozyme kinetics, conventional buffers such as HEPES or MES are utilized to maintain pH. In Raman crystallography, conventional buffers are also utilized so that a constant pH solution can permeate the crystals. Not all pH titrations require addition of a conventional buffer, however. When the RNA concentration is relatively high (e.g. μM to mM) such as in UV-, fluorescence-, and NMR-detected pH titrations, the RNA can effectively buffer itself. In these cases, a conventional buffer is not used; instead, small amounts of a dilute solution of HCl are added directly to the RNA sample to change the pH. The new pH is then read out with a pH meter (see Section 2.2 for use of acid over base). For measurements of the 2′OH pKa, metal hydroxide is utilized to achieve the desired high pH value, with each pH data point prepared separately. In these cases, the ionic strength is adjusted to a desired constant value with metal chloride. Experiments conducted in the absence of a conventional buffer have the advantage that data collection is generally rapid. It is also possible to prepare a series of buffers at fixed pH values for fluorescence titrations by a fluorescence plate reader, which can also facilitate high throughput (Liu et al., 2009).
2.4. Corrections to the pH meter reading and the use of pH paper
The meter reading from a conventional pH electrode can be perturbed by moderate to high ionic strength, especially if cations are small monovalents such as Na+ or Li+. In such instances, the pH meter reading should be corrected. We do so by preparing standard solutions of a strong acid (e.g. HCl) and a strong base (e.g. NaOH) between 10-2 and 10-4 M (Chadalavada, Cerrone-szakal, Wilcox, Siegfried, & Bevilacqua, 2012). A calibration curve of actual pH (= −log aH+) versus measured meter reading is made for these standards, in a back ground of constant ionic strength of interest. The calibration curve is then used to obtain the actual pH from a pH meter reading of the sample at the same ionic strength. Lastly, a simple but powerful technique useful in any of the experiments below is to spot a very small volume (<1 μL) of the reaction on pH paper and make a reading. There is a large assortment of pH paper available, including some that give readings with an accuracy of 0.2 units or better. This simple process, which requires extremely little sample and is convenient for radioactive samples, gives the experimentalist confidence that pH is where he/she expects and is not being affected by addition of salts, gases, or any other additives.
2.5. Choosing an experimental method and assigning the pKa
A major consideration is choosing the experimental method for pKa determination. This choice is closely linked to assigning the observed pKa to a specific residue. For instance, the pH dependence of reaction kinetics (Section 3) provides just an overall observed pKa for the RNA. It then becomes necessary to decide whether the dependence of rate on pH reflects a true ionization event or a change in the rate-limiting step, which may not be associated with an ionization event. Even when the pKa reflects a true ionization event, assigning the pKa to a specific residue requires mutagenesis and re-measuring of the rate-pH profile (Nakano et al., 2000). One can also make mutants that shift the pKa by substitution of related bases, for example substituting A for C (see Section 3.1). Methods employing UV-, fluorescence-, NMR-, and Raman-detection also require mutagenesis to assign the pKa, to a specific residue, typically by making base pair changes that prevent ionization by base pairing the motif (see Sections 4.2-4.5).
At the other end of the spectrum, NMR can inform on the specific atom ionizing, either through assignment of the spectrum or by installation of a functional group that shifts a resonance to an isolated region of the spectrum (Section 4.4) (Moody et al., 2004; Siegfried et al., 2010). Fluorescence, likewise, can hone in on an ionizing base through judicious incorporation of a stacking-sensitive base such as 2-aminopurine (Wilcox & Bevilacqua, 2013) or incorporation of a modified purine such as 8-azaguanine or 8-azaadenine (Section 4.3) (Cottrell et al., 2011; DaCosta, Fedor, & Scott, 2007; Liu et al., 2009; Viladoms et al., 2011). Some pH titration detection methods can be used without any labeling of the RNA at all, which is advantageous as the potential for perturbation by the label is removed. Non-labeling methods for pKa determination include detection by UV spectroscopy (Section 4.2); 1H, 13C and 15N NMR (Section 4.4); and Raman microscopy (Section 4.5).
3. RNA Cleavage Kinetics
Kinetics assays are often utilized to obtain a pKa in RNA systems and can be used in naturally occurring ribozymes as well as selected ones such as kinase ribozymes.(Bevilacqua, 2008; Biondi et al., 2013) The rate of self-cleavage of a ribozyme or a chimeric oligonucleotide containing a single ribose linkage is monitored as a function of pH to obtain an observed pKa. The former is a folded RNA, while the latter is typically an unfolded RNA. In these cases, it is important to determine whether the observed pKa is due to ionization of a residue or to a change in the rate-limiting step, and to assign the pKa to an appropriate residue.
3.1 Ribozyme cleavage
Previous work from our lab has focused on the reaction mechanism of the HDV ribozyme (Cerrone-Szakal, Siegfried, & Bevilacqua, 2008; Nakano, Cerrone, & Bevilacqua, 2003; Nakano et al., 2000). Both cis- and trans-acting versions of the ribozyme have been used to determine pKa's. For each of the methods described below, the 5′ or 3′ terminal nucleotide is radiolabeled. General procedures for radiolabeling RNA are available elsewhere (Bevilacqua, Brown, Chadalavada, & Parente, 2003). 32P-labeling enables high sensitivity and we typically work with very low RNA concentrations, near a few nM. Alternatively, the RNA can be end-labeled with a fluorophore (Qin & Pyle, 1999).
In trans-acting ribozymes, experiments are typically conducted under single-turnover conditions in which the enzyme is in excess over the substrate. To ensure that the enzyme concentration is saturating, control experiments with several concentrations of enzyme are carried out and similar rates should be obtained. Typically the enzyme and the substrate strand are annealed at 95 °C, followed by cooling at room temperature for 10 min. The pH is maintained by the addition of 25-50 mM buffer. We typically use the Good buffers as these are largely non-reactive and do not bind most metal ions (Good et al., 1966); MES for pH 4.5-6.5; HEPES for pH 6.5-8.0; and CAPS- for pH 8.0-9.0. Controls include using different buffers at the same pH in the pH overlap region, as well as several different concentrations of the same buffer to test whether buffer contributes to the reaction. The reaction is usually initiated by the addition of metal ion, and time points are removed as small volume aliquots, quenched in excess EDTA, and placed on powdered dry ice. The reactant and the product are fractionated by PAGE and the gels are dried and quantified using a Typhoon PhosphoImager (MolecularDynamics). The fraction of the substrate cleaved is fit to a single-exponential equation using non-linear curve program with a Levenberg-Marquadt algorithm such as Kaleidagraph (Synergy Software):
| (1) |
where fcleaved is the fraction of the cleaved substrate, A is the fraction of the substrate cleaved at completion, −B is the amplitude of the reaction, (A+B) is the burst phase, (1-A) is the fraction that never cleaves, and kobs is the observed first-order rate constant. The observed rate constant kobs is then plotted versus the pH, and fit to the Henderson-Hasselbach equation for a one-channel mechanismii to obtain the pKa of the reaction:
| (2a) |
where kmax is the maximal observed rate constant and n is the Hill coefficient, which may be related to the number of ionization events.
There are two typical ways to plot rate constant-pH data and both are provided in Figure 4. (The sample data shown here are for chimeric oligonucleotides, which contain a single ribose linkage, but apply equally well to ribozymes).
Figure 4.
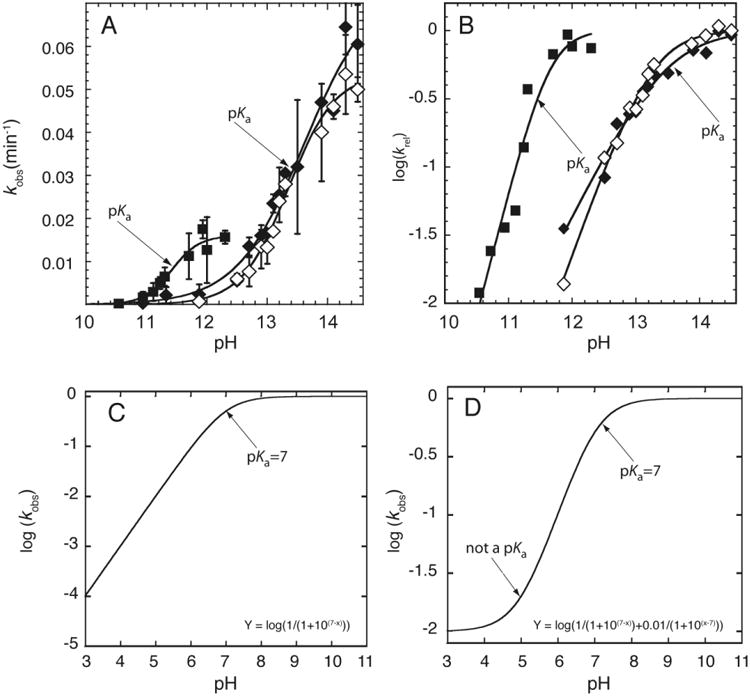
RNA cleavage kinetics-based determination of pKa. A) Plot of kobs versus pH. The pKa is determined by fitting the plot to Eq. (2). The pKa can be visually identified by the inflection point, which is the point at which kobs is equal to half of the kmax. Adapted with permission from Ganguly et al. 2014. Copyright (2014) American Chemical Society. B) Plot of log (kobs) versus pH. The pKa is determined by fitting the plot to Eq. (2b). The rounding or ‘flex’ point and the slope of the line in the log linear region can be utilized to visually determine the pKa and the Hill coefficient, respectively. Adapted with permission from Ganguly et al. 2014. Copyright (2014) American Chemical Society. C & D) Simulated plot of log (kobs) versus pH, in which (C) the rate increases log linearly (slope ∼ 1) with pH, and (D) the rate decreases log linearly and then levels off at low pH without a low pKa (Adapted from Bevilacqua et al. 2003).
In the first method, kobs is plotted versus pH and y is fit directly to Eq. (2) (Figure 4A). This method has the advantage that kmax can be read graphically from the maximum y-value and the pKa can be found at the inflection point, which is the pH where kobs is half kmax. In the second method, log kobs is plotted versus pH and y is fit to the logarithm of the entire expression on the right-hand side of Eq. (2a) to give Eq. (2b) (Figure 4B).
| (2b) |
This method has the advantage that n can be read graphically from the slope in the low-pH linear portion of the plot; in this plot, the pKa is near the rounding or ‘flex' point of the curve. A subtle but important point is that rate data can contribute meaningfully to such a logarithmic plot even at pH values far below the pKa. This is because one can usually collect longer time points. This property of logarithmic plots is useful for detecting poorly populated species that may be important for a reaction, something not afforded by spectroscopic approaches as described in Section 4.
Poor fitting of data to Eq. (2a) can happen for one of several reasons. If the rate does not decrease log-linearly with decreasing pH but instead levels off in a sigmoid-like fashion, it can be due to a second reaction channel that opens at low pH in which the other ionization state contributed to the reaction. This is essentially a pH-dependent change in the rate-limiting step and can give rise to an apparent pKa, as labeled in Figure 4D. Furthermore, if the rate decreases more steeply with increasing pH than expected, it could be due to an apparent pKa arising from multiple independent ionizations (Knitt & Herschlag, 1996); e.g. Knitt and Herschlag showed that 19 independent ionizations of unperturbed value 9.4 give rise to an apparent pKa of 7.6 (Figure 3C) (Knitt & Herschlag, 1996). This can be spotted by failure of Eq. (2a) but success of Eq. (3) in fitting the data.
| (3) |
As mentioned, these are not true microscopic ionizations near neutrality and should not be reported as such.
The pKa obtained from kinetics experiments could also be due to a change in the rate-limiting step, often referred to as a “kinetic pKa” (Fersht, 1985). To test whether chemistry is rate-limiting in the plateau region one should conduct a solvent isotope effect test or measure a phosphorothioate effect in this region (Frederiksen & Piccirilli, 2009; Nakano et al., 2000). Typically solvent isotope effects are 3-7 fold if chemistry is rate-limiting (Fersht, 1985), while thio effects can be from ∼5 to more than 1,000 (Dahm & Uhlenbeck, 1991; DeRose, 2003; Frederiksen & Piccirilli, 2009; Kraut, Carroll, & Herschlag, 2003). Although these tests are not foolproof, they provide support that chemistry is rate-limiting in the plateau region. Additionally, the putative ionizing base can be mutated to a related base with a different pKa. For example, the C75A mutant helped assign the observed pKa to C75 by observation of a shift in the ribozyme-measured pKa similar to the shift in the pKa between CMP and AMP (Izatt et al., 1971; Nakano et al., 2000). Ultimately, it is best to pursue a complementary method of pKa determination in which population is directly measured through a spectroscopic technique as a function of pH, such as described in the Section 4. In sum, ribozyme cleavage kinetics provide a way to attain a pKa of any RNA or DNA enzyme, naturally occurring or selected. The equations for extracting a pKa are provided, but one has to be wary of pitfalls as described above.
3.2 Chimeric oligonucleotide cleavage
As mentioned above, there is keen interest in measuring the pKa of the 2′OH since it is a common nucleophile in ribozymes and mRNA degradation. A convenient approach to measure the pKa of the 2′OH, which is typically between ∼12 and 14, has been developed by Li and Breaker (Li & Breaker, 1999). This assay relies on the pH-dependent cleavage of an unfolded chimeric oligonucleotide containing a single ribose linkage; it can be used to compare the effect of metal ions and RNA sequence on the pKa of the 2′OH (Ganguly et al., 2014; Li & Breaker, 1999). The chimeric oligonucleotide is labeled on its 5′-end as described above, renatured at 90°C, and its cleavage is monitored as a function of pH. Samples are neutralized with 100 mM Tris pH 7.0, fractionated by PAGE, and analyzed on the PhosphorImager. Data are fit to the same equations as in subsection 3.1, namely Eqs (1)-(2b). It is important to maintain constant ionic strength throughout the pH range of the experiment, which is pH∼10.0-14.0 for monovalent ions, and pH∼9.0-12.0 for divalent ions. This is achieved by adding specific volumes of metal hydroxide solutions (e.g. NaOH or KOH) in the presence of appropriate volumes of metal chloride solutions (e.g. NaCl or KCl).
Unfortunately, the same chimeric oligonucleotide cleavage experiment cannot be carried out in the presence of divalent metal ions such as Mg2+ owing to the precipitation of magnesium hydroxide above pH ∼9. The reaction can, however, be performed in the presence of Ca2+; e.g. pH 12.2 can be achieved in 10 mM Ca2+ (Figure 4A, B) (Ganguly et al., 2014). Calcium hydroxide does pose a new experimental problem, though, which is the formation of CaCO3 precipitates in the presence of CO2 (aq). Solutions must therefore be degassed to remove dissolved CO2 and the reactions carried out under an inert gas atmosphere (preferably argon). One limitation of this method is that metal-bound hydroxide could contribute to the observed pKa. To assure measurement of the pKa on the 2′OH itself, we used an RNA-centric proxy of ionization, namely chemical shift of the H1′ sugar proton on the RNA itself (see Section 4.4). To summarize, pKa values for the 2′OH can be attained in model oligonucleotides using many of the same methods and equations
4. Spectroscopic-Detected Methods
4.1 General considerations for spectroscopic-detected pH titrations
The next four subsections describe experimental approaches for measuring pKa's that rely on readout through a spectroscopic approach. Absorbance and NMR are label-free methods and so least likely to perturb the pKa on the RNA. In these, a given observed spectroscopic signal Sobs (e.g. absorbance A, fluorescence F, chemical shift δ, or Raman intensity I) is plotted versus pH and fit to Eq. (4) to obtain the pKa:
| (4) |
where Sobs is the observed signal at a given pH, SAH is the signal at low pH, SA is the signal at high pH, and n is the Hill coefficient, which may be related to the number of ionization events. If the data warrant, SAH and SA can be set equal to sloping lines, which gives rise to two more variables that can be fixed to constants if long enough baselines can be measured. Additionally, if n is found to be ∼1 some researchers will fix the value at unity. We prefer to report the value of n to see its range, but this is really a matter of style and has little effect on final free energy values if consistency in usage of n is maintained. Equation 4 is similar to Eq. (2), but differs in that both the protonated and unprotonated states contribute in Eq. (4), while only one of the two states (the reactive state) contributes in the one-channel model in Eq. (2). Furthermore, unlike Eq. (2), the logarithm of Eq. (4) is generally not taken because data cannot be extended past ∼5-95% of the maximum signal due to poor signal-to-noise, which generally requires plotting over ∼4 pH units centered at the pKa. If the data do not fit well to Eq. (4), it could be because of acid or alkaline denaturation or perhaps due to apparent pKa's from multiple ionizations (Figures 3A-C).
In some cases, one of the baselines cannot be obtained, which could be due to pH denaturation of folded RNA or precipitation of metal hydroxides. In these cases, it may be possible to estimate the missing baseline through an approximation such as shown in Eq. (5) (Ganguly et al., 2014; Velikyan et al., 2001).
| (5) |
As mentioned in Section 2.3, a conventional buffer is not added for UV-, fluorescence-, and NMR-detected pH titrations and instead the RNA buffers itself.
4.2 UV absorbance-detected pH titrations
The four nucleobases absorb UV light quite strongly and ionization of the nucleobases generally leads to a change in extinction coefficient (Bock, Ling, Morell, & Lipton, 1956). This makes changes in UV absorbance a convenient and label-free (i.e. non-perturbing) method for determining a pKa (Moody et al., 2005). The extent of change in the UV spectrum upon ionization is different for each of the four bases. For CTP, UTP, and GTP there are striking differences in the absorbance spectra upon ionization, with absorbance increasing at some wavelengths and decreasing at others (Bock et al., 1956). For ATP, there are also differences in the spectra upon ionization, but the effects are more subtle. This means that one can estimate which of the four bases is ionizing by comparing the pH difference UV-spectrum (i.e. difference of the high and low pH baseline spectra) of the sample of interest to the pH difference UV-spectrum of the four bases. As the ionizing RNA gets larger, the contribution of the ionizing base diminishes on a percentage basis but still can be detectable for reasonably size RNAs, especially if the ionizing base is C, G, or U; as described below, we have applied this to a 19mer. Figure 5A,B shows that the ionization of C in an unfolded oligonucleotide is readily detectable in the background of UC and UUCUU.
Figure 5.
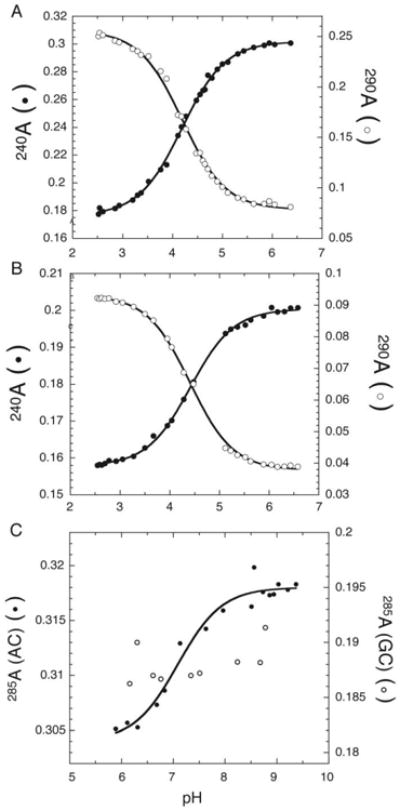
UV absorbance-based determination of pKa. A & B) Plot of absorbance at 240 nm (solid circles) and 290 nm (open circles) versus pH to determine pKa of cytosine in two unstructured nucleotides (A) UC, and (B) UUCUU. C) Plot of absorbance at 285 nm for a 19 mer oligonucleotide containing A+•C wobble pair (solid circles), and a controloligonucleotide containing an GC base base pair (hollow circles). Note: The shifted pKa due to the formation of the protonated A+ •C wobble pair could be detected even though the magnitude of hyperchromicity is only 4%. The pKa was determined by fitting the data to Eq. (4). (Adapted from Moody et al. 2005).
Hyperchromicity in the 260-280 nm region arising from unstacking of an unfolded hairpin upon deprotonation can be used to monitor a pKa as well. Even a 4% change in hyperchromicity provides ample signal change to measure a pKa in a 19mer with a single A+•C wobble pair (Figure 5C, closed symbols). In principle, even larger RNAs could be studied if the ionizing base were other than A, given the greater spectral change (Bock et al., 1956). A control in which this is replaced by a Watson-Crick base pair leads to loss of signal and helps assign the pKa (Figure 5C, open symbols).
To obtain a pKa in a UV absorbance-detected pH titration, absorbance is measured at different pH values according to the general principles provided in Section 2. Briefly, experiments are usually carried out in 100 mM KCl to mimic biological conditions and to offset small changes in salt concentration during the pH titration. Before the start of the experiment the spectrophotometer is zeroed in the presence of 100 mM KCl. The oligonucleotide is heated at a temperature greater than the denaturing temperature to ensure unfolding (usually 90°C) and added to the cuvette with the buffer containing 100 mM KCl. Because the percentage signal change in UV absorbance-detected titrations can be small, do not remove the cuvette throughout the titration. Instead use a ring stand to lower the pH meter into the cuvette, and mix the small volume acid into the sample with a Pipetman set to 1 mL. Data are fit to Eq. (4) to obtain the pKa and Hill coefficient. In sum, UV-detected pH titrations provide a very general and label-free manner to attain a pKa in any functional RNA or DNA and should work with RNAs of 20 or more bases, including small riboswitches and ribozymes.
4.3 Fluorescence-detected pH titrations
A limitation of absorbance detection is that absorbance changes throughout the titration can be relatively small since changes in base pairing and stacking upon ionization can be modest. One way to overcome this is to install a fluorescent base at a unique location in the RNA or DNA that is sensitive to either local unfolding/folding or an overall conformational change. Fluorescence-detected methods generally offer several advantages over absorbance. Fluorescence is much more sensitive than absorbance, allowing more dilute samples to be used; the change in signal is localized to a specific region of the RNA or DNA; and the change in signal tends to be larger than with absorbance.
Recently, our lab utilized fluorescence changes in 2-aminopurine (2AP), a fluorescent isomer of A (Figure 6A), to measure pKa values in RNA and DNA oligonucleotides (Wilcox & Bevilacqua, 2013). Here we describe how changes in fluorescence of 2AP with pH can be used to determine pKa's in the secondary and tertiary structure of RNA and DNAs. The first step in using 2AP-detected pH titrations is to design a 2AP-containing RNA or DNA. It is well known that the fluorescence of 2AP decreases approximately 2-fold upon stacking (Jean & Hall, 2001). We thus design oligonucleotides wherein the 2AP is adjacent to a nucleobase that is likely to undergo a change in stacking upon ionization (Figure 6B). Care should be taken to ensure that the substitution of 2AP does not perturb the secondary or tertiary structure of the oligonucleotide. One way to accomplish this is by comparing the pKa measured by fluorescence to a pKa measured by another method such as NMR, while another is to conduct an activity assay on the fluorescent RNA or DNA such as binding or kinetics, if a functional assay is available.
Figure 6.
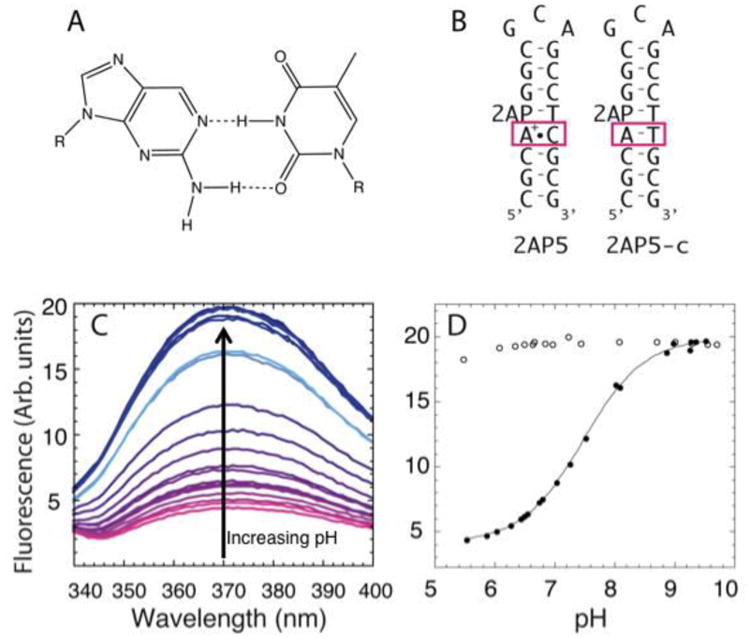
Fluorescence-based determination of pKa using 2AP-substituted oligonucleotides. A) 2AP is structurally similar to adenine and is able to form a two-hydrogen base pair with thymine. B) DNA constructs containing the A+•C wobble (2AP5) and the control construct containing an AT Watson-Crick (2AP-c) base pair. The signal change for the 2AP substitution was optimal when 2AP was positioned directly above the wobble base pair. C) Fluorescence spectra at different pH for 2AP5 construct, with pink corresponding to low pH and blue to high pH. D) Plot of observed fluorescence as a function of pH for 2AP5 (solid circles) and 2AP5-c (hollow circles). 2AP5-c shows no change in fluorescence with pH, whereas the 2AP5 shows a 4-fold change in fluorescence. Adapted with permission from Wilcox et al. 2013. Copyright (2013) American Chemical Society.
DNA and RNA oligonucleotides containing 2AP can be purchased commercially from IDT and Dharmacon, respectively. At the start of the experiment, the oligonucleotide is denatured at 90°C for 2 minutes and cooled at room temperature for 10 minutes. The pH of the oligonucleotide is brought to pH∼10 by the addition of small amount of KOH. As per Section 2.3, these experiments are done in the absence of any conventional buffer. Our lab uses a 1 cm pathlength quartz cuvette. Spectra are collected on Horiba Jobin Yvon Fluoromax-4 and analyzed using FluorEssence and KaleidaGraph software. The concentration of oligonucleotide used is ∼ 10 μM.iii For 2AP-substituted transcripts, the samples are excited at 304 nm and emission spectra are collected from 325 to 400 nm. Slit widths are adjusted according to the sample's fluorescence to ensure ample signal-to-noise ratio and should remain constant throughout the titration and between titrations on different constructs. The fluorescence data as a function of pH are fit to Eq. (4).
Fluorescence-detected determination of pKa values in DNA monitored secondary structure formation. In this assay, the pKa shifting in DNA hairpins was examined by placing a 2AP adjacent to an d(A+)•dC wobble (Figure 6B). At pH values below the pKa, the protonated base pair is formed, resulting in the quenching of the fluorescence from 2AP (Figure 6C, D closed symbols). At pH above the pKa, an increase in fluorescence is observed. Different positioning of the 2AP within the hairpin showed that 2AP adjacent to the wobble base pair and just downstream of the ionizing A gave optimal pH-titration curves (Figure 6B). A control in which the d(A+)•dC was changed to an AT base pair gave no change in fluorescence and thus helped assign the pKa (Figure 6B and 6D, open symbols). The pKa's obtained using this method have been corroborated with NMR experiments (Wilcox & Bevilacqua, 2013).
Fluorescence-detected determination of pKa values in RNA can also detect tertiary structure formation (Wilcox & Bevilacqua, 2013). The functional structure of beet western yellows virus (BWYV) RNA depends upon a formation of a pseudoknot that is formed as a result of protonation of C8 at neutral pH. Mutational studies have shown that a base quartet that C8 forms in conjunction with G12, A25, and C26 is essential for the RNA to perform its functional features. In an effort to measure the pKa of C8, 2AP was incorporated at position 9, which is in close stacking proximity to C8. Following the same trend as that described for 2AP-labeled DNA, an increase in pH resulted in an increase in fluorescence, in this case due to loss of stacking from breaking of tertiary interactions (Data not shown but similar to Figure 6C, D). The pH-titration curves were then used to determine the pKa and Hill coefficient of 8.15 and 0.94, respectively (Wilcox & Bevilacqua, 2013). The results agreed with a pKa extrapolated from a thermodynamic linkage study (Cornish & Giedroc, 2006). Control experiments on a double mutant oligonucleotide that forms a non-ionized quartet showed no change in fluorescence with pH, and gave the same fluorescence as the wild-type at low pH, which helped assign the pKa to C8.
Recently, Fedor and co-workers have applied 8-azaguanine and 8-azaadenine to measure pKa's in RNA. Briefly, they synthesized 8aza-modified purine mono and triphosphates through an enzymatic synthesis procedure (DaCosta et al., 2007). These bases were then installed into a large RNA through transcription, in some cases onto the 5′-end of a ribozyme through NMP-primed transcription. In general, after such a procedure the ribozyme (or RNA) can be constructed through T4 RNA ligation. Remarkably, the fluorescence of the modified RNA increased 10-100 fold upon deprotonation of the purine. The authors have used this method to conclude that the guanine positioned to be the general base in the hairpin and glmS ribozymes has an upward-perturbed pKa and thus seems to function in the neutral protonated form at biological pH (Liu et al., 2009; Viladoms et al., 2011). In contrast, the adenine positioned to be the general acid in the hairpin ribozyme has a pKa shifted towards neutrality (Cottrell et al., 2011). These authors made measurements in a SpectraMax plate reader using buffers at different pH and fit the data to an equation equivalent to Eq. (4). To conclude, insertion of a fluorescent base that is in proximity to a base pairing, stacking, or refolding event provides a way to monitor a pH-dependent event and determine a local pKa in any functional RNA of interest.
4.4 NMR-detected pH titrations
NMR has been extensively utilized to determine pKa's in DNA and RNA. The sensitivity of the chemical shift to local RNA structure makes NMR especially useful for pKa measurement. An NMR assay can be performed by indirect labeling or no labeling at all and so is unlikely to perturb the pKa. Depending upon the assay, the pKa's can be assigned to a nucleobase or to the 2'hydroxyl.
31P, 1H, and 13C are the most widely used NMR detections used for nucleic acids. 31P (100% of natural phosphorus) and 1H (99.98% of natural hydrogen) are abundant in nature, whereas 13C (∼1% of natural carbon) has low natural abundance. The hydrogen and carbon nuclei occur at various positions within an RNA molecule, in contrast to phosphorus, which is only found at the phosphate bonds. The high occurrence of hydrogen and carbon nuclei within an RNA molecule can be advantageous in terms of providing many possible positions for detection but can also lead to convolution of data and difficulty in interpretation of an NMR spectrum. The following sections describe each of these different NMR techniques in detail, and their application in pKa determination in nucleic acids.
Phosphorus (31P) NMR spectroscopy provides a potentially simple way to measure pKa shifting, as each residue has one phosphorus atom and phosphorus is a spin ½ nucleus, giving rise to one singlet in a proton-decoupled experiment. However, most phosphorus atoms resonate in a congested region of the spectrum, precluding monitoring of chemical shift with pH. Substitution of a specific phosphate with a phosphorothioate results in a large downfield shift of the sulfur-linked phosphorus resonance by ∼50 ppm in 31P NMR (Moody et al., 2004), providing an uncluttered spectrum (Figure 7A).
Figure 7.
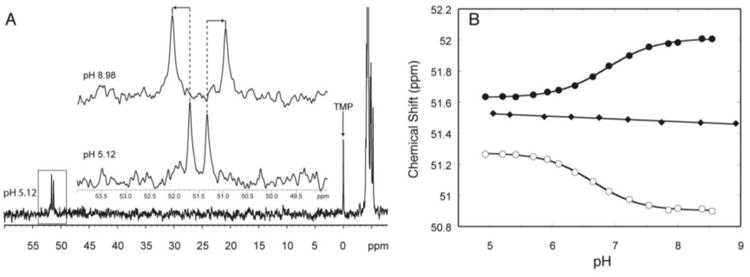
31P NMR-based determination of pKa. A) The downfield shift of the phosphorus peak with a phosphorothioate substitution. The inset is an expansion of the boxed region at the lowest (5.12) and highest (8.98) pH. B) Plot of chemical shift of the phosphorus peaks versus pH for oligonucleotides containing a protonated A+•C wobble pair (solid and hollow circles) and a control oligonucleotide where the A+ •C wobble pair is replaced with a Watson-Crick base pair. The pKa can be determined by fitting the plot to Eq. (4). Adapted with permission from Moody et al. 2004. Copyright (2004) American Chemical Society.
We have applied phosphorothioate-substituted oligonucleotide 31P NMR spectroscopy to pKa determination in both single-strand and double-strand DNA and RNA (Moody et al., 2004; Siegfried et al., 2010; Wilcox & Bevilacqua, 2013) in which the substituted phosphate is placed adjacent to an ionizing base pair. These phosphorus atoms have a pH-dependent change in chemical shift, caused by local structure changing upon base pair formation (Figure 7B). This substitution, which is available commercially in DNA and RNA, gives rise to two diastereomers (RP and SP). Although it is possible to separate the two diastereomers using HPLC, we typically use the mixture, which gives rise to two peaks in the proton-decoupled 31P NMR (Figure 7A). Often both peaks can be followed uniquely, thereby allowing the measurement of a pKa from two different substitutions in a single experiment (e.g. Figure 7B, circles). Typically a control oligonucleotide in which the ionizing base is mutated to form a Watson-Crick base pair with its pairing partner is studied to confirm the pKa assignment (Figure 7B, diamonds). The protonated and unprotonated states can be in a rapid exchange on the chemical shift timescale, corresponding to single Lorentzian peaks at low and high pH (Figure 3A). In such cases, the data can be fit to Eq. (4) (Figure 7B).
Similar to the fluorescence assays, the titration is conducted without a conventional buffer. Oligonucleotide concentrations vary from 0.5 to 5 mM and pH is varied through the addition of small amounts of HCl. Typically the experiments are carried out in the background of 100 mM KCl and 5-10% D2O as a deuterium lock to correct drift of the NMR magnetic field. An internal standard (1% trimethyl phosphate in 5% D2O in a coaxial tube) is used as a reference and set to 0 ppm. The oligonucleotide is renatured before the start of the experiment and the pH is determined before and after each measurement by inserting a microprobe into the NMR tube (See Section 2.2). Our lab has used Bruker AMX2-500 MHz (Moody et al., 2004), Bruker Advance III- 500 MHz (Siegfried et al., 2010), and Bruker AV-3-600 (Wilcox & Bevilacqua, 2013) spectrophotometers for obtaining 31P spectra.
Proton (1H) NMR spectroscopy provides the ability to measure pKa values in RNA, especially those values that are far removed from neutrality. For the purpose of determining the pKa of the 2′OH, Chattopadhyaya et al. utilized 1H NMR on ribonucleosides and derivatives (Velikyan et al., 2001). Samples were prepared in 100% D2O at ∼5 mM and contained 3-(Trimethylsilyl)-1-propane-sulfonic acid as an internal standard. For pDs (the equivalent of pH in a D2O solvent) between 7.0 to 13.0, buffers were used, while for pD between 13.0-14.0 NaOD was added to 0.158 to 1M. Experiments were performed at 25 °C on a 500 MHz spectrometer, and chemical shifts of non-exchanging protons (H1′, H2′ and H3′) near 2′OH were monitored as a function of pH, which acted as a proxy for the pKa of the exchangeable 2′OH. The pKaof the 2′OH was inferred using Eq. (4), and pKa values determined from monitoring each of the three non-exchanging protons agreed. The high pH baseline value (pD > 14.0) could not be determined well because of tuning issues at high salt and was instead extrapolated using Eq. (5). The pKa's for the ribonucleosides and their derivatives, which were corrected using the meter correction of pD = pH + 0.40, were found to be between 12.2 to 13.6 (Velikyan et al., 2001).
Recent studies from our lab extended this method to assess pKa shifting in the 2′OH resulting from mono and divalent metal ions (Ganguly et al., 2014). We studied 3'AMP as a model compound and prepared 1-2 mM solutions in 10% D2O and 90% H2O. We used mostly water because D2O shifts pKa values of N-linked protons higher by ∼0.4 to 0.6 units, even after the meter correction (Nakano et al., 2000; Schowen & Schowen, 1982). Water suppression was thus necessary in our studies and was accomplished through presaturation using the general noesygppr1d pulse sequence. The solution contained 4,4-dimethyl-4-silapentance-1-sulfonic acid (DSS) as an internal standard in a 4 mm tube with 250 uL of sample. Each data point was prepared independently in a total volume of 500 μL. The desired pH was obtained by addition of NaOH or Ca(OH)2, while ionic strength was maintained through addition of NaCl or CaCl2. After the spectrum was collected, the 250 μL was added back to the centrifuge tube, the sample was mixed well, and the pH was checked again.
The highest attainable pH with NaOH is 13.7 (=0.5 M NaOH) due to tuning issues with the instruments, while the highest pH obtained with Ca(OH)2 was 12.2 due to precipitation at higher pH (see Section 3.2 for handling in argon). Data were collected on a Bruker AV 3-600 MHz spectrophotometer at 25 °C. The chemical shift of H1′ peak was monitored as a function of pH because this peak is isolated from the water peak, still present despite suppression. Determination of the pKa and Hill coefficient were the same as described above for Velikyan et al (Velikyan et al., 2001).
A third good method for pKa determination is 13C NMR spectroscopy. Legault and Pardi monitored the aromatic C2-H2 cross peaks of all seven adenines in the lead-dependent ribozyme using HMQC spectra (Legault & Pardi, 1994, 1997). Good spectral dispersion was found and it was possible to determine the pKa of each residue. One adenine in particular, A25, gave a pKa of 6.5, which was associated with formation of a protonated A+•C wobble. The authors also provide tables of which carbon atoms have chemical shifts that are most sensitive to pH in all four nucleobases. In sum, NMR is exceptionally powerful for pKa determination, and a variety of RNA nucleic (31P, 1H, 13C) have been monitored in pKa studies. Labeling of the RNA is typically necessary for 13C, but not 31P or 1H, which are naturally high abundance. The method of pKa determination by NMR spectroscopy is applicable to nucleotides, oligonucleotides and full length functional RNAs.
4.5 Raman crystallography pH titrations
Raman spectroscopy can be conducted on crystals of proteins and RNA. It has been used to probe mechanisms of protein enzymes, in which reactions are carried out in the crystals (Carey & Dong, 2004), and to examine the fold of functional RNAs including tRNAs (Chen, Giegé, Lord, & Rich, 1975). We applied Raman crystallography to crystals of the pre-cleaved HDV ribozyme because previous attempts at using 13C NMR to obtain pKa values on the pre-cleaved enzyme had been met with experimental difficulties of line shifting, broadening, and splitting (Lupták, Ferré-D'Amaré, Zhou, Zilm, & Doudna, 2001). It turned out that specific Raman spectral features could be assigned to protonated cytosines and that these could be further linked to specific cytosines through mutagenesis (Gong et al., 2007).
Here we provide a brief summary of the Raman crystallography pKa method developed by the Carey, Golden, and Bevilacqua labs. We have provided a full methods paper on pKa determination of RNAs by Raman earlier and refer the interested reader to this (Gong et al., 2009). Crystals of the pre-cleaved ribozyme were grown in the presence of a modification of the nucleophilic 2′OH to methoxy, deoxy, or fluoro to prevent ribozyme reactivity in the crystal. Additionally, crystals of a control ribozyme in which the putative ionizing base is mutated, here C75U, were grown and also crystallized to assign the pKa. Raman spectra were obtained via a HoloLab Series 5000 Raman microscope at ambient temperature in which the crystals were in the hanging drop. The crystals were soaked for 15-20 min in a stabilization buffer containing 50% 2-methyl-2,4-pentanediol (MPD) and acetate or cacodylate buffers (50 mM) differing by 0.2 pH units. Data were fit to an equation equivalent to Eq. (4). In this approach we were able to measure a pKa for C75 that couples anticooperatively with Mg2+, with pKa values of 6.15 and 6.40 in 20 and 2 mM Mg2+, respectively (Gong et al., 2007). These pKa values agree quite well with those determined by kinetics measurements (Nakano et al., 2000).
It is worth noting that the Raman crystallographic method has since proven valuable for pKa determination in several other functional RNAs including the hairpin (Guo et al., 2009) and glmS (Gong et al., 2011) ribozymes, where pKa values of 5.46 for A38 (6.26 for a pre-transition state analogue) (Liberman et al., 2012) and 7.26 for the glcN6P cofactor were measured, respectively. One reason that Raman crystallography may be generally useful for pKa determination in large RNA is that multiple diverse folds of the RNA in the starting state are discouraged by the crystal lattice, while local structural accommodations necessary for ionization are allowed, as the experiments are at ambient temperature. It is important to note that most RNA crystals are ∼70% solvent, making the experimental conditions somewhat analogous to the inside of the cell (Minton, 2001). The method of Raman crystallography for pKa determination is relatively new but has potential to be applicable to any functional RNA or DNA. Moreover, diffraction quality crystals are not needed; we have obtained quality Raman spectra from crystals that diffract to only 5 Å (Gong et al., 2009).
5. Perspective
In this article we provided five experimental methods for determining pKa's in RNA. These include reaction cleavage kinetics and spectroscopic-detected pH titrations of UV, fluorescence, NMR, and Raman crystallography. We showed that while it is possible to obtain ideal two-state behavior when pKa's are at neutrality, more often additional complexities are found in the data such as pH-induced RNA unfolding, poor upper baselines, kinetic pKa's, and RNA degradation, which have to be identified and dealt with. Assigning an observed pKa to a particular residue often requires controls in which the ionizing base is mutated to create a base pair, which should eliminate the signal change, or is mutated to another ionizing base, which should shift the pKa by a known amount. In addition, testing the ability of different equations to fit the data can help spot apparent pKa's, either due to a change in rate-limiting step or to multiple independent ionizations, which are not assignable to a single ionization event. Ultimately, measuring the pKa by more than one technique can give greater confidence in the result. This is illustrated in the case of C75 in the HDV ribozyme whereby convergent results were obtained from cleavage kinetics and spectroscopic signal changes.
Moving forward it will be important to develop methods to test pKa values of all atoms in an RNA at one time, and to do so in a genome-wide fashion. Strobel and co-workers have applied pH-dependent DMS mapping to the ribosome and identified a pH-dependent conformational change (Muth, Chen, Kosek, & Strobel, 2001; Muth, Ortoleva-Donnelly, & Strobel, 2000), as well as NAIM to entire ribozymes (Jones & Strobel, 2003; Oyelere & Strobel, 2000; Suydam & Strobel, 2008), which are important efforts in this direction. Applying such broadly informing techniques will yield a better sense of the prevalence and importance of pKa shifting in RNA biology. Identification and measurement of such pKa values should also prove valuable as benchmarks to theorists as they seek to identify shifted pKa's in RNAs and understand molecular driving forces for shifting.
Acknowledgments
We thank Jamie Bingaman, Donald Burke, and Joe Wedekind for providing insightful comments on the manuscript. Support was provided by NIH Grant R01GM095923 and NSF Grant CHE-1213667.
Footnotes
Hydrogen bonding that leads to such pKa shifting can be canonical base pairing of the Watson-Crick face or it can be non-canonical base pairing of the Watson-Crick face, which often occurs in complex RNAs.
‘One channel’ refers to only one of the two species, protonated or deprotonated, contributing to the mechanism. If both species contribute, then more complex data are obtained with an apparent pKa as described below and in Figure 4D.
A lower concentration might be possible, but this one gives excellent signal-to-noise and is high enough to buffer itself throughout the titration.
References
- Bevilacqua PC. Proton transfer in ribozyme catalysis. In: Lilley DMJ, Eckstein F, editors. Ribozymes and RNA catalysis. Royal Society of Chemistry; Cambridge: 2008. pp. 11–36. [Google Scholar]
- Bevilacqua PC, Brown TS, Chadalavada DM, Parente AD. Kinetic Analysis of Ribozyme Cleavage. In: Johnson K, editor. Kinetic Analysis of Macromolecules. Oxford University Press; Oxford; 2003. pp. 49–74. [Google Scholar]
- Bevilacqua PC, Brown TS, Nakano S, Yajima R. Catalytic roles for proton transfer and protonation in ribozymes. Biopolymers. 2004;73(1):90–109. doi: 10.1002/bip.10519. [DOI] [PubMed] [Google Scholar]
- Biondi E, Poudyal RR, Forgy JC, Sawyer AW, Maxwell AWR, Burke DH. Lewis acid catalysis of phosphoryl transfer from a copper(II)-NTP complex in a kinase ribozyme. Nucl Acids Res. 2013;41:3327–3338. doi: 10.1093/nar/gkt039. [DOI] [PMC free article] [PubMed] [Google Scholar]
- Bock RM, Ling NS, Morell SA, Lipton SH. Ultraviolet absorption spectra of adenosine-5′-triphosphate and related 5′-ribonucleotides. Arch Biochem Biophys. 1956;62:253–264. doi: 10.1016/0003-9861(56)90123-0. [DOI] [PubMed] [Google Scholar]
- Carey PR, Dong J. Following ligand binding and ligand reactions in proteins via Raman crystallography. Biochemistry. 2004;43:8885–8893. doi: 10.1021/bi049138a. [DOI] [PubMed] [Google Scholar]
- Cerrone-Szakal AL, Siegfried NA, Bevilacqua PC. Mechanistic characterization of the HDV genomic ribozyme: solvent isotope effects and proton inventories in the absence of divalent metal ions support C75 as the general acid. J Amer Chem Soc. 2008;130(44):14504–14520. doi: 10.1021/ja801816k. [DOI] [PubMed] [Google Scholar]
- Chadalavada DM, Cerrone-Szakal AL, Wilcox JL, Siegfried NA, Bevilacqua PC. Ribozymes. 2012;848(1):21–40. doi: 10.1007/978-1-61779-545-9_3. [DOI] [PubMed] [Google Scholar]
- Chen MC, Giegé R, Lord RC, Rich A. Raman spectra and structure of yeast phenylalanine transfer RNA in the crystalline state and in solution. Biochemistry. 1975;14:4385–4391. doi: 10.1021/bi00691a007. [DOI] [PubMed] [Google Scholar]
- Cornish PV, Giedroc DP. Pairwise coupling analysis of helical junction hydrogen bonding interactions in luteoviral RNA pseudoknots. Biochemistry. 2006;45:11162–11171. doi: 10.1021/bi060430n. [DOI] [PMC free article] [PubMed] [Google Scholar]
- Cottrell JW, Scott LG, Fedor MJ. The pH dependence of hairpin ribozyme catalysis reflects ionization of an active site adenine. J Biol Chem. 2011;286:17658–17664. doi: 10.1074/jbc.M111.234906. [DOI] [PMC free article] [PubMed] [Google Scholar]
- DaCosta CP, Fedor MJ, Scott LG. 8-Azaguanine reporter of purine ionization state in structured RNA. J Amer Chem Soc. 2007;129:3426–3432. doi: 10.1021/ja067699e. [DOI] [PubMed] [Google Scholar]
- Dahm SC, Uhlenbeck OC. Role of divalent metal ions in the hammerhead RNA cleavage reaction. Biochemistry. 1991;30(39):9464–9469. doi: 10.1021/bi00103a011. [DOI] [PubMed] [Google Scholar]
- DeRose VJ. Metal ion binding to catalytic RNA molecules. Curr Opin Struc Biol. 2003;13(3):317–324. doi: 10.1016/s0959-440x(03)00077-0. [DOI] [PubMed] [Google Scholar]
- Fersht A. Enzyme structure and mechanism. Second. Freeman; New York: 1985. [Google Scholar]
- Frederiksen JK, Piccirilli JA. Identification of catalytic metal ion ligands in ribozymes. Methods. 2009;49(2):148–166. doi: 10.1016/j.ymeth.2009.07.005. [DOI] [PMC free article] [PubMed] [Google Scholar]
- Ganguly A, Thaplyal P, Rosta E, Bevilacqua PC, Hammes-Schiffer S. Quantum mechanical/molecular mechanical free energy simulations of the self-cleavage reaction in the hepatitis delta virus ribozyme. J Amer Chem Soc. 2014;136(4):1483–1496. doi: 10.1021/ja4104217. [DOI] [PMC free article] [PubMed] [Google Scholar]
- Gerweck LE, Seetharaman K. Cellular pH gradient in tumor versus normal tissue: potential exploitation for the treatment of cancer. Cancer Research. 1996;56:1194–1198. [PubMed] [Google Scholar]
- Gilbert SD, Reyes FE, Edwards AL, Batey RT. Adaptive ligand binding by the purine riboswitch in the recognition of guanine and adenine analogs. Structure. 2009;17(6):857–868. doi: 10.1016/j.str.2009.04.009. [DOI] [PMC free article] [PubMed] [Google Scholar]
- Gong B, Chen JH, Chase E, Chadalavada DM, Yajima R, Golden BL, Bevilacqua PC, Carey PR. Direct measurement of a pK(a) near neutrality for the catalytic cytosine in the genomic HDV ribozyme using Raman crystallography. J Amer Chem Soc. 2007;129(43):13335–13342. doi: 10.1021/ja0743893. [DOI] [PubMed] [Google Scholar]
- Gong B, Chen JH, Yajima R, Chen Y, Chase E, Chadalavada DM, et al. Bevilacqua PC. Raman crystallography of RNA. Methods. 2009;49(2):101–111. doi: 10.1016/j.ymeth.2009.04.016. [DOI] [PMC free article] [PubMed] [Google Scholar]
- Gong B, Klein DJ, Ferré-D'Amaré AR, Carey PR. The glmS ribozyme tunes the catalytically critical pK(a) of its coenzyme glucosamine-6-phosphate. J Amer Chem Soc. 2011;133:14188–14191. doi: 10.1021/ja205185g. [DOI] [PMC free article] [PubMed] [Google Scholar]
- Good NE, Winget GD, Winter W, Connolly TN, Izawa S, Sing RMM. Hydrogen ion buffers for bifological Research. Biochemistry. 1966;5:467–477. doi: 10.1021/bi00866a011. [DOI] [PubMed] [Google Scholar]
- Griffiths JR. Are cancer cells acidic? Br J Cancer. 1991;64:425–427. doi: 10.1038/bjc.1991.326. [DOI] [PMC free article] [PubMed] [Google Scholar]
- Guo M, Spitale RC, Volpini R, Krucinska J, Cristalli G, Carey PR, Wedekind JE. Direct Raman measurement of an elevated base pKa in the active site of a small ribozyme in a precatalytic conformation. J Amer Chem Soc. 2009;131:12908–12909. doi: 10.1021/ja9060883. [DOI] [PMC free article] [PubMed] [Google Scholar]
- Izatt RM, Christensen JJ, Rytting JH. Sites and thermodynamic quantitities associated with proton and metal ion interaction with ribonucleic acid, deoxyribonucleic acid, and their constituent bases, nucleosides, and nucleotides. Chem Rev. 1971;71:439–481. doi: 10.1021/cr60273a002. [DOI] [PubMed] [Google Scholar]
- Jean JM, Hall KB. 2-Aminopurine fluorescence quenching and lifetimes: Role of base stacking. Proc Natl Acad Sci. 2001;1998:37–41. doi: 10.1073/pnas.011442198. [DOI] [PMC free article] [PubMed] [Google Scholar]
- Jones FD, Strobel SA. Ionization of a critical adenosine residue in the neurospora Varkud Satellite ribozyme active site. Biochemistry. 2003;42:4265–4276. doi: 10.1021/bi020707t. [DOI] [PubMed] [Google Scholar]
- Kierzek R. Hydrolysis of oligoribonucleotides: influence of sequence and length. Nucl Acids Res. 1992a;20:5073–5077. doi: 10.1093/nar/20.19.5073. [DOI] [PMC free article] [PubMed] [Google Scholar]
- Kierzek R. Nonenzymatic hydrolysis of oligoribonucleotides. Nucl Acids Res. 1992b;20:5079–5084. doi: 10.1093/nar/20.19.5079. [DOI] [PMC free article] [PubMed] [Google Scholar]
- Knitt DS, Herschlag D. pH dependencies of the Tetrahymena ribozyme reveal an unconventional origin of an apparent pKa. Biochemistry. 1996;35:1560–1570. doi: 10.1021/bi9521147. [DOI] [PubMed] [Google Scholar]
- Kraut DA, Carroll KS, Herschlag D. Challenges in enzyme mechanism and energetics. Annu Rev Biochem. 2003;72:517–571. doi: 10.1146/annurev.biochem.72.121801.161617. [DOI] [PubMed] [Google Scholar]
- Lee MS, Salsbury FR, Brooks CL. Constant-pH molecular dynamics using continuous titration coordinates. Proteins. 2004;56:738–752. doi: 10.1002/prot.20128. [DOI] [PubMed] [Google Scholar]
- Legault P, Pardi A. In Situ Probing of Adenine Protonation in RNA by 13C NMR. J Amer Chem Soc. 1994;116:8390–8391. [Google Scholar]
- Legault P, Pardi A. Unusual dynamics and pKa shift at the active site of a lead-dependent ribozyme. J Amer Chem Soc. 1997;119:6621–6628. [Google Scholar]
- Li Y, Breaker RR. Kinetics of RNA degradation by specific base catalysis of transesterification involving the 2′ -hydroxyl group. J Amer Chem Soc. 1999;121(4):5364–5372. [Google Scholar]
- Liberman JA, Guo M, Jenkins JL, Krucinska J, Chen Y, Carey PR, Wedekind JE. A transition-state interaction shifts nucleobase ionization toward neutrality to facilitate small ribozyme catalysis. J Am Chem Soc. 2012;134(41):16933–16936. doi: 10.1021/ja3070528. [DOI] [PMC free article] [PubMed] [Google Scholar]
- Liu L, Cottrell JW, Scott LG, Fedor MJ. Direct measurement of the ionization state of an essential guanine in the hairpin ribozyme. Nat Chem Biol. 2009;5:351–357. doi: 10.1038/nchembio.156. [DOI] [PMC free article] [PubMed] [Google Scholar]
- Lupták A, Ferré-D’Amaré AR, Zhou K, Zilm KW, Doudna JA. Direct pKa measurement of the active-site cytosine in a genomic hepatitis delta virus ribozyme. J Amer Chem Soc. 2001;123:8447–8452. doi: 10.1021/ja016091x. [DOI] [PubMed] [Google Scholar]
- Minton AP. The influence of macromolecular crowding and macromolecular confinement on biochemical reactions in physiological media. J Biol Chem. 2001;276:10577–10580. doi: 10.1074/jbc.R100005200. [DOI] [PubMed] [Google Scholar]
- Moody EM, Brown TS, Bevilacqua PC. Simple method for determining nucleobase pKa values by indirect labeling and demonstration of a pKa of neutrality in dsDNA. J Amer Chem Soc. 2004;126(33):10200–10201. doi: 10.1021/ja047362h. [DOI] [PubMed] [Google Scholar]
- Moody EM, Lecomte JTJ, Bevilacqua PC. Linkage between proton binding and folding in RNA : A thermodynamic framework and its experimental application for investigating pKa shifting. RNA. 2005;11:157–172. doi: 10.1261/rna.7177505. [DOI] [PMC free article] [PubMed] [Google Scholar]
- Moser A, Range K, York DM. Accurate proton affinity and gas-phase basicity values for molecules important in biocatalysis. J Phys Chem B. 2010;114(43):13911–13921. doi: 10.1021/jp107450n. [DOI] [PMC free article] [PubMed] [Google Scholar]
- Muth GW, Chen L, Kosek AB, Strobel SA. pH-dependent conformational flexibility within the ribosomal peptidyl transferase center. RNA. 2001;7:1403–1415. [PMC free article] [PubMed] [Google Scholar]
- Muth GW, Ortoleva-Donnelly L, Strobel SA. A single adenosine with a neutral pKa in the ribosomal peptidyl transferase center. Science. 2000;289:947–950. doi: 10.1126/science.289.5481.947. [DOI] [PubMed] [Google Scholar]
- Nakano S, Bevilacqua PC. Mechanistic characterization of the HDV genomic ribozyme: a mutant of the C41 motif provides insight into the positioning and thermodynamic linkage of metal ions and protons. Biochemistry. 2007;46(11):3001–3012. doi: 10.1021/bi061732s. [DOI] [PubMed] [Google Scholar]
- Nakano S, Cerrone AL, Bevilacqua PC. Mechanistic characterization of the HDV genomic ribozyme: classifying the catalytic and structural metal ion sites within a multichannel reaction mechanism. Biochemistry. 2003;42(10):2982–2994. doi: 10.1021/bi026815x. [DOI] [PubMed] [Google Scholar]
- Nakano S, Chadalavada DM, Bevilacqua PC. General acid-base catalysis in the mechanism of a hepatitis delta virus ribozyme. Science. 2000;287(5457):1493–1497. doi: 10.1126/science.287.5457.1493. [DOI] [PubMed] [Google Scholar]
- Oyelere AK, Strobel SA. Biochemical detection of cytidine protonation within RNA. J Amer Chem Soc. 2000;122:10259–10267. [Google Scholar]
- Qin PZ, Pyle AM. Site-SpeciÞc labeling of RNA with fluorophores and other structural probes. Methods. 1999;18:60–70. doi: 10.1006/meth.1999.0757. [DOI] [PubMed] [Google Scholar]
- Schowen BK, Schowen RL. Methods Enzymol. 1982;87:551–606. [PubMed] [Google Scholar]
- Siegfried NA, O'Hare B, Bevilacqua PC. Driving forces for nucleic acid pKa shifting in an A(+).C wobble: effects of helix position, temperature, and ionic strength. Biochemistry. 2010;49(15):3225–3236. doi: 10.1021/bi901920g. [DOI] [PubMed] [Google Scholar]
- Soukup GA, Breaker RR. Relationship between internucleotide linkage geometry and the stability of RNA. RNA. 1999;5(10):1308–1325. doi: 10.1017/s1355838299990891. [DOI] [PMC free article] [PubMed] [Google Scholar]
- Suydam IT, Strobel SA. Fluorine substituted adenosines as probes of nucleobase protonation in functional RNAs. J Amer Chem Soc. 2008;130:13639–13648. doi: 10.1021/ja803336y. [DOI] [PMC free article] [PubMed] [Google Scholar]
- Tang CL, Alexov E, Pyle AM, Honig B. Calculation of pKas in RNA: on the structural origins and functional roles of protonated nucleotides. J Mol Biol. 2007;366(5):1475–1496. doi: 10.1016/j.jmb.2006.12.001. [DOI] [PubMed] [Google Scholar]
- Velikyan I, Acharya S, Trifonova A, Földesi A, Chattopadhyaya J. The pKa's of 2′-hydroxyl group in nucleosides and nucleotides. J Amer Chem Soc. 2001;123(12):2893–2894. doi: 10.1021/ja0036312. [DOI] [PubMed] [Google Scholar]
- Viladoms J, Scott LG, Fedor MJ. An active-site guanine participates in glmS ribozyme catalysis in its protonated state. J Amer Chem Soc. 2011;133:18388–18396. doi: 10.1021/ja207426j. [DOI] [PMC free article] [PubMed] [Google Scholar]
- Wilcox JL, Ahluwalia AK, Bevilacqua PC. Charged nucleobases and their potential for RNA catalysis. Acc Chem Res. 2011;44(12):1270–1279. doi: 10.1021/ar2000452. [DOI] [PMC free article] [PubMed] [Google Scholar]
- Wilcox JL, Bevilacqua PC. A simple fluorescence method for pKa determination in RNA. J Amer Chem Soc. 2013;135:7390–7393. doi: 10.1021/ja3125299. [DOI] [PubMed] [Google Scholar]