Abstract
Chemical exchange saturation transfer (CEST) imaging of amine protons exchanging at intermediate rates and whose chemical shift is around 2 ppm may provide a means of mapping creatine. However, quantification of this effect may be compromised by the influence of overlapping CEST signals from fast exchanging amines and hydroxyls. We aimed to investigate the exchange rate filtering effect of a variation of CEST, named chemical exchange rotation transfer (CERT), as a means of isolating creatine contributions at around 2 ppm from other overlapping signals. Simulations were performed to study the filtering effects of CERT for selecting transfer effects from protons of specific exchange rates. Control samples containing the main metabolites in brain, bovine serum albumin (BSA), and egg white albumen (EWA) at their physiological concentrations and pH were used to study the ability of CERT to isolate molecules with amines at 2 ppm that exchange at intermediate rates, and corresponding methods were used for in vivo rat brain imaging. Simulations showed that exchange rate filtering can be combined with conventional filtering based on chemical shift. Studies on samples showed that signal contributions from creatine can be separated from those of other metabolites by using this combined filter, but contributions from protein amines may still be significant. This exchange filtering can also be used for in vivo imaging. CERT provides more specific quantification of amines at 2 ppm that exchange at intermediate rates compared to conventional CEST imaging.
Keywords: Chemical exchange saturation transfer (CEST), Chemical exchange rotation transfer (CERT), creatine
Graphical abstract
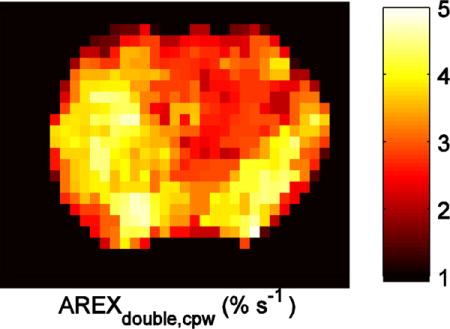
Chemical exchange saturation transfer (CEST) imaging of intermediate exchanging amine at 2 ppm may provide a means of mapping creatine. However, quantification of this effect may be compromised by the influence of overlapping CEST signals from fast exchanging amines and hydroxyls. We developed an exchange filter effect, named AREXdouble, cpw, to isolate creatine contributions at 2 ppm from other overlapping signals.
INTRODUCTION
Chemical exchange saturation transfer (CEST) applies long, frequency selective RF pulses to saturate protons in exchanging pools and detect subsequent changes in water signals. Due to the accumulated effects of the exchange, CEST provides an indirect measurement of solutes with significantly enhanced sensitivity compared to direct detection via conventional magnetic resonance spectroscopy (MRS).
Amine protons at 2 ppm from water that exchange at intermediate rates (between slowly exchanging amides (1) and rapidly exchanging amines and hydroxyls, such as in glutamate (2) and glucose (3)) are found in important molecules such as creatine and proteins, and detection of these exchanging pools has potential practical applications, motivating the development of appropriate CEST methods. In previously developed approaches, CEST signals at 2 ppm have typically been assumed to represent creatine-weighted saturation transfer and have been applied to imaging of brain, muscle, and heart (4–7). However, distinct from the narrow and specific peaks prevalent in MRS, CEST peaks, especially those from fast exchanging pools (e.g. glutamate at 3 ppm (2)), are broad and often overlap (8,9). Therefore, the CEST signal at 2 ppm may have contributions from both intermediate exchanging amines at 2 ppm and other fast nearby exchanging pools.
Previously, a magnetization transfer ratio with asymmetric analysis (MTRasym) has been applied to quantify CEST signals at 2 ppm. Ideally, this method requires only two sampling points and thus is very convenient. However, the results of such an approach potentially are compromised by the influence of B0 errors, semi-solid magnetization transfer (MT) asymmetry effects (10), and relayed nuclear overhauser enhancement (rNOE) effects originating from the other side of the water peak (11–16). More recently, a multiple pool Lorentzian fitting method was used to quantify the CEST signal at 2 ppm without using upfield reference signals (6). However, this fitting method requires acquisition of the entire Z-spectrum and thus is comparatively slow. In addition, as discussed above, these two methods cannot isolate the intermediate exchanging amines at 2 ppm from other overlapping fast exchanging pools. Moreover, these approaches, with direct subtraction of label and reference signals, cannot fully remove the effects of direct water saturation (DS), semi-solid MT, and T1w effects, which contribute to the signal non-linearly (17). Thus their quantitative results may provide misleading information in pathologies in which these tissue parameters also change.
Here, we describe a novel approach to quantifying the CEST signal at 2 ppm which suffers less from these limitations. Conventional CEST acquisitions separate metabolites primarily based on their different NMR chemical shifts, which cover only a narrow range. However, in addition to NMR chemical shifts, metabolites may have exchangeable protons with a broad range of exchange rates. While conventional CEST signals depend on the exchange rate, we have developed a variation of CEST, named chemical exchange rotation transfer (CERT) (18), which has a stronger dependence on exchange rate, thereby allowing more specific exchange-rate filtering of the signal in addition to filtering based on chemical shift alone. Previously, we introduced a metric (MTRdouble) based on the CERT approach with a duty cycle (dc) of 50% and demonstrated its ability to filter slowly exchanging protons. We applied this method to isolate slowly exchanging amides from nearby intermediate and fast exchanging amines (18). In this work, we designed a CERT method to select intermediate-exchanging protons by varying the dc while keeping constant pulse widths (pw) in the sequence. We apply this new metric (MTRdouble, cpw) to isolate amines exchanging at intermediate rates at 2 ppm from other overlapping fast exchanging pools. In addition, we incorporate an inverse analysis method based on the previously published apparent exchange-dependent relaxation (AREX) approach (17), and label the combined metric AREXdouble, cpw. This metric is designed to remove the DS, semi-solid MT, and T1w effects, in addition to the previously mentioned exchange-rate filter effects. Overall, the new CERT filter provides a more specific quantification of intermediate exchanging amines at 2 ppm and should in particular increase the specificity of creatine imaging.
MATERIALS AND METHODS
CEST and CERT quantification metrics
In conventional CEST imaging, an off-resonance RF irradiation (continuous-wave (CW) or a series of shaped pulses) is applied at the solute resonance frequency and on the opposite side of water before data acquisitions. The subtraction of the signals at these two frequency offsets has been used to quantify the CEST effect, putatively removing DS and semi-solid MT effects. The CEST metric MTRasym is defined by Eq. (1),
| (1) |
where S+ is the reference scan signal and S- is the label scan signal. However, MTRasym has been shown to be influenced by rNOE saturation transfer and asymmetric MT effects (12,18).
To solve this problem, a multiple pool Lorentzian fit, MTRfit, was proposed. The Z-spectra were fit to the sum of several Lorentzian peaks using the following equation (19):
| (2) |
where the Z-spectrum is a function of RF offset (Δ), peak full width at half maximum (W) and peak amplitude (A). Δ0i is the resonance frequency offset of a solute pool. N is the number of coupled pools. Note that such fittings require acquisition at a large number of frequency offsets.
We have previously proposed a new acquisition and analysis approach, named CERT with a metric defined in Eq. (3) by subtraction of pulsed-CEST signals at irradiation flip angles (θ) of π and 2π, while keeping RF frequency offset, average irradiation power (Bavg power), and dc constant.
| (3) |
where (−) represents that the signal is acquired on the resonance frequency offset of the exchanging species. (π) and (2π) are the nutation angles of the individual pulses making up a long irradiation pulse train. S0 is the signal acquired in the non-irradiated control case. Bavg power is the average irradiation power and is defined to be the square root of the average of the square of the amplitude over a pulse repetition period. MTRdouble can quantify the CEST effect by removing DS and semi-solid MT effects and, by using the same frequency offset for both the label and reference scans, avoids the signal contributions from rNOE saturation transfer and asymmetric MT that affect conventional MTRasym.
We here use a variant of MTRdouble, called MTRdouble,cpw. Instead of maintaining a constant dc as θ is varied, we maintain a constant pulse width (pw).
| (4) |
The dc is varied to maintain constant pw. This change increases the exchange sensitivity and maintains similar bandwidths for the two pulse trains, a relevant issue when addressing DS effects close to the water line.
We also make an additional change to the analysis, in light of a recent study that shows that CEST, DS, and semi-solid MT effects do not add linearly (17). Thus conventional CEST metrics, which linearly subtract the label and reference signals, cannot remove DS and semi-solid MT effects. In addition, CEST effects scale with T1w (17,20). The AREX approach addresses these issues by inversely subtracting the label and reference signals and normalizing with the apparent water longitudinal relaxation time (T1obs) (17,21,22). Here, we combined the CERT and AREX approaches to define a new metric:
| (5) |
where R1obs= 1/T1obs.
Design of an intermediate exchanging pass filter for creatine imaging
Our goal is to be maximally sensitive and specific to exchange effects from amines in creatine. Table 1 lists the NMR chemical shifts and exchange rates (ksw) of some of the metabolites present in the brain. The values of ksw have a broader range than the NMR chemical shifts, which is the conventional parameter used in CEST for separating overlapping metabolites.
Table 1.
List of solute resonance frequency offsets (Δ0), exchange rates (ksw), and concentration (fs) of some molecules in brain.
For our purposes, the major brain metabolites can be separated into three categories based on their exchange rates with water: slow exchange regime (ksw < 100 s−1), intermediate exchange regime (100 < ksw < 1000 s-−1), and fast exchange regime (ksw > 1000 s−1). From our literature survey (1,2,23,24), creatine has an exchange rate of around 500 – 950 s−1 under physiological conditions, which is in the intermediate exchange regime; most neurotransmitters in brain are in the fast exchange regime; amides on proteins and peptides are in the slow exchange regime. Although some other metabolites are also in the intermediate exchange regime, their exchange rates are still widely separated from creatine. For example, the exchange rates of phosphocreatine (PCr) (140, 120 s−1) (23) and adenosine-5-triphosphate (ATP) (120 s−1) (23) are around one-fifth that of creatine. Myo-inositol (MI), by contrast has an exchange rate of ~600 s−1, which is close to that of creatine, but MI is centered at around 0.6 ppm (25). Therefore, only creatine and MI are close within the intermediate exchange range. We reasoned that by considering the physiological concentrations of all metabolites as well as pH in brain, and by tuning the pass band of the exchange-rate filter to select creatine, a novel method that is relatively more specific for creatine imaging would be possible using CERT.
Numerical Simulation
To study exchange rate filter effects, MTRasym, MTRdouble, MTRdouble,cpw, and AREXdouble,cpw were calculated as a function of the exchange rate (ksw) by simulating a two-pool model (solute and water pool) with a solute offset of around 2 ppm (to match creatine) at 9.4 T. Simulation parameters included: T1s = 1.5 s, T2s = 15 ms, T1w = 1.5 s, and T2w = 60 ms, where the “s” and “w” subscripts correspond to solute and water, respectively; solute concentration (relative to water) was set to 0.001. These simulation parameters were chosen from a literature survey (8,26).
The simulation contains six coupled Bloch equations which can be written as , where A is a 6 × 6 matrix (27). The water pool and solute pool each have three coupled equations representing the x, y, and z components of their magnetizations. Numerical estimates of the pulsed-CEST signals were obtained by integrating the differential equations through the pulse sequences (with sequence parameters matching the experimental work below) using the ordinary differential equation (ODE) solver in MATLAB (Mathworks, Natick, MA, USA).
Sample preparations
To test the relative sensitivities and specificities of different exchange metrics, we prepared samples containing a selection of brain metabolites and proteins. The major metabolites in the brain that can be detected by 1H MRS at physiological concentrations are adenosine triphosphate (ATP), adenosine-5-diphosphate (ADP), aspartate (Asp), choline (Cho), creatine (Cre), gamma-aminobutyric acid (GABA), glutamine (Gln), glutamate (Glu), glucose (Glc), myo-inositol (MI), N-acetyl aspartate (NAA), phosphocreatine (PCr), and taurine (Tau) (2). These metabolites were included in our study, with the exceptions of Cho, which does not have any amine exchangeable protons, and ADP, which is at very low concentration in the brain. We also included two types of proteins, bovine serum albumin (BSA) and egg white albumen (EWA). In total, 13 solutions were prepared in 1 × phosphate buffered saline (PBS) titrated to pH 7.0 and containing brain metabolites or proteins at their physiological concentrations, specifically 3 mM ATP, 2mM Asp, 6 mM Cre, 2 mM GABA, 2mM Gln, 10 mM Glu, 3 mM Glc, 10 mM MI, 10 mM NAA, 5 mM PCr, 2mM Tau, 10% (w/w) BSA, and 10% (w/w) EWA.
In order to test the creatine specificity of MTRdouble,cpw, and AREXdouble,cpw under varying T1w and semi-solid MT conditions, solutions containing 20 mM creatine in PBS were prepared with 0.05 mM or 0.1 mM MnCl2, and 1% or 2% agarose. The pH of MnCl2 solutions was titrated to 7.0 at room temperature. The agarose solutions were heated by microwave and immersed in a water bath at 45 °C. Creatine was then added to the agarose solutions and pH was titrated to 7.0 at 45 °C. In order to test the creatine sensitivity of AREXdouble,cpw, solutions containing 5 mM, 10 mM, and 15 mM creatine were prepared in PBS and pH was titrated to 7.0 at room temperature.
Animal preparations
Three rats bearing 9L tumors were studied. To induce brain tumors, each rat was injected with 1 × 10⁵ 9L glioblastoma cells in the right hemisphere, and was then imaged after 2 to 3 weeks. All rats were immobilized and anesthetized with a 2%/98% isoflurane/oxygen mixture during data acquisition. Respiration was monitored to be stable, and a constant rectal temperature of 37°C was maintained throughout the experiments using a warm-air feedback system (SA Instruments, Stony Brook, NY, USA). All animal experiments were approved by the Animal Care and Usage Committee of Vanderbilt University.
MRI and data analysis
All measurements on samples and animals were performed on a Varian DirectDrive™ horizontal 9.4T magnet with a 38-mm Litz RF coil (Doty Scientific Inc. Columbia, SC) at 37°C. CW-CEST Z-spectra with irradiation power (B1) of 1 μT were acquired with RF offsets from −4000 Hz to −2500 Hz with a step size of 500 Hz (−10 ppm to −6.25 ppm with a step size of 1.25 ppm at 9.4 T), −2000 Hz to 2000 Hz with a step size of 50 Hz (−5 ppm to 5 ppm with a step size of 0.125 ppm at 9.4 T), and 2500 Hz to 4000 Hz with a step size of 500 Hz (6.25 ppm to 10 ppm with a step size of 1.25 ppm at 9.4 T). Pulsed-CEST Z-spectra with average irradiation power (Bavg, power) of 1 μT were acquired with RF offsets from −2000 Hz to 2000 Hz (−5 ppm to 5 ppm at 9.4 T) with an interval of 50 Hz (0.125 ppm at 9.4 T). A control scan was performed to measure S0 by setting the RF offset to 100 kHz. For Z-spectra studies on solutions, the first points of the free induction decay (FID) were used for data analyses. For Z-spectra from rats in vivo and control samples, a single-shot SE-EPI imaging sequence was employed using a FOV of 30 × 30 mm2, a slice thickness of 2 mm, a matrix of 64 × 64, and a receiver bandwidth of 250 kHz.
For CERT MTRdouble, dc was 50 %, pulse duration and pulse repetition time were 10.8 ms and 21.6 ms for π pulses, and 21.6 ms and 43.2 ms for 2π pulses, respectively. For CERT MTRdouble, cpw and AREXdouble, cpw, dc, pulse duration, and pulse repetition time were 72%, 13 ms, and 18.1 ms for π pulses, and 18%, 13 ms and 72.2 ms for 2π pulses, respectively. The total irradiation duration was 5 s for animals and 8 s for samples, performed before acquisitions, with a 2s delay time before the next experiments. R1obs for animal experiments was obtained using selective inversion recovery (SIR) (28). R1obs for samples was obtained using an inversion recovery fast spin-echo (FSE) sequence.
MTRasym was calculated using π irradiation Z-spectra with dc of 72%. MTRfit was calculated by fitting the CW-CEST Z-spectra. In the present work, we used a five-pool (amide at 3.5 ppm, amine at 2 ppm, water, rNOE saturation transfer at −3.5 ppm, and semi-solid MT) Lorentzian fitting to process the CW Z-spectra. The fitting was performed voxel by voxel with a non-linear optimization algorithm to achieve the lowest root mean square of residuals (RMSR) between the data and model. All images were smoothed by a 3 × 3 median filter before fitting. Table 2 lists the starting points and boundaries of the fit.
Table 2.
Starting points and boundaries of the amplitude, width, and offset of the five-pool Lorentzian fit. The unit of peak width and offset is ppm.
| Start | Lower | Upper | |
|---|---|---|---|
| Awater | 0.9 | 0.02 | 1 |
| Wwater | 1.4 | 0.3 | 10 |
| Δwater | 0 | −1 | 1 |
| Aamide | 0.025 | 0 | 0.2 |
| Wamide | 0.5 | 0.4 | 3 |
| Δamide | 3.5 | 3 | 4 |
| Aamine | 0.01 | 0 | 0.2 |
| Wamine | 1.5 | 0.5 | 5 |
| Δamine | 2 | 1.75 | 2.25 |
| ANOE(−3.5) | 0.02 | 0 | 1 |
| WNOE(−3.5) | 3 | 1 | 5 |
| ΔNOE(−3.5) | −3.5 | −4.5 | 2 |
| AMT | 0.1 | 0 | 1 |
| WMT | 25 | 10 | 100 |
| ΔMT | 0 | −4 | 4 |
The vendor (Varian) provided PRESS sequence with VAPOR water suppression was used to acquire high resolution 1H spectra with the following parameters: spectral width = 2.5 kHz, number of points = 4096, TE1 = 8 ms, TE2 = 7 ms, TR = 3 s for samples and 2 s for animals, and number of acquisitions = 8 for phantoms and 200 for animals. To determine the relative creatine sensitivity of CERT AREXdouble,cpw and 1H MRS, CERT irradiations were followed by a PRESS acquisition using the same sequence parameters as in the MRS experiments, but without water suppression and with only 1 acquisition (making the total acquisition time 30 s in both cases).
RESULTS
Exchange filter effect of CEST and CERT metrics
Figure 1 shows that the shape of the AREXdouble, cpw vs. ksw curve obtained from simulations roughly matches that of MTRdouble, cpw, which is not surprising given that they are functions of the same signal measurements, S-(π, dc1) and S-(2π, dc2). Figure 1 also shows there is a trade-off between sensitivity and exchange rate selectivity: the signal size and W decrease in parallel, going from MTRasym (W ≈ 1350 s−1) to MTRdouble, cpw (W ≈ 540 s−1) to MTRdouble (W ≈ 260 s−1). W for these curves is defined as the difference between two points with values half of the maximum value. MTRdouble, cpw (and AREXdouble, cpw) provide a good compromise of sensitivity to creatine (ksw ≈ 500 – 950 s−1) and filtering of fast exchanging metabolites (ksw ≈ 2000 s−1). The ratios between CEST effects with ksw of 2000 s−1 and those with 700 s−1 are 49%, 26%, 19%, and 18% for MTRasym, MTRdouble, MTRdouble,cpw, and AREXdouble,cpw metrics, respectively. The current CERT approach can not filter out slow exchanging pools. However, in biological tissues, only amide protons at 3.5 ppm and rNOE effects at negative offsets are in the slow exchanging regime (1,14,29), both of which are far from the intermediate exchanging amines at 2 ppm. Furthermore, slow exchanging pools have corresponding small exchange-rate broadening of their peaks (27). Thus CEST effects from slow exchanging pools do not influence the quantification of intermediate exchanging amines at 2 ppm. In addition, rNOE at −3.5 ppm is likely further damped by its shorter transverse relaxation rate.
Fig. 1.
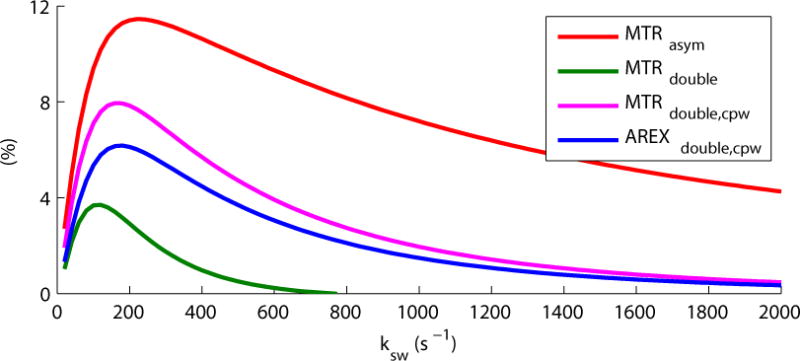
Simulated MTRasym, MTRdouble, MTRdouble,cpw, and AREXdouble,cpw at around 2 ppm vs. ksw. Simulations were performed with a 2-pool model (solute and water pool) and Bavg power = 1 μT. AREXdouble,cpw has different unit than the other metrics, and has been arbitrarily scaled in this figure to allow for easy comparison to MTRdouble,cpw.
Isolating creatine using the CERT intermediate exchange filter effect
Figures 2a – 2d show MTRasym, MTRdouble, MTRdouble,cpw, and AREXdouble,cpw spectra from samples consisting of different metabolite solutions at physiological conditions (pH 7 and 37°C). Figure 2a shows that although creatine is the largest MTRasym contribution at around 2 ppm, glutamate still contributes roughly 40% of creatine’s signal. Figure 2b shows that the creatine signal is removed in the CERT MTRdouble spectra. The isolation of the PCr peak at around 2.5 ppm is noteworthy and will be the subject of a separate investigation. Figure 2c shows that glutamate contributes roughly 20% of creatine’s MTRdouble,cpw signal at around 2 ppm, indicating that the exchange filter effect of CERT MTRdouble,cpw can reduce the influence of glutamate. Myo-inositol has a similar exchange rate as creatine and therefore might be expected to contribute equally to the signal. However, its chemical shift at around 0.6 ppm is far from creatine and does not contribute much at around 2 ppm. Also note that PCr has relatively weak contribution at around 2 ppm (around 30% of signal from Cr using the MTRdouble,cpw metric). This diminished PCr contribution indicates a greater specificity for creatine compared to MRS, which measures total creatine = creatine + PCr. Figure 2d shows the CERT AREXdouble,cpw spectra. Note that apart from a scaling factor, the AREXdouble,cpw spectra matches those of MTRdouble,cpw. This scaling factor can increase the specificity for creatine when there are relaxation rate changes, as measured in the next section.
FIG. 2.
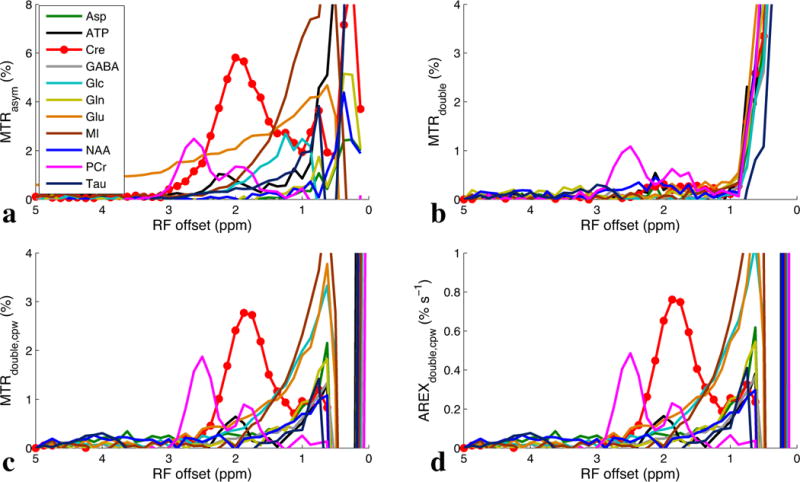
Experimental MTRasym (a), MTRdouble (b), MTRdouble,cpw (c), and AREXdouble,cpw (d) spectra from solutions containing the main metabolites in brain, irradiated with Bavg power = 1 μT at 9.4 T. T1obs were measured to be roughly 4 s for these samples.
Figures 3a – 3d show MTRasym, MTRdouble, MTRdouble,cpw, and AREXdouble,cpw spectra from protein samples at physiological conditions (pH 7 and 37°C). There are four relevant sources of signal in Figure 3: slow-exchanging amides at ~3.5 ppm, intermediate-exchanging amines at ~2 ppm, a fast-exchanging site (which may be from fast exchanging protein lysine amine protons (30,31)) that causes very broad contributions between ~0.5 and 5 ppm, and possibly hydroxyls at ~1 ppm. This last peak will be ignored in our analysis, since (due to the known rotation artifacts (18,32) that dominate the CEST metrics in Figures 3b, c, and d at low offsets) the possible hydroxyl peak can only be discerned in figure 3a. From figure 1, we expect the absolute magnitude of the broad fast-exchanging component to decrease as we go from MTRasym, to MTRdouble,cpw to MTRdouble, which appears to be the case in Figure 3, especially for EWA. Likewise, from Figure 1, we expect the ratio of the peak heights from intermediate-exchanging amines (at ~2 ppm) to those from slow-exchanging amides (at ~3.5 ppm) to also decrease as we go from MTRasym, to MTRdouble,cpw to MTRdouble, which again appears to be the case in Figure 3. In total, Figure 3 shows two key points: 1) that the measured results in proteins are consistent with the simulations in Figure 1, hence supporting the overall filtering approach underlying the proposed metric AREXdouble,cpw, and 2) that proteins (in addition to creatine) may contribute to the measured signal near 2 ppm.
FIG. 3.
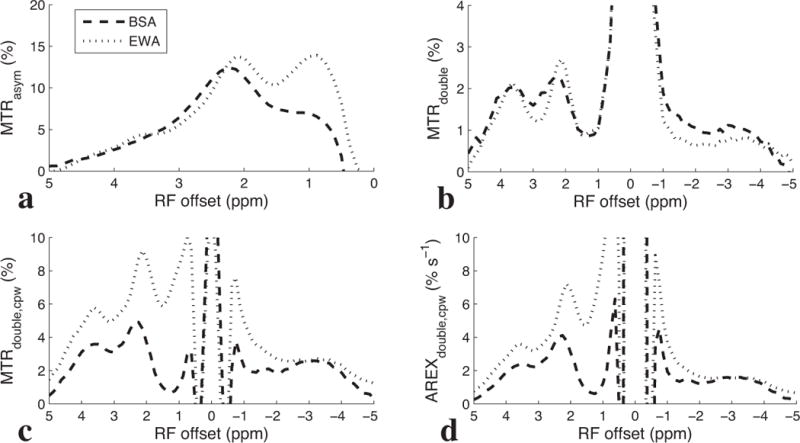
Experimental MTRasym (a), MTRdouble (b), MTRdouble,cpw (c), and AREXdouble,cpw (d) spectra from solutions containing BSA and EWA, irradiated with Bavg power = 1 μT at 9.4 T. T1obs was measured to be roughly 2.2 s for these samples.
Specificity and sensitivity of CERT creatine imaging
Figure 4 shows the results of measurements on samples with different T1obs and semi-solid concentrations to evaluate the specificity of MTRdouble,cpw and AREXdouble,cpw when evaluating the peak near 2 ppm. When T1obs changes from 1.3 s to 2 s (Figure 4a), the MTRdouble,cpw metric changes by 33% (0.027 to 0.036) and the AREXdouble,cpw metric changes by −9% (0.023 to 0.021). When agar concentration changes from 1% to 2% (Figure 4b), the MTRdouble,cpw metric changes by −13% (0.078 to 0.068) and the AREXdouble,cpw metric changes by 3% (0.032 to 0.033). Thus, AREXdouble,cpw at around 2 ppm has a decreased dependence on both T1obs and the semi-solid concentration compared to MTRdouble,cpw, indicating a greater specificity to changes in creatine content and exchange rate.
FIG. 4.

MTRdouble,cpw and AREXdouble,cpw at around 2 ppm on samples with different T1obs (a) and agar concentration (b). T1obs was measured to be roughly 4 s for the agar samples.
Figure 5a shows that AREXdouble,cpw at around 2 ppm is roughly proportional to the creatine concentration, with a small offset. To compare the creatine sensitivity of AREXdouble,cpw and conventional 1H MRS, we acquired 1H resonance spectra using a PRESS readout after saturating at around 2 ppm with irradiation flip angles of π and 2π (Figure 5b), as well as a conventional 1H MRS PRESS water suppressed spectrum (Figure 5c) on a 15 mM creatine sample. Measurements of the signal-to-noise ratios (SNR) show that AREXdouble,cpw has a ~52-fold sensitivity advantage over conventional 1H MRS at physiological concentrations and temperature. (The SNR was calculated with signal obtained from the maximum value of the peak and the noise from the standard deviation of a part of spectrum where there are no peaks.)
FIG. 5.
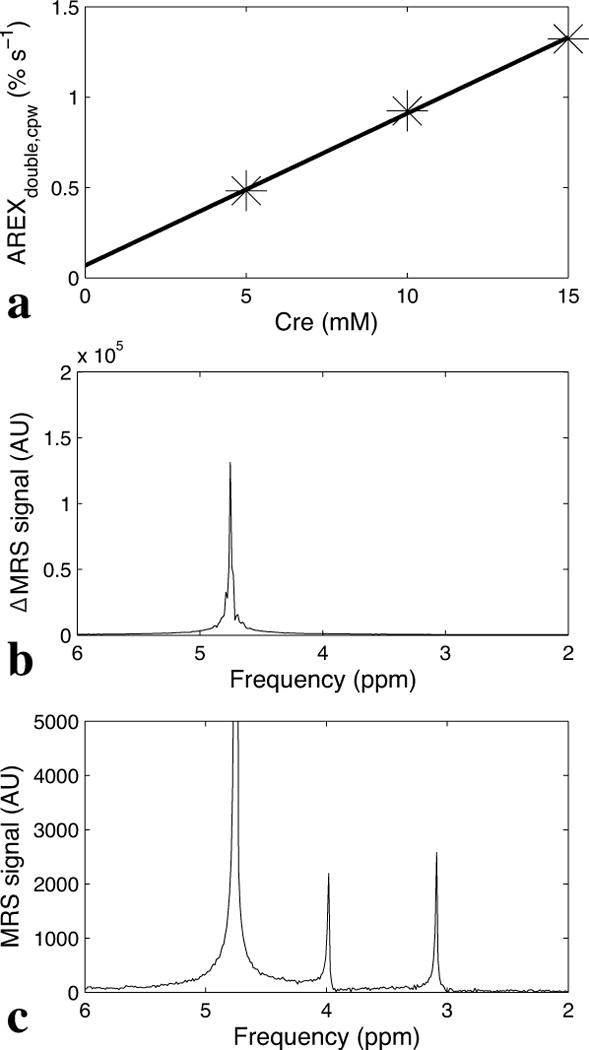
a) Linear dependence of AREXdouble,cpw on creatine concentration (5 mM, 10 mM, and 15 mM). b) The AREXdouble,cpw creatine signal at around 2 ppm (the difference of MRS spectra acquired after irradiation with 2π and π pulse trains (ΔMRS)). Note that the peak is from water at 4.7 ppm, but gives creatine information via exchange. c) 1H MRS point-resolved spectroscopy (PRESS) water-suppressed spectrum, isolating direct measurement of the creatine signal along with a residual water signal at 4.7 ppm. Both AREXdouble,cpw and 1H MRS experiments were performed on the same creatine sample (with concentration of 15 mM) and have roughly the same scan time of 30 s and receiver gain of 2 dB. The SNR of the AREXdouble,cpw creatine signal at 4.7 ppm in (b) is roughly 52 times that of the 1H MRS signal at 3.2 ppm in (c). AU, arbitrary unit.
CEST and CERT imaging in tumors
Figure 6 shows the CEST and CERT spectra of rat brains bearing tumors. Note that MTRasym at 2 ppm from contralateral normal tissue in Figure 6c is negative because of the rNOE saturation transfer effect on the opposite side of the water peak. Both MTRasym at 2 ppm in Figure 6c and MTRfit (from the five pool Lorentzian fit) at 2 ppm in Figure 6d have higher values in tumors than in the contralateral normal tissue. Figure 6e shows that the contrast for MTRdouble, cpw at 2 ppm between tumor and normal tissues is diminished, while Figure 6f shows that for AREXdouble, cpw it is reversed. This indication by AREXdouble, cpw of lower creatine content in tumors is consistent with previous 1H MRS measurements in animal tumor models (33), and confirmed by MRS in this study (Figure 7). (In addition to the peak at 2 ppm discussed above, Figures 6e and 6f show a peak at 3.5 ppm, due to APT effects, and a peak between 0 and 1 ppm, due to an artifact from water rotation effects (18,32)). These peaks likely do not affect the quantification of the peak at 2 ppm, as discussed above. Likewise, the rNOE peak at −3.5 ppm (not shown) is too far removed from 2 ppm and too slowly exchanging to contribute to the 2 ppm peak. Figure 8 shows an example image of AREXdouble, cpw at 2 ppm in which tumor is hypointense.
FIG. 6.
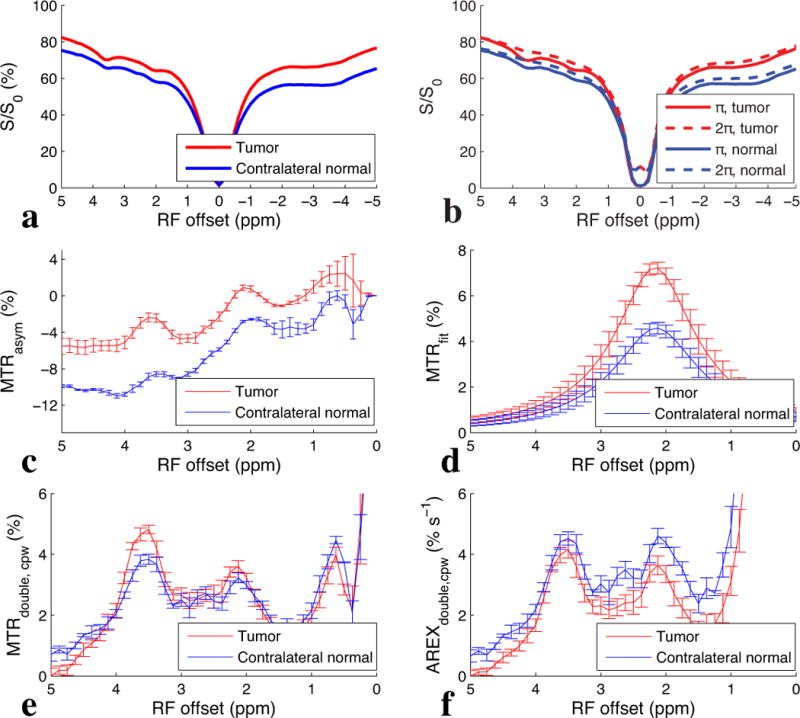
Experimental CW-CEST (a), pulsed-CEST (b), MTRasym (c), MTRfit (d), MTRdouble,cpw (e), and AREXdouble,cpw (f) spectra from tumors and contralateral normal tissues in rat brains. Error bars are standard errors of the mean.
FIG. 7.
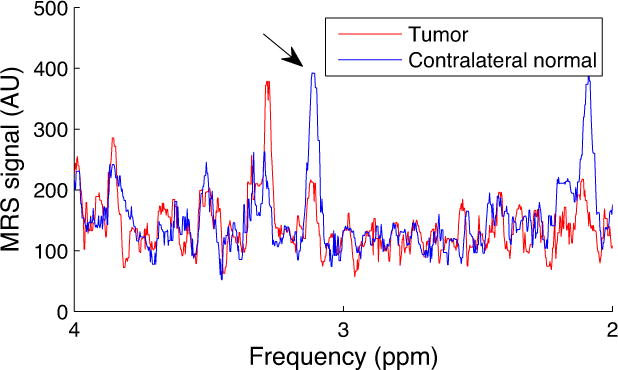
MRS spectra from tumor and contralateral normal tissue in one rat brain.
FIG. 8.
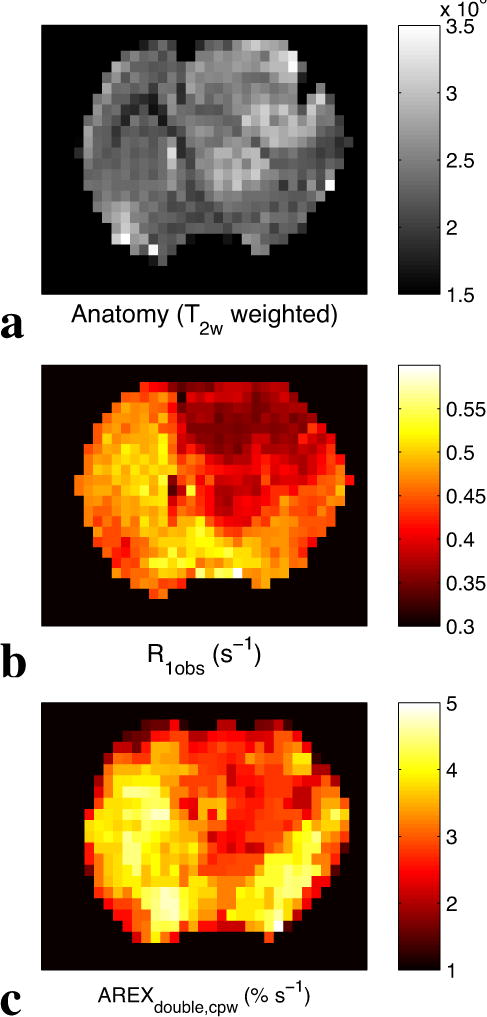
Anatomy (T2w weighted) (a), R1obs (b), and AREXdouble,cpw at 2 ppm (c) images from a representative rat brain bearing tumor.
DISCUSSION
Separating intermediate exchanging amines from neighboring fast exchanging pools can increase the specificity of CEST imaging. However, fast exchanging pools have broad peaks when using conventional CEST acquisitions, and hence can not be well isolated by their resonance frequencies. In this work, we did not address the specific methods used previously to image creatine, as they vary significantly, e.g. references 1 to 4 use saturation pulses with durations between 250 ms and 3 s and powers between 1.2 μT and 3.6 μT, and use both MTRasym and Lorentzian line fitting metrics. We instead have compared the underlying exchange rate selectivity of CEST and CERT approaches. Furthermore, we developed a filter to select solutes with intermediate exchange rates using our previously described CERT approach. Measurements show that this technique can isolate creatine from other brain metabolites and thereby increase the specificity of CEST creatine imaging.
In our previous CERT works (18,32), we varied the pulse angle while maintaining constant integrated power and dc (at 50%). Here, we maintained constant integrated power and pw. The two primary benefits are a rough doubling of peak signal (as seen in the peak heights in Figure 1) and a simplification of pulse bandwidth issues (since all pulses have roughly the same bandwidth when pw is constant), which becomes increasingly important near the water resonance. In this work, our goal has been to selectively measure solutes near 2 ppm at intermediate exchange rates, and hence increase specificity for creatine. The choice of constant pw is reasonable in light of this goal, as is the choice of Bavg power = 1uT, but a full optimization would require consideration of how Bavg power, dc, and pw affect sensitivity, specificity, and the generation of direct water rotation artifacts using a multi-pool tissue model, and is beyond the scope of the current work. Likewise, the creatine exchange rate has a strong dependence on temperature and pH (34), and hence variations in these biophysical parameters may significantly affect the exchange rate filtering, and hence the results, of all of the methods studied in this paper.
Previous MRS measurements have shown that the concentration of creatine usually decreases in tumors. The quantity AREXdouble, cpw at 2 ppm also has a lower value in tumor. In contrast, MTRasym, MTRfit, and MTRdouble, cpw do not have decreased values in tumor, but these quantities may be influenced by other effects such as semi-solid MT and T1w. Note that our MTRfit result in tumors differs from a previous multiple-pool fit of CEST signals at 2 ppm (6), which may be due to the different experimental parameters and different non-specific contributions.
Some other molecules, e.g. protein arginine side chains, also have intermediate exchanging amines at 2 ppm, which may contaminate CEST creatine imaging (30,31). Our method does not remove contributions from such proteins. Experiments on samples in Figure 2 and 3 indicate that contributions to intermediate exchanging amine signals at 2 ppm from proteins (AREXdouble, cpw at 2 ppm are around 3.9 % s−1 for BSA and 7.2 % s−1 for EWA) are significantly higher than that from creatine (AREXdouble, cpw at around 2 ppm is around 0.7 % s−1). However, since our chosen proteins are two specific types that may contain high proportion of arginine side chains, the relative contribution from proteins and creatine in vivo may be significantly different from our sample studies. In any case, compared with several previous ways of quantifying CEST, our method significantly increases the specificity of CEST creatine imaging by removing contributions from neighboring fast exchanging sites. At the least, our method can be used to assess situations where no significant change in the protein concentration is expected.
In contrast with 1H MRS, which measures total creatine (creatine plus phosphocreatine), the proposed CERT method is weighted towareds creatine, which may provide a way to study the creatine kinase (CK) reaction. Our studies of samples also show that the proposed CERT metric has a much larger SNR compared to 1H MRS.
Acknowledgments
R21 EB17873, R01 EB017767, R01 CA109106, and R01 CA184693
Abbreviations
- CEST
chemical exchange saturation transfer
- CERT
chemical exchange rotation transfer
- MT
magnetization transfer
- MTR
magnetization transfer ratio
- AREX
apparent exchange-dependent relaxation
- CW
continuous wave
- rNOE
relayed nuclear overhauser enhancement
- DS
direct water saturation
- dc
duty cycle
- pw
pulse width
- W
peak full width at half maximum
References
- 1.Zhou JY, Payen JF, Wilson DA, Traystman RJ, van Zijl PCM. Using the amide proton signals of intracellular proteins and peptides to detect pH effects in MRI. Nat Med. 2003;9(8):1085–1090. doi: 10.1038/nm907. [DOI] [PubMed] [Google Scholar]
- 2.Cai KJ, Haris M, Singh A, et al. Magnetic resonance imaging of glutamate. Nat Med. 2012;18(2):302–306. doi: 10.1038/nm.2615. [DOI] [PMC free article] [PubMed] [Google Scholar]
- 3.Chan KWY, McMahon MT, Kato Y, et al. Natural D-glucose as a biodegradable MRI contrast agent for detecting cancer. Magn Reson Med. 2012;68(6):1764–1773. doi: 10.1002/mrm.24520. [DOI] [PMC free article] [PubMed] [Google Scholar]
- 4.Haris M, Singh A, Cai KJ, et al. A technique for in vivo mapping of myocardial creatine kinase metabolism. Nat Med. 2014;20(2):209–214. doi: 10.1038/nm.3436. [DOI] [PMC free article] [PubMed] [Google Scholar]
- 5.Haris M, Nanga RPR, Singh A, et al. Exchange rates of creatine kinase metabolites: feasibility of imaging creatine by chemical exchange saturation transfer MRI. NMR Biomed. 2012;25(11):1305–1309. doi: 10.1002/nbm.2792. [DOI] [PMC free article] [PubMed] [Google Scholar]
- 6.Cai KJ, Singh A, Poptani H, et al. CEST signal at 2ppm (CEST@2ppm) from Z-spectral fitting correlates with creatine distribution in brain tumor. NMR Biomed. 2015;28(1):1–8. doi: 10.1002/nbm.3216. [DOI] [PMC free article] [PubMed] [Google Scholar]
- 7.Cai KJ, Tain RW, Zhou XJ, et al. Creatine CEST MRI for Differentiating Gliomas with Different Degrees of Aggressiveness. Mol Imaging Biol. 2016;19(2):225–232. doi: 10.1007/s11307-016-0995-0. [DOI] [PMC free article] [PubMed] [Google Scholar]
- 8.Zhang XY, Wang F, Li H, et al. Accuracy in the quantification of chemical exchange saturation transfer (CEST) and relayed nuclear Overhauser enhancement (rNOE) saturation transfer effects. NMR Biomed. 2017 doi: 10.1002/nbm.3716. [DOI] [PMC free article] [PubMed] [Google Scholar]
- 9.Zhang XY, Wang F, Li H, et al. CEST imaging of fast exchanging amine pools with corrections for competing effects at 9.4 T. NMR Biomed. 2017 doi: 10.1002/nbm.3715. [DOI] [PMC free article] [PubMed] [Google Scholar]
- 10.Hua J, Jones CK, Blakeley J, et al. Quantitative description of the asymmetry in magnetization transfer effects around the water resonance in the human brain. Magn Reson Med. 2007;58(4):786–793. doi: 10.1002/mrm.21387. [DOI] [PMC free article] [PubMed] [Google Scholar]
- 11.Jones CK, Huang A, Xu JD, et al. Nuclear Overhauser enhancement (NOE) imaging in the human brain at 7 T. Neuroimage. 2013;77:114–124. doi: 10.1016/j.neuroimage.2013.03.047. [DOI] [PMC free article] [PubMed] [Google Scholar]
- 12.Jin T, Wang P, Zong XP, Kim SG. MR imaging of the amide-proton transfer effect and the pH-insensitive nuclear overhauser effect at 9.4 T. Magn Reson Med. 2013;69(3):760–770. doi: 10.1002/mrm.24315. [DOI] [PMC free article] [PubMed] [Google Scholar]
- 13.Zaiss M, Kunz P, Goerke S, Radbruch A, Bachert P. MR imaging of protein folding in vitro employing Nuclear-Overhauser-mediated saturation transfer. NMR Biomed. 2013;26(12):1815–1822. doi: 10.1002/nbm.3021. [DOI] [PubMed] [Google Scholar]
- 14.Zaiss M, Windschuh J, Goerke S, et al. Downfield-NOE-suppressed amide-CEST-MRI at 7 Tesla provides a unique contrast in human glioblastoma. Magn Reson Med. 2017;77(1):196–208. doi: 10.1002/mrm.26100. [DOI] [PubMed] [Google Scholar]
- 15.Zhang XY, Wang F, Afzal A, et al. A new NOE-mediated MT signal at around-1.6 ppm for detecting ischemic stroke in rat brain. Magn Reson Imaging. 2016;34(8):1100–1106. doi: 10.1016/j.mri.2016.05.002. [DOI] [PMC free article] [PubMed] [Google Scholar]
- 16.Zhang XY, Wang FJT, Xu JZ, et al. MR imaging of a novel NOE-mediated magnetization transfer with water in rat brain at 9.4 T. Magn Reson Med. 2016 doi: 10.1002/mrm.26396. [DOI] [PMC free article] [PubMed] [Google Scholar]
- 17.Zaiss M, Bachert P. Exchange-dependent relaxation in the rotating frame for slow and intermediate exchange - modeling off-resonant spin-lock and chemical exchange saturation transfer. NMR Biomed. 2013;26(5):507–518. doi: 10.1002/nbm.2887. [DOI] [PubMed] [Google Scholar]
- 18.Zu ZL, Janve VA, Xu JZ, et al. A new method for detecting exchanging amide protons using chemical exchange rotation transfer. Magn Reson Med. 2013;69(3):637–647. doi: 10.1002/mrm.24284. [DOI] [PMC free article] [PubMed] [Google Scholar]
- 19.Desmond KL, Moosvi F, Stanisz GJ. Mapping of Amide, Amine, and Aliphatic Peaks in the CEST Spectra of Murine Xenografts at 7 T. Magn Reson Med. 2014;71(5):1841–1853. doi: 10.1002/mrm.24822. [DOI] [PubMed] [Google Scholar]
- 20.Li H, Li K, Zhang XY, et al. R-1 correction in amide proton transfer imaging: indication of the influence of transcytolemmal water exchange on CEST measurements. NMR Biomed. 2015;28(12):1655–1662. doi: 10.1002/nbm.3428. [DOI] [PMC free article] [PubMed] [Google Scholar]
- 21.Zaiss M, Zu ZL, Xu JZ, et al. A combined analytical solution for chemical exchange saturation transfer and semi-solid magnetization transfer. NMR Biomed. 2015;28(2):217–230. doi: 10.1002/nbm.3237. [DOI] [PMC free article] [PubMed] [Google Scholar]
- 22.Zaiss M, Xu JZ, Goerke S, et al. Inverse Z-spectrum analysis for spillover-, MT-, and T-1-corrected steady-state pulsed CEST-MRI - application to pH-weighted MRI of acute stroke. NMR Biomed. 2014;27(3):240–252. doi: 10.1002/nbm.3054. [DOI] [PMC free article] [PubMed] [Google Scholar]
- 23.Haris M, Nanga RP, Singh A, et al. Exchange rates of creatine kinase metabolites: feasibility of imaging creatine by chemical exchange saturation transfer MRI. NMR Biomed. 2012;25(11):1305–1309. doi: 10.1002/nbm.2792. [DOI] [PMC free article] [PubMed] [Google Scholar]
- 24.Goerke S, Zaiss M, Bachert P. Characterization of creatine guanidinium proton exchange by water- exchange (WEX) spectroscopy for absolute- pH CEST imaging in vitro. NMR Biomed. 2014;27(5):507–518. doi: 10.1002/nbm.3086. [DOI] [PubMed] [Google Scholar]
- 25.Haris M, Cai KJ, Singh A, Hariharan H, Reddy R. In vivo mapping of brain myo-inositol. Neuroimage. 2011;54(3):2079–2085. doi: 10.1016/j.neuroimage.2010.10.017. [DOI] [PMC free article] [PubMed] [Google Scholar]
- 26.Zu ZL, Janve VA, Li K, et al. Multi-angle ratiometric approach to measure chemical exchange in amide proton transfer imaging. Magn Reson Med. 2012;68(3):711–719. doi: 10.1002/mrm.23276. [DOI] [PMC free article] [PubMed] [Google Scholar]
- 27.Zaiss M, Bachert P. Chemical exchange saturation transfer (CEST) and MR Z-spectroscopy in vivo: a review of theoretical approaches and methods. Phys Med Biol. 2013;58(22):R221–R269. doi: 10.1088/0031-9155/58/22/R221. [DOI] [PubMed] [Google Scholar]
- 28.Gochberg DF, Gore JC. Quantitative magnetization transfer imaging via selective inversion recovery with short repetition times. Magn Reson Med. 2007;57(2):437–441. doi: 10.1002/mrm.21143. [DOI] [PMC free article] [PubMed] [Google Scholar]
- 29.Xu JD, Yadav NN, Bar-Shir A, et al. Variable Delay Multi-Pulse Train for Fast Chemical Exchange Saturation Transfer and Relayed-Nuclear Overhauser Enhancement MRI. Magn Reson Med. 2014;71(5):1798–1812. doi: 10.1002/mrm.24850. [DOI] [PMC free article] [PubMed] [Google Scholar]
- 30.Zong XP, Wang P, Kim SG, Jin T. Sensitivity and Source of Amine-Proton Exchange and Amide-Proton Transfer Magnetic Resonance Imaging in Cerebral Ischemia. Magn Reson Med. 2014;71(1):118–132. doi: 10.1002/mrm.24639. [DOI] [PMC free article] [PubMed] [Google Scholar]
- 31.Jin T, Kim SG. High field MR imaging of proteins and peptides based on the amine-water proton exchange effect. ISMRM. 2012;2339 [Google Scholar]
- 32.Zu ZL, Xu JZ, Li H, et al. Imaging Amide Proton Transfer and Nuclear Overhauser Enhancement Using Chemical Exchange Rotation Transfer (CERT) Magn Reson Med. 2014;72(2):471–476. doi: 10.1002/mrm.24953. [DOI] [PMC free article] [PubMed] [Google Scholar]
- 33.Doblas S, He T, Saunders D, et al. In vivo characterization of several rodent glioma models by 1H MRS. NMR Biomed. 2012;25(4):685–694. doi: 10.1002/nbm.1785. [DOI] [PMC free article] [PubMed] [Google Scholar]
- 34.Zhou JY, van Zijl PCM. Chemical exchange saturation transfer imaging and spectroscopy. Prog Nucl Magn Reson Spectrosc. 2006;48(2–3):109–136. [Google Scholar]
- 35.van Zijl PCM, Yadav NN. Chemical Exchange Saturation Transfer (CEST): What is in a Name and What Isn’t? Magn Reson Med. 2011;65(4):927–948. doi: 10.1002/mrm.22761. [DOI] [PMC free article] [PubMed] [Google Scholar]


