Abstract
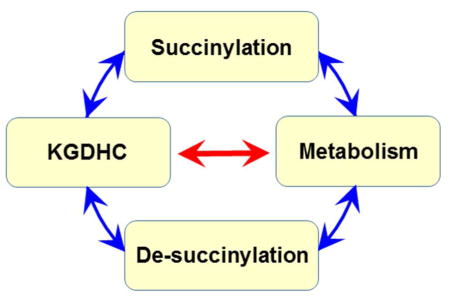
Succinylation of proteins is wide-spread, modifies both the charge and size of the molecules and can alter their function. For example, liver mitochondrial proteins have 1190 unique succinylation sites representing multiple metabolic pathways. Succinylation is sensitive to both increases and decreases of the NAD+ dependent de-succinylase, SIRT5. Although the succinyl group for succinylation is derived from metabolism, the effects of systematic variation of metabolism on mitochondrial succinylation are not known. Changes in succinylation of mitochondrial proteins following variations in metabolism were compared to mitochondrial redox state as estimated by the mitochondrial NAD+/NADH ratio using fluorescent probes. The ratio was decreased by reduced glycolysis and/or glutathione depletion (iodo-acetic acid; 2-deoxyglucose), depressed tricarboxylic acid cycle activity (carboxyethyl ester of succinyl phosphonate) and impairment of electron transport (antimycin) or ATP synthase (oligomycin), while uncouplers of oxidative phosphorylation (carbonyl cyanide m-chlorophenyl hydrazine or triphostin) increased the NAD+/NADH ratio. All of the conditions decreased succinylation. In contrast, reducing the oxygen from 20% to 2.4% increased succinylation. The results demonstrate that succinylation varies with metabolic states, is not correlated to the mitochondrial NAD+/NADH ratio and may help co-ordinate the response to metabolic challenge.
Keywords: Succinylation, α-ketoglutarate dehydrogenase, hypoxia, glucose, electron transport chain
Graphical Abstract
INTRODUCTION
Diminished glucose metabolism and mitochondrial dysfunction accompany neurodegenerative diseases, including Alzheimer’s disease (AD), and appear to be pathologically important (Gibson et al. 2016). Altered post-translational modifications of proteins may contribute to the neurodegenerative disease process (Iqbal et al. 2016). Succinylation induces a 98 kDa change in mass, comparable to that of two well-established lysine modifications: acetylation (41 kDA) and dimethylation. Comparable to acetylation, succinylation removes the positive charge on from the distal amino group of the lysine residue (it is now an amide functional group), although in contrast to acetylation, succinylation confers a negative charge at the end of the new functional group. Ultimately, upon succinylation, the overall charge of the lysine group changes from positive (cationic) to negative (anionic). Succinylation of proteins occurs in numerous cell compartments including the cytosol, mitochondria and nucleus (Weinert et al. 2013; Xie et al. 2012)(Rardin et al. 2013). Although the number of succinylation sites in brain mitochondria is unknown, purified liver mitochondria have about 1200 unique succinylation sites (Rardin et al. 2013). The degree of succinylation varies with organism and cell type. The patterns of the NAD+ dependent de-succinylase Sirtuin 5 (SIRT5) in brains suggest succinylation is altered with AD (Lutz et al. 2014). The mitochondrial α-ketoglutarate dehydrogenase complex (KGDHC) is diminished in AD (Gibson et al. 2015) and can regulate succinylation (Gibson et al. 2015). Although the succinyl groups for succinylation are derived from metabolism (Gibson et al. 2015), the effects of systematic variation of metabolism on succinylation are unknown. The goal of the current studies was to test whether changes in neuronal glycolysis, glutathione, tricarboxylic acid cycle or electron transport chain alters mitochondrial succinylation. Classic inhibitors of these pathways were utilized, however, these are not absolutely specific. For example, iodoacetic acid (IAA) will modify any reactive SH group, as well as many enzymes including KGDHC (Ambrose-Griffin et al. 1980), deplete glutathione (Schmidt and Dringen 2009) as well as deplete ATP and glutamate (Kim et al. 2017).
Experiments on succinylation/de-succinylation support the suggestion that succinylation/de-succinylation is a dynamic process. The NAD+ requiring enzyme SIRT5 suppresses metabolism in mouse embryonic fibroblasts by desuccinylating the pyruvate dehydrogenase complex (PDHC) and succinic dehydrogenase (Park et al. 2013). Respiration in mouse embryonic fibroblasts increases after deletion of SIRT5 and in liver mitochondria isolated from SIRT5 knockout mice (Park et al. 2013)(Sadhukhan et al. 2016). On the other hand, over-expression of the three mitochondrial sirtuins, SIRT3, SIRT4, and SIRT5, can promote increased mitochondrial respiration and cellular metabolism by inducing a coordinated increase of glycolysis and respiration, with the excess energy being dissipated by proton leak across the inner mitochondria membrane (Barbi de Moura et al. 2014). The effects of inhibition of neuronal glycolysis or electron transport chain on mitochondrial succinylation has not been studied.
To test whether changes in cellular metabolism alter succinylation, a variety of metabolic inhibitors were employed and the consequences on mitochondrial redox state and mitochondrial succinylation were determined. In this study, because of the focus on mitochondrial succinylation, neither cytosolic nor nuclear NAD+/NADH ratios were analyzed. The mitochondrial redox state was estimated by following the mitochondrial NAD+/NADH ratio (Bilan et al. 2014) and mitochondrial succinylation was estimated following published methods (Gibson et al. 2015). Since most classical inhibitors of these pathways lack specificity, multiple means of manipulating the pathways were utilized. Glucose uptake and glycolysis were inhibited by 2-deoxyglucose (2-DG) (Wick et al. 1957). Glycolysis was independently inhibited by the use of iodoacetic acid (IAA), but it also depletes gluathione (Schmidt and Dringen 2009). The citric acid cycle was diminished with the specific, cell permeable inhibitor of KGDHC, carboxyethyl ester of succinyl phosphonate (CESP) (Bunik et al. 2005). Complex I of the electron transport chain was inhibited with rotenone (Li et al. 2003; Orme-Johnson 2007; Wallace and Starkov 2000). ATP synthase was inhibited with oligomycin (Devenish et al. 2000; Orme-Johnson 2007; Wallace and Starkov 2000). Electron transport was uncoupled from oxidative phosphorylation with carbonyl cyanide-m-chlorophenyl hydrazone (CCCP) (Orme-Johnson 2007; Rottenberg 1983; Wallace and Starkov 2000) or Tyrphostin A9 (TA9) (Kiss et al. 2014; Starkov et al. 1997; Terada and Van Dam 1975) and cells were made hypoxic by reducing oxygen from 20% to 2.4%. The availability of acetyl groups is very sensitive to hypoxia (Gibson and Duffy 1981) but the consequences on succinylation/desuccinlyation are unknown. The results demonstrate that the level of succinylation changes with common metabolic perturbations.
Materials and Methods
Cell culture
N2a neuroblastoma cells were purchased from American Type Culture Collection (ATCC, Manassas; VA, USA). Cells were maintained at 37°C in complete media (DMEM supplemented with 10% fetal bovine serum) in a humidified incubator with 5% CO2 and 95% air.
Mitochondrial NAD+/NADH ratios in N2a cells
Mitochondrial NAD+/NADH ratios were measured from the normalized fluorescent signals of RexYFP-mito and the pH probe (SypHer-mito) which were provided by Dr. Dmitry Bilan and Dr. Vsevolod Belousov (Shemyakin-Ovchinnikov Institute of Bioorganic Chemistry (Bilan et al. 2014). RexYFP is a genetically encoded probe for the nicotinamide adenine dinucleotide redox state NAD+/NAD(H), made by inserting circularly permuted YFP into the redox sensor T-Rex from Thermus aquaticus. SypHer is a mutant form Hyper (HyPerC199S) for measuring pH levels. RexYFP-mito and SypHer-mito contain a mitochondrial localization sequence (MTS-2) to target the mitochondrial region (Bilan et al. 2014).
RexYFP-mito and SypHer-mito transfection
N2a cells were cultured on the Delta TPG dishes at a seeding density of 5 × 10⁴ cells/dish. The next day, DNA-Lipofectamine 2000 complexes were prepared by incubating Rex-YFP-mito (2 μg) or SypHer-mito (2μg) plasmid and Lipofectamine reagent (ThermoFisher, Grand Island, NY) in Opti-MEM media (ThermoFisher, Grand Island, NY) at RT for 5 min. N2a cells were transfected Rex-YFP or SypHer by adding 50 μl of DNA-Lipofectamine complexes directly into the culture media and cultured for 48 hours at 37 °C. Images of Rex-YFP-mito (2 μg) or SypHer-mito were obtained with a Zeiss LSM 510 Meta laser scanning confocal microscope (Carl Zeiss, Thornwood, NY, USA) equipped with a plan-neofluor 40×/1.3 objective (488 nm excitation; 505–550 emission) at 1 min intervals. RexYFP-mito and SypHer-mito fluorescent signals were averaged from all the cells in the same time intervals by using image analysis software (ImageJ, National Institute of Health). Mitochondrial NAD+/NADH ratio were calculated by normalizing the F/F0 of RexYFP-mito to the F/F0 of the SypHer-mito (Bilan et al. 2014).
Mitochondrial co-localization
Forty-eight hours after RexYFP-mito and/or SypHer-mito transfection, N2a cells were rinsed with balanced salt solution (BSS; 140 mM NaCl, 5 mM KCl, 1.5 mM MgCl2, 5 mM glucose, 10 mM HEPES, 2.5 mM CaCl2, pH 7.4) once and replaced with BSS buffer containing MitoTracker Red (1 μM; ThemoFisher, Grand Island, NY) and incubated at 37°C for 30 min. After MitoTracker Red incubation, cells were rinsed with BSS once and the mitochondrial colocations were observed with using confocal laser scanning microscopy with a plan-neofluor 40×/1.3 objective (488 nm excitation; 505–550 emission).
Preparation of mitochondrial fraction
N2a cells were seeded on the 10 cm dishes at a density of 8 × 10⁵ cells/dish and cultured for two days. After two days of culture, the mitochondrial fractions were isolated using published methods (Gibson et al. 2015).
Western blotting and immunoprecipitation
The mitochondrial fractions were suspended in chilled lysate buffer [10 mM Tris-HCl; pH 8.0 100 mM NaCl, 1 mM EDTA, 0.5% (w/v) NP-40], sonicated and centrifuged at 10000 g for 10 min at 4°C. The supernatant (200 μg protein/mL) were immuno-precipitated with Pan anti-succinyllysine antibody and protein A agarose beads (20 μL/mL) overnight at 4°C with gentle shaking. After immuno-precipitation, the beads were washed three times with one mL of NETN buffer [100 mM NaCl, 1 mM EDTA, 20 mM Tris pH 8.0, and 0.5% (w/v) NP-40] and three times with ETN (50 mM Tris-HCl, pH 8.0, 100 mM NaCl, 1 mM EDTA). The bound peptides were eluted from beads by washing three times with 100 μL of 0.1 M glycine (pH 2.5). 10 μg of sample was loaded on each lane for electrophoreses and Western blotting (Gibson et al. 2015). The membranes were scanned with the Odyssey Infrared Imaging System (LICOR Biosciences). The fluorescence signal is directly proportional to the amount of target protein over a large dynamic range (Gibson et al. 2015).
Treatment with metabolic inhibitors
N2a cells were seeded on 10 cm dishes at the density of 8 × 10⁵ cells/dish and cultured for two days as described above. For the different metabolic manipulations, cells were incubated with the inhibitors in BSS buffer for 20 min at 37°C in a humidified incubator with 5% CO2 and 95% air. N2a neuroblastoma cells were treated with 2-deoxyglucose (2-DG, ≥98% purity, 15 mM), iodoacetic acid (IAA, ≥98% purity, 5 μM), rotenone (5 μM, ≥95% purity), oligomycin (10 μM, ≥95% purity), CCCP (≥97% purity, 5μM), TA9 (≥98% purity, 5μM), and carboxyethyl ester of succinyl phosphonate (CESP, 100μM) for 5, 10, and 20 min. All the chemicals were purchased from Sigma-Aldrich (St Louis, MO) and CESP was provided by Dr. Travis T. Denton (Department of Pharmaceutical Sciences, Washington State University).
Induction of hypoxia
N2a cells were seeded in 10 cm dishes at the density of 8 × 10⁵ cells/dish and cultured for two days as decried above. To induce hypoxia, culture dishes were transferred to an airtight custom-built glove box (Coy Laboratory Products, Grass Lake, MI) that was hypoxic (2.4% O2, 5% CO2, 92.6% N2). Cells were washed and treated with pre-equilibrated BSS for 1 hour at 37°C. The normoxic cells were incubated under 5% CO2 and 95% air.
Results
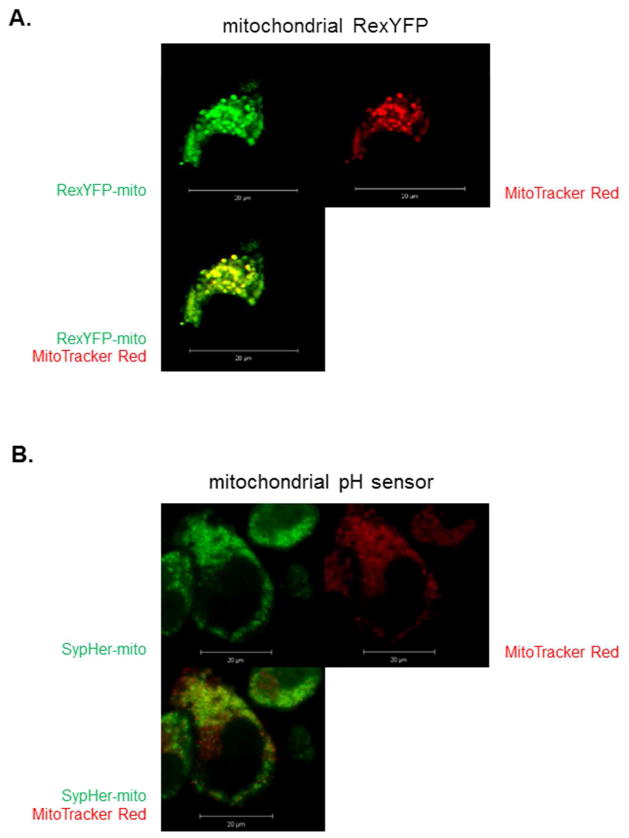
The usefulness of the RexYFP-mito probe to measure mitochondrial NAD+/NADH requires mitochondrial co-localization with SypHer-mito. The co-localization of RexYFP-mito with mitoTracker red and the punctate distribution of both probes supported their localization in the mitochondria (Figure 1). The ratio of the two probes provides an estimate of the mitochondrial NAD+/NADH ratio (Bilan et al. 2014).
Figure 1.
Mitochondrial localization of RexYFP-mito and SypHer-mito in N2a cells. Mitochondrial localization of the NADH probe and mitochondrial pH probe in N2a cells. N2a cells were cultured on the Delta TPG dishes at a seeding density of 5× 10⁴ cells/dish. The next day, cells were transfected with RexYFP-mito (1A) or SypHer-mito (1B) for 48 hr at 37°C. After transfection, the cells were loaded with MitoTracker Red (1 μM) for 30 min at 37°C. After loading, cells were rinsed with BSS buffer and the fluorescent signals were acquired by a confocal laser scanning microscopy with a plan-neofluor 40×/1.3 objective (488 nm excitation; 505–550 emission) (see Methods).
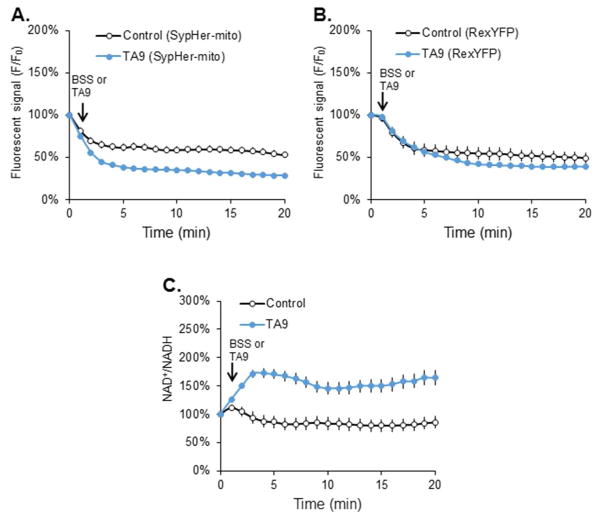
The changes in fluorescence of both probes were followed temporally and the ratio was used to calculate the mitochondrial NAD+/NADH at each time point (Figure 2). The control was very consistent over the 20-minute time interval after correction for pH. The RexYFP-mito probe responded to the treatment. The complete temporal response was determined for every condition. The statistical analysis for between group comparisons were done at 5, 10 and 20 minutes (Figure 3).
Figure 2.
The temporal response of RexYFP-mito, SypHer-mito and the NAD+/NADH ratio to the uncoupler TA9.
(A) Fluorescent signal (F/F0) of SypHer-mito after TA9. N2a cells were transfected with SypHer-mito (2 μg) for 48 hr at 37°C. After transfection, the cells were treated with TA9 (5 μM) for 20 min. (B) Fluorescent signal (F/F0) of RexYFP-mito after TA9. N2a cells were transfected with RexYFP-mito (2 μg) for 48 hr at 37°C. After transfection, the cells were treated with TA9 (5 μM) for 20 min. (C) NAD+/NADH ratios after TA9 treatment. NAD+/NADH ratio were calculated by normalizing the F/F0 of RexYFP-mito to the F/F0 of the SypHer-mito.
Values are the means ± S.E.M. of the NAD+/NADH ratio at different time points compared with basal NAD+/NADH level from two independent experiments (total 328 cells, 153 cells from 5 dishes in control and 172 cells from 6 dishes in treatment group)
Figure 3.
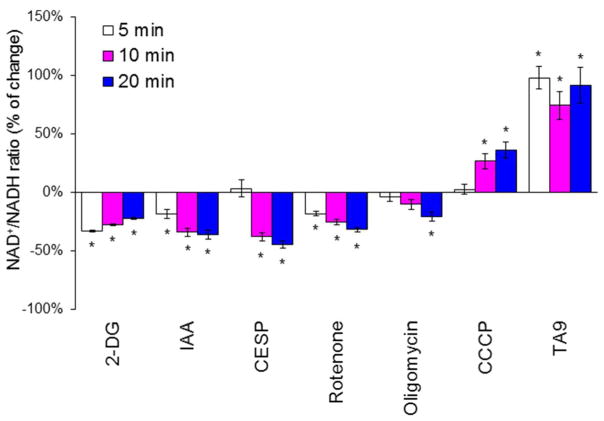
Metabolic manipulation alters the mitochondrial NAD+/NADH ratio in N2a cells.
N2a cells were cultured on the Delta TPG dishes at a seeding density of 5 × 10⁴ cells/dish. The next day, cells were transfected with RexYFP-mito (2 μg) or SypHer-mito (2 μg) for 48 hr at 37°C. After transfection, the cells were rinsed with BSS buffer and the fluorescent signals were acquired with a confocal laser scanning microscope with a plan-neofluar 40×/1.3 objective (488 nm excitation; 505–550 emission). In the following sentences n refers to the number of cells that were analyzed from 3 to 4 experiments. After 1 min of basal signal, 2-DG (15 mM; n=115), IAA (5 μM; n=81), rotenone (5 μM; n=54), oligomycin (10 μM; n=80), CCCP (5 μM; n=100), TA9 (5 μM; n=66), or CESP (100 μM; n=80) were added directly into the dishes and the signals were acquired for 5, 10 and 20 min. Values are the means ± S.E.M. of the NAD+/NADH ratio % changes compared with control group. *Values vary significantly (p<0.05) from control by ANOVA followed by the Student Newman-Keuls test.
The mitochondrial NAD+/NADH ratio was sensitive to multiple metabolic changes. 2-DG (15 mM, final) decreased the mitochondrial NAD+/NADH ratio from 22 to 33%. IAA (5 μM) decreased the mitochondrial NAD+/NADH ratio from 19% to 36%. CESP, a selective inhibitor of KGDHC, decreased the mitochondrial NAD+/NADH ratio from 38% to 45% (Figure 3). Rotenone (5 μM) decreased the mitochondrial NAD+/NADH ratio from 18% to 32%. Oligomycin (5 μM) decreased the mitochondrial NAD+/NADH ratio by 21% after a 20 min treatment. CCCP (5 μM) increased the mitochondrial NAD+/NADH ratio by 27% to 36%. TA9 (5 μM) increased the mitochondrial NAD+/NADH ratio from 74 to 98%. The experimental arrangements did not allow determination of the mitochondrial NAD+/NADH ratio of the hypoxia group because the confocal microscope does not fit in the hypoxia box (see methods).
A large number of proteins are succinylated under control conditions (Figure 4). Individual proteins were not identified. Instead, the effects on multiple protein bands were determined. An example is shown in Figure 4 in which each band contains many proteins. All bands were examined at the same sensitivity which increased the variability for the lower and higher intensity bands. The interpretation of the results must take into account possible experimental variability. The possibility also exists that the yield of mitochondria varied with the treatments. However, our previous experiments show that many treatments including freezing the mitochondrial do not alter the recovery of mitochondrial proteins. Normalization of protein after immunoprecipitation with the anti-succinylation antibody is difficult. Indeed, the hypothesis is that the amount of protein will vary between groups. The proteins that are normally used to quantify the protein in a lane are not necessarily pulled down by the antibody. Thus, one starts with the same protein for the IP and treats all samples identically.
Figure 4.
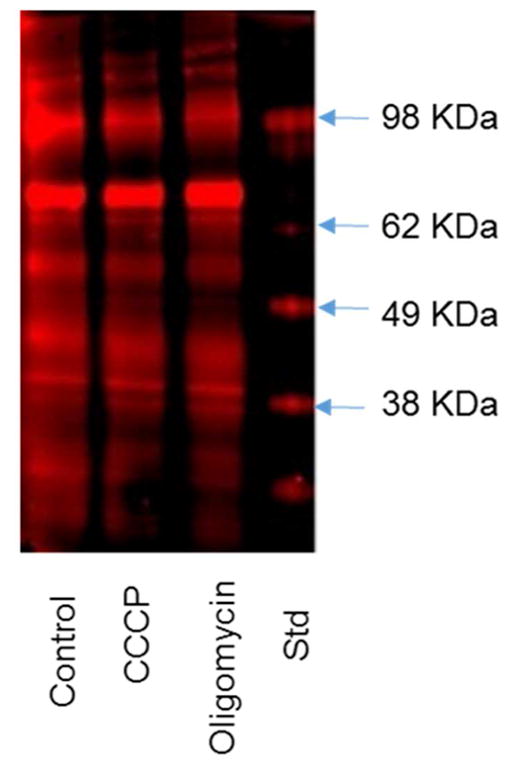
Diminished succinylation following treatment with CCCP or oligomycin. N2a cells were seeded on the 10 cm dishes at the density of 8 × 10⁶ cells/dish and cultured for two days. After two day of culture, the cells were treated with CCCP (5μM) or Oligomycin (10 μM) in BSS buffer for 20 min at 37°C. After treatment, the mitochondrial fractions were isolated and immnuoprecipitated with Pan anti-succinyllysine antibody overnight at 4°C and separated by Western blot.
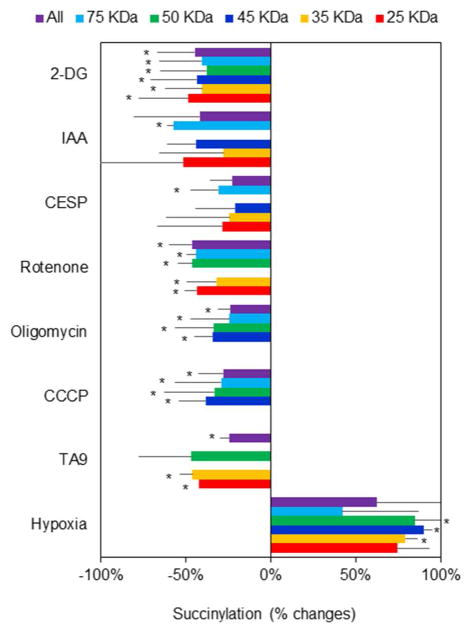
Each of the metabolic manipulations altered succinylation (Figure 5). All of the metabolic conditions for which the mitochondrial NAD+/NADH ratios were determined diminished succinylation of multiple proteins. Hypoxia increased succinylation, but the logistics of the hypoxia treatment did not allow determination of the mitochondrial NAD+/NADH ratio. The percent change varied between bands at different molecular weights (the number in parentheses is the range of percent inhibition for the different bands): 2-DG (42%), IAA (−57), CESP (−30.8%). rotenone (−42.3%), oligomycin (−28.9%), CCCP (−32.1%), TA9 (−39.9%). Hypoxia is the only treatment that increased succinylation (+84.7%). The experiments clearly show that succinylation is responsive to metabolic perturbations.
Figure 5.
The effects of various metabolic perturbations on succinylation. Conditions for each manipulation were exactly as for determining the NAD+/NADH ratios.
N2a cells were seeded on the 10 cm dishes at the density of 8 × 10⁶ cells/dish and cultured for two days. After two days of culture, the cells were treated with 2-DG (15 mM), IAA (5 μM), CESP (100 μM), Rotenone (5 μM), Oligomycin (10 μM), CCCP (5 μM), TA9 (5 μM) for 20 min at 37°C. For the hypoxia experiments, cells were incubated with hypoxia (2.4% O2) for 1 hour at 37°C. The mitochondrial fractions from different treatments were isolated and immnuoprecipitated with Pan anti-succinyllysine antibody overnight at 4°C and separated by Western blot. Each band reflects succinylation of many proteins so the results are quite variable. Data were the changes of succinylation compared with control group from different bands of protein expression after rejecting the outliers with Q-test. *Values vary significantly (p<0.05) from control by ANOVA followed by the Tukey test. df (degree of freedom) and F values in each groups are shown in the following table.
| Treatment | 2-DG | IAA | CESP | Rotenone | Oligomycin | CCCP | TA9 | Hypoxia |
|---|---|---|---|---|---|---|---|---|
| df (between groups) | 6 | 5 | 5 | 5 | 4 | 4 | 4 | 6 |
| df (within groups) | 41 | 16 | 34 | 34 | 33 | 33 | 15 | 15 |
| F | 12.8 | 5.4 | 4.0 | 66.0 | 15.9 | 10.9 | 16.0 | 6.4 |
Discussion
Thousands of proteins are modified post-translationally (Choudhary et al. 2014). Acetylation is the best studied post-translational modification. Virtually every enzyme involved in glycolysis, gluconeogenesis, the tricarboxylic acid cycle, the urea cycle, fatty acid metabolism, and glycogen metabolism are acetylated post-translationally. The acetylation status of metabolic enzymes changes with the concentration of metabolic fuels, such as glucose, amino acids, and fatty acids. Acetylation plays a major role in metabolic regulation (Zhao et al. 2010). Reversible acetylation of metabolic enzymes ensure that cells respond to environmental changes by promptly sensing cellular energy status and flexibly altering reaction rates or directions (Zhao et al. 2010).
To test how mitochondrial succinylation varies with various metabolic states, neuronal cells were manipulated by well-characterized conditions that alter major cellular metabolic pathways. The experiments were performed in neuronal cells because of our interest in neurodegeneration. The findings are likely to be similar in multiple cells including liver and heart. The treatments, except hypoxia were all tested for 20 minutes to allow direct comparisons. The mitochondrial NAD+/NADH ratio was monitored to reflect altered metabolism. The mitochondrial NAD+/NADH ratio decreased following treatment that blocked glucose entry and glycolysis (2-DG), inhibited glycolysis and glutathione depletion (IAA) (Schmidt and Dringen 2009), inhibited KGDHC activity (CESP), blocked electron transport (rotenone), or inhibited ATP synthase (oligomycin). On the other hand, the two uncouplers (CCCP and TA9) increased the mitochondrial NAD+/NADH ratio. Although the mitochondrial NAD+/NADH ratio could not be determined during hypoxia, the profound increase in succinylation suggests there was a strong effect. In our previous studies in brain slices and synaptosomes, this percent oxygen reduced ATP levels and acetylcholine synthesis by about one half (Ksiezak and Gibson 1981). The results show diminished succinylation with both increases and decreases in the mitochondrial NAD+/NADH ratio. These methods do not allow the determination of mitochondrial NAD+ or NADH levels which regulate sirtuins and desuccinylation. Although classically used as an inhibitor of glycolysis, IAA has many actions. Indeed, glutathione depletion is much more sensitive to IAA than lactate production [1]. None of the inhibitors in Figures 3 and 5 are absolutely specific. This is compounded by the problem that any change in metabolism is reflected immediately in all of metabolism. The specificity of the actions of IAA is a good example of this. It is a classical inhibitor of glycolysis yet it has many actions. In astrocytes, IAA is a better deplete of glutathione than inhibitor of glycolysis [1]). In cultures of neurons, IAA leads to depletion of glutamate and ATP [2]. This lack of specificity does not negate the conclusion that succinylation is very dynamic in response to metabolic perturbation.
The results demonstrate that succinylation is sensitive to metabolic perturbations. These relatively short treatments (20 minutes) caused dramatic changes in succinylation. Most of the treatments led to diminished succinylation, whether mitochondrial NAD+/NADH ratio was increased or decreased. The surprising result was the dramatic increase in succinylation with hypoxia. We cannot create hypoxia in a manner that allows us to estimate mitochondrial NAD+/NADH ratios. The results clearly suggest that there is not a direct linkage of mitochondrial NAD+/NADH levels to succinylation since both increases and decreases in mitochondrial NAD+/NADH are associated with diminished succinylation.
Our data does not allow us to distinguish if the change in metabolic state with perturbation is due to reduced succinylation or to increased desuccinylation. De-succinylation is regulated by sirtuins (NAD+ dependent desuccinylases)-especially SIRT5 (Du et al. 2011; Sadhukhan et al. 2016). In heart, lysine succinylation predominantly accumulates when SIRT5 is deleted. SIRT5-deficient mice exhibit defective fatty acid metabolism, decreased ATP production, and hypertrophic cardiomyopathy. The data suggest that regulating heart metabolism and function is a major physiological role of lysine succinylation and SIRT5 (Du et al. 2011; Sadhukhan et al. 2016). The fluorescence approach that we use to estimate redox state primarily measures mitochondrial NAD+/NADH ratio, it also provides an estimate of NADH levels. Although regulation by NADH has not been tested for succinylation, all tested sirtuin deacylase activities show sensitivity to NADH. However, the inhibitory concentrations of NADH are far greater than the predicted concentrations of NADH in cells. Therefore, the data indicate that NADH is unlikely to inhibit sirtuins in vivo (Madsen et al. 2016).
Few studies have been done to relate succinylation and SIRT5 to AD. However, data with acetylation suggests it may be important. Acetylation has been related to tau proteins (Iqbal et al. 2016). The results obtained in our study show that the dynamic nature of succinylation should be considered when trying to determine the role of metabolism in the pathophysiology of the disease processes. Aberrant tau acetylation has a key role in tau accumulation and dysfunction related to neurodegenerative diseases (Min et al. 2013). Thus, the role of protein succinylation in metabolism and pathology merits further study.
Significance.
The significance of wide spread post-translational modification of proteins is unknown. The mitochondrial enzyme alpha ketoglutarate dehydrogenase complex can control succinylation. The results show that multiple metabolic conditions alter the succinylation of many mitochondrial proteins and this is not correlated to the changes in the NAD+/NADH ratio. Thus, succinylation is dynamic and changes with metabolism, but the precise link remains unknown.
Acknowledgments
This work was supported by NIH 2P01AG014930 to GG and the Burke Medical Research Institute.
Grant of the President of Russia MK-6339.2016.4 to VVB, DSB.
Startup funds from Washington State University, College of Pharmacy to TTD,
Abbreviations
- BSS
balanced salt solution (140 mM NaCl, 5 mM KCl, 1.5 mM MgCl2, 5 mM glucose, 10 mM HEPES, 2.5 mM CaCl2, pH 7.4)
- CCCP
carbonyl cyanide-m-chlorophenyl hydrazone
- CESP
carboxy-ethyl ester of succinyl phosphonate
- 2-DG
2-deoxyglucose
- IAA
iodoacetic acid
- KGDHC
α-Ketoglutarate dehydrogenase complex
- MTS-2
mitochondrial localization sequence
- PDHC
pyruvate dehydrogenase complex
- SIRT5
Sirtuin5
- TA9
Tyrphostin A9
References
- Ambrose-Griffin MC, Danson MJ, Griffin WG, Hale G, Perham RN. Kinetic analysis of the role of lipoic acid residues in the pyruvate dehydrogenase multienzyme complex of Escherichia coli. Biochemical Journal. 1980;187(2):393–401. doi: 10.1042/bj1870393. [DOI] [PMC free article] [PubMed] [Google Scholar]
- Barbi de Moura M, Uppala R, Zhang Y, Van Houten B, Goetzman ES. Overexpression of Mitochondrial Sirtuins Alters Glycolysis and Mitochondrial Function in HEK293 Cells. PLOS ONE. 2014;9(8):e106028. doi: 10.1371/journal.pone.0106028. [DOI] [PMC free article] [PubMed] [Google Scholar]
- Bilan DS, Matlashov ME, Gorokhovatsky AY, Schultz C, Enikolopov G, Belousov VV. Genetically encoded fluorescent indicator for imaging NAD+/NADH ratio changes in different cellular compartments. Biochimica et Biophysica Acta (BBA) - General Subjects. 2014;1840(3):951–957. doi: 10.1016/j.bbagen.2013.11.018. [DOI] [PMC free article] [PubMed] [Google Scholar]
- Bunik VI, Denton TT, Xu H, Thompson CM, Cooper AJL, Gibson GE. Phosphonate Analogues of α-Ketoglutarate Inhibit the Activity of the α-Ketoglutarate Dehydrogenase Complex Isolated from Brain and in Cultured Cells. Biochemistry. 2005;44(31):10552–10561. doi: 10.1021/bi0503100. [DOI] [PubMed] [Google Scholar]
- Choudhary C, Weinert BT, Nishida Y, Verdin E, Mann M. The growing landscape of lysine acetylation links metabolism and cell signalling. Nat Rev Mol Cell Biol. 2014;15(8):536–550. doi: 10.1038/nrm3841. [DOI] [PubMed] [Google Scholar]
- Devenish RJ, Prescott M, Boyle GM, Nagley P. The Oligomycin Axis of Mitochondrial ATP Synthase: OSCP and the Proton Channel. Journal of Bioenergetics and Biomembranes. 2000;32(5):507–515. doi: 10.1023/a:1005621125812. [DOI] [PubMed] [Google Scholar]
- Du J, Zhou Y, Su X, Yu JJ, Khan S, Jiang H, Kim J, Woo J, Kim JH, Choi BH, He B, Chen W, Zhang S, Cerione RA, Auwerx J, Hao Q, Lin H. Sirt5 Is a NAD-Dependent Protein Lysine Demalonylase and Desuccinylase. Science. 2011;334(6057):806–809. doi: 10.1126/science.1207861. [DOI] [PMC free article] [PubMed] [Google Scholar]
- Gibson GE, Duffy TE. Impaired Synthesis of Acetylcholine by Mild Hypoxic Hypoxia or Nitrous Oxide. Journal of Neurochemistry. 1981;36(1):28–33. doi: 10.1111/j.1471-4159.1981.tb02373.x. [DOI] [PubMed] [Google Scholar]
- Gibson GE, Hirsch JA, Fonzetti P, Jordan BD, Cirio RT, Elder J. Vitamin B1 (thiamine) and dementia. Annals of the New York Academy of Sciences. 2016;1367(1):21–30. doi: 10.1111/nyas.13031. [DOI] [PMC free article] [PubMed] [Google Scholar]
- Gibson GE, Xu H, Chen H-L, Chen W, Denton TT, Zhang S. Alpha-ketoglutarate dehydrogenase complex-dependent succinylation of proteins in neurons and neuronal cell lines. Journal of Neurochemistry. 2015;134(1):86–96. doi: 10.1111/jnc.13096. [DOI] [PMC free article] [PubMed] [Google Scholar]
- Iqbal K, Liu F, Gong C-X. Tau and neurodegenerative disease: the story so far. Nat Rev Neurol. 2016;12(1):15–27. doi: 10.1038/nrneurol.2015.225. [DOI] [PubMed] [Google Scholar]
- Kim AY, Jeong K-H, Lee JH, Kang Y, Lee SH, Baik EJ. Glutamate dehydrogenase as a neuroprotective target against brain ischemia and reperfusion. Neuroscience. 2017;340:487–500. doi: 10.1016/j.neuroscience.2016.11.007. [DOI] [PubMed] [Google Scholar]
- Kiss G, Konrad C, Pour-Ghaz I, Mansour JJ, Nemeth B, Starkov AA, Adam-Vizi V, Chinopoulos C. Mitochondrial diaphorases as NAD+ donors to segments of the citric acid cycle that support substrate-level phosphorylation yielding ATP during respiratory inhibition. The FASEB Journal. 2014;28(4):1682–1697. doi: 10.1096/fj.13-243030. [DOI] [PMC free article] [PubMed] [Google Scholar]
- Ksiezak HJ, Gibson GE. Oxygen Dependence of Glucose and Acetylcholine Metabolism in Slices and Synaptosomes from Rat Brain. Journal of Neurochemistry. 1981;37(2):305–314. doi: 10.1111/j.1471-4159.1981.tb00456.x. [DOI] [PubMed] [Google Scholar]
- Li N, Ragheb K, Lawler G, Sturgis J, Rajwa B, Melendez JA, Robinson JP. Mitochondrial Complex I Inhibitor Rotenone Induces Apoptosis through Enhancing Mitochondrial Reactive Oxygen Species Production. Journal of Biological Chemistry. 2003;278(10):8516–8525. doi: 10.1074/jbc.M210432200. [DOI] [PubMed] [Google Scholar]
- Madsen AS, Andersen C, Daoud M, Anderson KA, Laursen JS, Chakladar S, Huynh FK, Colaco AR, Backos DS, Fristrup P, Hirschey MD, Olsen CA. Investigating the Sensitivity of NAD+-dependent Sirtuin Deacylation Activities to NADH. Journal of Biological Chemistry. 2016;291(13):7128–7141. doi: 10.1074/jbc.M115.668699. [DOI] [PMC free article] [PubMed] [Google Scholar]
- Min S-w, Sohn P, Cho S-h, Swanson R, Gan L. Sirtuins in neurodegenerative diseases: an update on potential mechanisms. Frontiers in Aging Neuroscience. 2013;5(53) doi: 10.3389/fnagi.2013.00053. [DOI] [PMC free article] [PubMed] [Google Scholar]
- Orme-Johnson N. Methods in Cell Biology. Academic Press; 2007. Appendix 2. Direct and Indirect Inhibitors of Mitochondrial ATP Synthesis; pp. 813–826. [DOI] [PubMed] [Google Scholar]
- Park J, Chen Y, Tishkoff Daniel X, Peng C, Tan M, Dai L, Xie Z, Zhang Y, Zwaans Bernadette MM, Skinner Mary E, Lombard David B, Zhao Y. SIRT5-Mediated Lysine Desuccinylation Impacts Diverse Metabolic Pathways. Molecular Cell. 2013;50(6):919–930. doi: 10.1016/j.molcel.2013.06.001. [DOI] [PMC free article] [PubMed] [Google Scholar]
- Rardin Matthew J, He W, Nishida Y, Newman John C, Carrico C, Danielson Steven R, Guo A, Gut P, Sahu Alexandria K, Li B, Uppala R, Fitch M, Riiff T, Zhu L, Zhou J, Mulhern D, Stevens Robert D, Ilkayeva Olga R, Newgard Christopher B, Jacobson Matthew P, Hellerstein M, Goetzman Eric S, Gibson Bradford W, Verdin E. SIRT5 Regulates the Mitochondrial Lysine Succinylome and Metabolic Networks. Cell Metabolism. 2013;18(6):920–933. doi: 10.1016/j.cmet.2013.11.013. [DOI] [PMC free article] [PubMed] [Google Scholar]
- Rottenberg H. Uncoupling of oxidative phosphorylation in rat liver mitochondria by general anesthetics. Proceedings of the National Academy of Sciences. 1983;80(11):3313–3317. doi: 10.1073/pnas.80.11.3313. [DOI] [PMC free article] [PubMed] [Google Scholar]
- Sadhukhan S, Liu X, Ryu D, Nelson OD, Stupinski JA, Li Z, Chen W, Zhang S, Weiss RS, Locasale JW, Auwerx J, Lin H. Metabolomics-assisted proteomics identifies succinylation and SIRT5 as important regulators of cardiac function. Proceedings of the National Academy of Sciences. 2016;113(16):4320–4325. doi: 10.1073/pnas.1519858113. [DOI] [PMC free article] [PubMed] [Google Scholar]
- Schmidt M, Dringen R. Differential effects of iodoacetamide and iodoacetate on glycolysis and glutathione metabolism of cultured astrocytes. Frontiers in Neuroenergetics. 2009;1(1) doi: 10.3389/neuro.14.001.2009. [DOI] [PMC free article] [PubMed] [Google Scholar]
- Starkov AA, Bloch DA, Chernyak BV, Dedukhova VI, Mansurova SE, Severina II, Simonyan RA, Vygodina TV, Skulachev VP. 6-Ketocholestanol is a recoupler for mitochondria, chromatophores and cytochrome oxidase proteoliposomes. Biochim Biophys Acta. 1997;1318(1–2):159–172. doi: 10.1016/s0005-2728(96)00134-x. [DOI] [PubMed] [Google Scholar]
- Terada H, Van Dam K. On the, stoichiometry between uncouplers of oxidative phosphorylation and respiratory chains. The catalytic action of SF 6847 (3,5-di-tert-butyl-4-hydroxybenzylidenemalononitrile) Biochimica et Biophysica Acta (BBA) - Bioenergetics. 1975;387(3):507–518. doi: 10.1016/0005-2728(75)90089-4. [DOI] [PubMed] [Google Scholar]
- Wallace KB, Starkov AA. Mitochondrial targets of drug toxicity. Annual Review of Pharmacology and Toxicology. 2000;40:353–388. doi: 10.1146/annurev.pharmtox.40.1.353. [DOI] [PubMed] [Google Scholar]
- Wick AN, Drury DR, Nakada HI, Wolfe JB, Britton Wttao B, Grabowski R. Localization of the primary metabolic block produced by 2-deoxyglucose. Journal of Biological Chemistry. 1957;224(2):963–969. [PubMed] [Google Scholar]
- Zhao S, Xu W, Jiang W, Yu W, Lin Y, Zhang T, Yao J, Zhou L, Zeng Y, Li H, Li Y, Shi J, An W, Hancock SM, He F, Qin L, Chin J, Yang P, Chen X, Lei Q, Xiong Y, Guan K-L. Regulation of Cellular Metabolism by Protein Lysine Acetylation. Science. 2010;327(5968):1000–1004. doi: 10.1126/science.1179689. [DOI] [PMC free article] [PubMed] [Google Scholar]


