Abstract
AIMS:
To evaluate the relationship between the apparent diffusion coefficient (ADC) value for bladder cancer and the recurrence/progression risk of post-transurethral resection (TUR).
METHODS:
Forty-one patients with initial and non-muscle-invasive bladder cancer underwent MRI from 2009 to 2012. Two radiologists measured ADC values. A pathologist calculated the recurrence/progression scores, and risk was classified based on the scores. Pearson’s correlation was used to analyze the correlations of ADC value with each score and with each risk group, and the optimal cut-off value was established based on receiver operating characteristic (ROC) curve analysis. Furthermore, the relationship between actual recurrence / progression of cases and ADC values was examined by Unpaird U test.
RESULTS:
There were significant correlations between ADC value and the recurrence score as well as the progression score (P<0.01, P<0.01, respectively). There were also significant correlations between ADC value and the recurrence risk group as well as progression risk group (P=0.042, P<0.01, respectively). The ADC cut-off value on ROC analysis was 1.365 (sensitivity 100%; specificity 97.4%) for the low and intermediate recurrence risk groups, 1.024 (sensitivity 47.4%; specificity 100%) for the intermediate and high recurrence risk groups, 1.252 (sensitivity 83.3%; specificity 81.3%) for the low and intermediate progression risk groups, and 0.955 (sensitivity 87.5%; specificity 63.2%) between the intermediate and high progression risk groups. The difference between the ADC values of the recurrence and nonrecurrence group in Unpaired t test was significant (P<0.05).
CONCLUSION:
ADC on MRI in bladder cancer could potentially be useful, non-invasive measurement for estimating the risks of recurrence and progression.
Keywords: bladder cancer, transurethral resection, recurrence, magnetic resonance imaging, apparent diffusion coefficient
Introduction
In Europe, bladder cancer is the 4th most prevalent cancer, with the 11th highest mortality1).
Approximately 70-80% of incidentally discovered bladder cancer is non-muscle-invasive cancer. In these cases, regular follow-up is important because of the potential development of recurrence or progression following transurethral resection (TUR). The relationship between histological grade and clinical prognosis in cases of non-muscle-invasive bladder cancer is not a simple proportional relationship; the probabilities of recurrence and progression at one year range from 15-60% and from 1-17%, respectively2).
It has recently been reported that apparent diffusion coefficient (ADC) values calculated on the basis of diffusion-weighted magnetic resonance imaging (MRI) are useful in differentiating benign and malignant tumors and in classifying histological grade, where the introduction of fast imaging sequences and coil development have led to greater and greater progress in minimizing artifacts and to an increasing focus on its usefulness in bladder cancer3-8).
European researchers have created a simple scoring system for estimating the risk for recurrence and progression to muscle-invasive cancer following TUR in cases of non-muscle-invasive bladder cancer and for classifying risk as low, intermediate, or high. This is the European Association of Urology (EAU) score.
This score is incorporated in EAU guidelines on non muscle invasive urothelial carcinoma of the bladder, the 2011 update9).
It is essential for its diagnosis and treatment which TUR in cases of non-muscle-invasive bladder cancer. After TUR, EAU score is used as a risk assessment of recurrence or progression. On the other hand, before performing TUR, if we can estimate the degree of risk of recurrence and progression from index (That is, it is the ADC) obtained in combination with preliminary localization diagnosis of bladder cancer with MRI, accurate prediction of the presence or absence of aggressive disease before TUR would allow bladder cancer patients to avoid costly and invasive repeat TUR prodedures for staging purposes. In addition, it may be possible to schedule TUR as a high-risk case in advance, perform a random biopsy as a high risk group, and careful follow-up observation carefully along with the EAU score.
In this study, the correlations between ADC values and the EAU score and between ADC values and groups at risk for recurrence or progression classified on the basis of EAU scores were examined.
Furthermore, in this study, relation between ADC value of bladder cancer and actual recurrence and actual progression was examined.
Materials and Methods
Materials
All 58 patients with initial bladder cancer who had undergone pelvic MRI from April 2009 to July 2012 subsequently underwent TUR after MRI.
Seven patients were excluded from the analysis of the correlation between ADC and EAU. Four were excluded because bladder cancer could not be identified on MRI, and three were excluded because the tissue type was not urothelial cancer. Ten more subjects were excluded because of a diagnosis of muscle-invasive cancer. The remaining 41 patients (35 males (average age 71±9 years) and 6 females (average age 75±8 years)) were analyzed. Twenty-five of the analyzed patients had multiple tumors. Among the cases studied, the total number of tumors identified by MRI was 119. The average time from pelvic MRI to TUR was 21±10 days (range: 1 to 43 days). Thirty-six of the forty-one patients underwent TUR within 30 days of pelvic MRI.
Examinations were conducted in compliance with the study site conventions for handling patient confidentiality, and approval was obtained from the study site ethics committees, with an exemption from written explanation and consent for this retrospective study.
MRI Protocol
MRI was performed using a 1.5-T MRI scanner (Signa HDxt1.5T® GE Healthcare Japan, Hino, Tokyo, Japan) with an 8-channel sensitivity encoding cardiac ARRAY coil. The following MRI sequences were used: fast spin-echo T2-weighted axial images (TR/TE: 4390-5434/120 msec; matrix: 256×189; ROI: 23 cm; slice thickness: 4 mm; gap: 0.4 mm; acquisition time: 3: 36); chemical-shift-selective, fat-suppression plus diffusion-weighted images obtained with a single-shot spin-echo-planar sequence (TR/TE: 2790-4650/80 msec; matrix: 128×109; ROI: 25-33 mm; slice thickness: 4 mm; gap: 0.4 mm; b value: 0, 1000 sec/mm2; acquisition time: 2: 52); and chemical-shift-selective, fat-suppression plus dynamic contrast-enhanced T1-weighted axial images (TR/TE: 1.8/3.8 msec; matrix: 256×192; ROI: 32-36 mm; slice thickness: 4 mm; gapless; acquisition time: 16 sec×3 times). ADC maps were automatically reconstructed from images acquired using b values of 0 and 1000 sec/mm2, and they were transmitted to a medical diagnostic imaging system (PSP PACS®: PSP Corporation, Tokyo, Japan). For dynamic contrast-enhanced imaging, images were acquired pre, 40, 90, and 180 seconds after the administration of a bolus of 0.2 mL/kg contrast and subsequent 20 mL saline solution using an injector. The contrast agent was gadodiamide hydrate (OmniScan®: Daiichi Sankyo Pharmaceuticals, Tokyo, Japan) and meglumine gadopentetate (Magnevist®: Bayer Yakuhin, Ltd., Osaka, Japan). The contrast effects of these two contrast agents were assumed to be comparable10).
Image Analysis
All MRI images were assessed by two radiologists, ADC values measured by two radiologists were averaged (T.S., M.M.: 10 and 8 years’ experience, respectively). Inter-rater agreement was assessed on the basis of differences in the correlation analysis.
PSP PACS® was used for assessment. An observer (K.K.: 4 years’ experience in radiology) was aware of only the tumor location, which was checked against TUR findings. All sex, age, and other patient information were masked. The radiologists evaluated the images without any access to clinical information such as cystoscopic findings and final diagnosis.
The lowest ADC obtained by visually and manually drawing the region of interest with a free curve drawing tool associated with PSP PACS® was used (Figure 1). In order to ensure that the region of interest was placed in a tumor, a T2-weighted axial image and a fat-suppressed, dynamic T1-weighted axial image were aligned with each other.
Fig. 1.
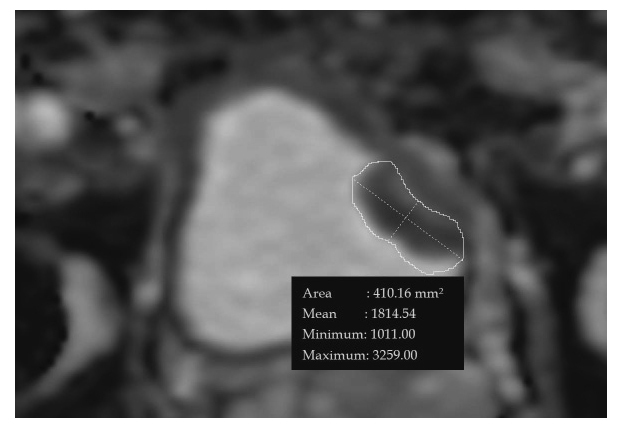
ADC map reconstructed in a 77-year old male with bladder cancer in the left bladder wall. The lowest ADC value is 1.011×10⁻³ mm2/sec.
*ADC=apparent diffusion coefficient
Pathological Assessment
Pathological assessment was handled by a pathologist (Y. H.: 21 years’ experience in histopathological diagnosis). Three classifications of histological grade were used: G1, low grade; G2, intermediate grade; and G3, high grade. The number of tumors per patients, the location of each tumor, and the tumor diameter were comprehensively assessed by checking consistency between the final pathological diagnosis, TUR findings, and MRI findings.
EAU score
EAU score is risk score for predicting recurrence and progression in individual patients with non-muscle-invasive bladder cancer (Table 1).
Table 1.
EAU scores for recurrence/progression and number of patients
| Factor | Recurrence score (points) |
Progression score (points) |
Number of patients | |
| Number of tumors | Single | 0 | 0 | 16 |
| 2 to 7 | 3 | 3 | 25 | |
| 8 or more | 6 | 3 | 0 | |
| Longest diameter | <3 cm | 0 | 0 | 38 |
| ≥ 3 cm | 3 | 3 | 3 | |
| Recurrence history | Initial | 0 | 0 | 41 |
| ≤1 recurrence/year |
2 | 2 | 0 | |
| >1 reccurence/year |
4 | 2 | 0 | |
| T factor | Ta | 0 | 0 | 19 |
| T1 | 1 | 4 | 22 | |
| Concurrent carcinoma in situ | No | 0 | 0 | 35 |
| Yes | 1 | 6 | 6 | |
| Grade | G1 | 0 | 0 | 4 |
| G2 | 1 | 0 | 15 | |
| G3 | 2 | 5 | 22 |
*EAU European Association of Urology
In the risk classification according to the EAU Guideline2) , the recurrence score and progression score were determined on the basis of the six factors: number of tumors, tumor diameter, history of recurrence, T factor, presence or absence of concurrent carcinoma in situ, and histological grade of tumor.
In Risk classification by EAU guidelines, about each factor of the above 6 items, the scores for the two categories of “reccurrence score” and “progression score” are defined. Two risk groups is determined by the total score of each (Table 2).
Table 2.
Risk classification based on total score of EAU
| Recurrence score | Recurrence risk group |
| 0 | Low risk |
| 1-9 | Intermediate risk |
| 10-17 | High risk |
| Progression score | Progression risk group |
| 0 | Low risk |
| 2-6 | Intermediate risk |
| 7-23 | High risk |
Patients were classified as being at low, intermediate, or high risk for recurrence or progression. Specifically, a recurrence score of 0 indicates a low risk for recurrence, a score of 1 to 9 indicates intermediate risk, and a score of 10 to 17 indicates high risk. A progression score of 0 indicates low risk for progression, a score of 2 to 6 indicates intermediate risk, and a score of 7 to 23 indicates high risk.
In the target patient group, the mean±standard deviation reccurrence score was±1.028±0.249, the mean±standard deviation progression score was 1.028±0.249.
Forrow Up
We followed the patient’s actual reccurrence and progression for approximately 60 months after TUR-BT.
Statistical Analysis
The correlations between ADC and the histological grade of tumor (G1, G2, G3) were similarly analyzed by Pearson’s correlation analysis, and the regression formula was calculated by linear regression analysis when a significant correlation was found.
The normality of ADC values and of the recurrence/progression scores of each patient was analyzed using the Kolmogorov and Smirnov test. ADC consistency was analyzed based on the difference on Pearson’s correlation analysis.
The correlations between ADC and the recurrence score and between ADC and the progression score were similarly analyzed by Pearson’s correlation analysis, and the regression formula was calculated by linear regression analysis when a significant correlation was found.
The correlation between recurrence or progression risk group and ADC was also analyzed by Pearson’s correlation analysis, and an ROC curve was used to establish the optimal cut-off value between risk groups (between low/intermediate risk groups and between intermediate/high risk groups) when a significant correlation was found.
In patients with multiple tumors, the lowest ADC value was used as the representative value in each case for comparative analyses between ADC and recurrence score, progression score, recurrence risk group, or progression risk group.
And we investigated whether there is a significant difference between each two groups using the Unpaired t-test about the ADC value of the group which was reccurence after TUR and the group which was not recurrence. We also investigated whether there is a significant difference between each two groups using the Unpaired t-test about the ADC value of the group which was progression after TUR and the group which was not progression.
In all comparative analyses, a P value less than 0.05 with two-sided tests was considered significant. Statistical analysis was performed using the SPSS program for normality tests and ROC analysis, and the ystat program for correlation analysis.
Results
The results indicated good inter-rater ADC consistency (confidence coefficient r=0.978; mean±standard deviation for difference: -0.010±0.056×10⁻³ mm2/sec).
It was concluded that ADC values, recurrence scores, and progression scores appeared to be normally distributed (P=0.2, P=0.67, P=0.2). The mean±standard deviation ADC was 1.028±0.249×10⁻³ mm2/sec.
On analysis of ADC by histological grade of bladder cancer, the mean±standard deviation ADC was 1.323±0.146×10⁻³ mm2/sec for the G1 group consisting of 10 lesions (8%), 1.134±0.138×10⁻³ mm2/sec for the G2 group consisting of 59 lesions (50%), and 0.879±0.199×10⁻³ mm2/sec for the G3 group consisting of 50 lesions (42%). ADC values showed a significant correlation with the the histological grade group (P<0.001), with a correlation coefficient r=0.664 and a contribution ratio R2=0.44.
ROC analysis was used to determine the cut-off values for differentiating between G1 and G2 groups and between G2 and G3 groups. The following cut-off values were determined based on combining sensitivity and specificity: between G1 and G2 group, ADC 1.213×10⁻³ mm2/sec (sensitivity: 80%; specificity: 76.2%); between G2 and G3 group, ADC 0.997×10⁻³ mm2/sec (sensitivity: 91.5%; specificity: 82.0%) (Figure 2).
Fig. 2.
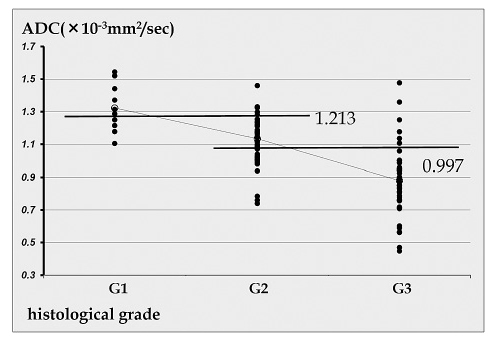
Scatter plot showing the correlation between the histological grade of bladder cancer and ADC
ADC values showed a significant correlation with the recurrence score (P<0.001), with a correlation coefficient r=0.597 and a contribution ratio R2=0.36 (Figure 3A). ADC values also showed a significant correlation with the progression score (P<0.001), with a correlation coefficient r=0.683 and a contribution ratio R2=0.47 (Figure 3B).
Fig. 3.
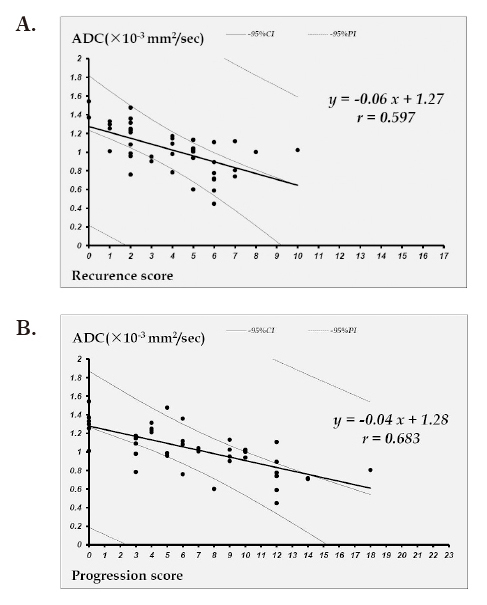
A: Linear regression curve of the correlation between ADC and the recurrence score
B: Linear regression curve of the correlation between ADC and the progression score
On analysis of ADC values for recurrence risk groups classified on the basis of the EAU score, the mean±standard deviation ADC was 1.458±0.122×10⁻³ mm2/sec for the low risk group consisting of 2 lesions (5%), 1.005±0.237×10⁻³ mm2/sec for the intermediate risk group consisting of 38 lesions (93%), and 1.023×10⁻³ mm2/sec for the high risk group consisting of 1 lesion (2%).
On analysis of the progression risk groups classified on the basis of the EAU score, the mean±standard deviation ADC was 1.301±0.174×10⁻³ mm2/sec for the low risk group consisting of 6 lesions (15%), 1.120±0.195×10⁻³ mm2/sec for the intermediate risk group consisting of 16 lesions (39%), and 0.864±0.191×10⁻³ mm2/sec for the high risk group consisting of 19 lesions (46%).
ADC values showed a significant correlation with the recurrence risk group (P=0.042), with a correlation coefficient r=0.318 and a contribution ratio R2=0.1 (Figure 4A). ADC values also showed a significant correlation with the progression risk group (P<0.001), with a correlation coefficient r=0.662 and a contribution ratio R2=0.44 (Figure 4B).
Fig. 4.
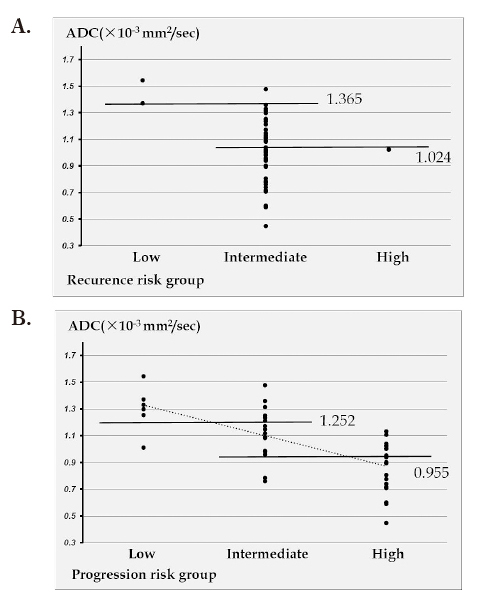
A: Scatter plot showing the correlation between the recurrence risk group and ADC
B: Scatter plot showing the correlation between the progression risk group and ADC
ROC analysis was used to determine the cut-off values for differentiating between low and intermediate risk groups and between intermediate and high risk groups for recurrence or progression (Figures 5A-D). The following cut-off values were determined based on combining sensitivity and specificity: between low and intermediate risk for recurrence, ADC 1.365×10⁻³ mm2/sec (sensitivity: 100%; specificity: 97.4%); between intermediate and high risk for recurrence, ADC 1.024×10⁻³ mm2/sec (sensitivity: 47.4%; specificity: 100%); between low and intermediate risk for progression, ADC 1.252×10⁻³ mm2/sec (sensitivity: 83.3%; specificity: 81.3%); and between intermediate and high risk for progression, ADC 0.955×10⁻³ mm2/sec (sensitivity: 87.5%; specificity: 63.2%) (Table 3; Values in parentheses indicate relevant number/total number.).
Fig. 5.
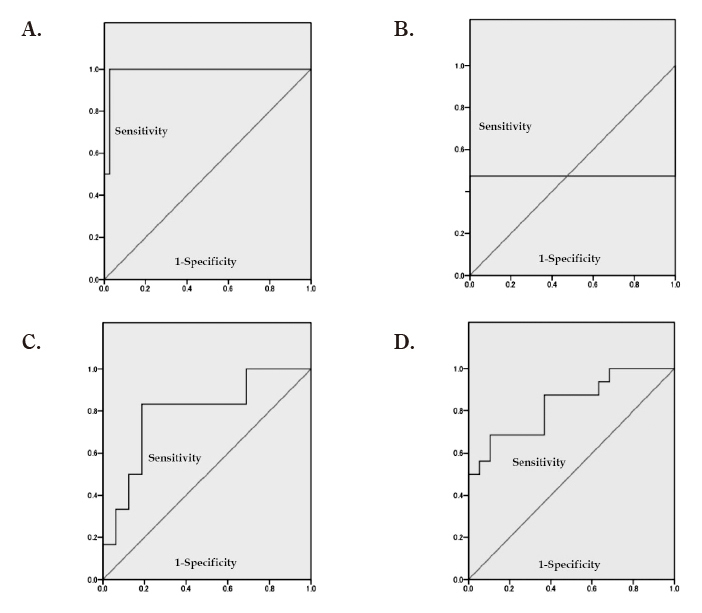
A: ROC curve for distinguishing between the low and intermediate recurrence risk groups based on ADC
B: ROC curve for distinguishing between the intermediate and high recurrence risk groups based on ADC
C: ROC curve for distinguishing between the low and intermediate progression risk groups based on ADC
D: ROC curve for distinguishing between the intermediate and high progression risk groups based on ADC
*ROC=receiver operating characteristic
Table 3.
ADC cut-off value for distinguishuing between recurrence/progression risk groups determined on the basis of ROC curve analysis
| (Low/inter. recurrence risk) |
(Inter./high recurrence risk) |
(Low/inter. Progression risk) |
(Inter./high Progression risk) |
|
| Cut-off value | ≤1.365 | ≤1.024 | ≤1.252 | ≤0.955 |
| Sensitivity (%) | 100.0 ( 2/ 2) | 47.4 (18/38) | 83.3 ( 5/ 6) | 87.5 (14/16) |
| Specificity (%) | 97.4 (37/38) | 100.0 ( 1/ 1) | 81.3 (13/ 6) | 63.2 (12/19) |
| Positive response predictive value (%) | 66.7 ( 2/ 3) | 100.0 (18/18) | 62.5 ( 5/ 8) | 66.7 (14/21) |
| Negative response predictive value (%) | 100.0 (37/37) | 4.8 ( 1/21) | 92.9 (13/14) | 85.7 (12/14) |
| Accuracy (%) | 97.5 (39/40) | 48.7 (19/21) | 90.0 (18/20) | 74.3 (26/35) |
Two patients were excluded from the analysis of the correlation between ADC and actual recurrence and actual progression, because they underwent early total cystectomy for reasons other than muscle invasion of bladder cancer (because multiple bladder cancers are found and are at high risk of recurrence and progression).
Recurrence was observed in 16 cases out of 39 cases observed. The mean±standard deviation period until recurrence was 14.94 ±16.27 months.
Progression was observed in 11 cases out of 39 cases observed. The mean±standard deviation period until progression was 15.63 ±19.14 months.
The ADC value of the no recurrence group was 1.098±0.27×10⁻³ mm2/sec. The ADC value of the recurrence group was 0.94±0.20×10⁻³ mm2/sec (Figure 6A).
Fig. 6.
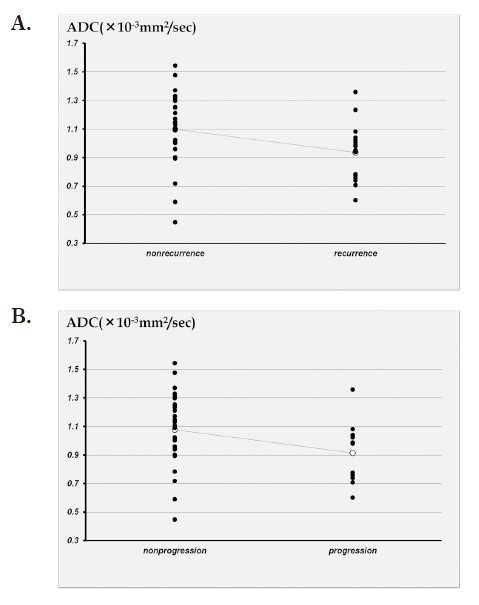
A: Scatter plot showing the correlation between the actual reccurence of bladder cancer and ADC.
B: Scatter plot showing the correlation between the actual progression of bladder cancer and ADC.
The ADC value of the no progression group was 1.077±0.25× 10⁻³ mm2/sec. The ADC value of the progression group was 0.91±0.22×10⁻³ mm2/sec (Figure 6B).
The difference between recurrence and nonrecurrence group in Unpaired t test was significant (P<0.05).
The difference between progression and nonprogression group in Unpaired t test was no significant (P=0.068).
Discussion
The current study clearly shows inverse correlations of ADC value not only with histological grade but also with T stage in bladder cancer. Takeuchi et al. have demonstrated the correlation of ADC value with histological grade and staging accuracy of DW-MRI as an anatomical image in combination with T2WI MRI8). However, no objective and quantitative biomarker, in predicting the recurrence and progression of bladder cancer. The present study is the first to examine the correlation between ADC values on MRI for bladder cancer and the scoring system based on clinical and pathological measures for assessing post-TUR risk for recurrence or progression in patients with non-muscle-invasive cancer in the EAU guidelines.
Tracer uptake in PET/CT could also be evaluated as an indicator of the aggressiveness of malignancies11). For bladder cancer, [18F]fluorodeoxyglucose (FDG)-PET/CT predicts survival of MIBC patients by detecting occult metastases in clinically localised by detecting occult metastases in clinically localised MIBC12). However, measuring the standard uptake value of MIBC at a primary site is difficult due to the intense accumulation of excreted FDG in urine13,14). In this respect, DWI-MRI offers more advantages as a means of obtaining quantitative information on primary sites of bladder cancer.
Zhao et al.15) used cultured cells, and reported that Cell membrane limits water diffusion. It is considered that cell membrane stiffness limits water diffusion and the density of the cell membrane increases in high cell density tumor. In addition, Water diffusion is suppressed in cells with large nuclear/cytoplasm ratio. Among the above, cell density is considered to particularly affect the decrease of ADC15-18). There is a correlation between histological grade and ADC in prostate cancer and glioma. In these tumors, histological grade is mainly determined by cell density. Considering the above theory it seems reasonable. Similarly, it has been reported that the higher the grade, the higher the cell density and the lower the ADC value in bladder cancer8,11).
However, in bladder cancer, the histrogical grade is determined by disappearance of surface cell, disturbance of the differentiation tendency from the basement membrane to the surface layer, disturbance of nuclear polarity, disturbance of nuclear distribution density, disappearance of cell maturation tendency, urothelial thickness, increase of cell density, nucleus enrichment, polymorphism, uneven cell size, diverse shape, nuclear chromatin properties, abnormal nuclear fission, appearance of giant cells etc...
Therefore, the rise in histological grade does not necessarily reflect an increase in cell density.
About this problem, Gauvain et al.16) reported correlation between ADC value and cell density in pediatric brain tumor. They reported that medulloblastoma with a low ADC value was observed despite the low cell density, in this medulloblastoma, the nuclear / cytoplasm ratio was high. A similar phenomenon is reported by Garcia-Perez et al.19).
It is assumed that the reduction of ADC is not a phenomenon reflecting only simple cell density but actually consists of a combination of multiple phenomena. The cause of ADC decrease is thought to include such complex elements also in bladder cancer.
A significant correlation between ADC and the histologal grade of several tumors (prostate cancer, renal cell carcinoma, brain astrocytoma etc...), T factor has been reported in several past studies7,23,25,26). In these studies, it has been reported that lower ADC values are seen when tumor grade or T factor is higher.
In bladder cancer, as well as the correlation between ADC values and recurrence/progression risk group classified on the basis of that scoring system. Attempts have been made to estimate the incidence of recurrence/progression, which can now be automatically calculated for 1 to 5 years following TUR based on the score. This system was created based on data collected in seven trials conducted by European researchers2). For non-muscle-invasive bladder cancer, treatment options are recommended depending on the extent of risk based on this score. A single infusion of immediate intravesical anti-cancer agent following TUR is recommended for low recurrence or progression risk groups, immediate intravesical anti-cancer agent infusion and adjuvant anti-cancer agent infusion or intravesical bacille Calmette-Guerin (BCG) are recommended for intermediate to high recurrence and intermediate progression risk groups, and intravesical BCG or total cystectomy is recommended for the high progression risk group.
Assessment of the two predictors of recurrence and progression should thus be considered separately, and it appears that the study of how tumor characteristics on MRI are related to these predictors could be important.
Hafner et al.11) reported that one or a small number of genetic characteristics is involved in frequent bladder cancer recurrence following TUR. This means that multiple tumors tend to originate from the same source. In other words, a potential mechanism of recurrence may involve the subsequent proliferation and appearance of tumor cells disseminated in the normal bladder wall prior to TUR or intra-operatively. Other mechanisms of recurrence have also been considered, such as the possibility that precancerous lesions (cells that are not normal but that have not yet become cancerous) that are already present but not yet visible around tumors or in other locations remain without being removed, and they subsequently develop into tumors after the occurrence of a genetic mutation. Whatever the mechanism, when there are multiple tumors, higher grade lesions increase the risk of recurrence or progression to muscle-invasive cancer. In the present study, ADC values from diffusion-weighted images, for which a correlation to grade has recently been noted in various fields as a characteristic of tumors on MRI, were analyzed. In cases with more than one tumor, the tumor with the lowest ADC value was used. Although it is believed that ADC values are lower in tumors of higher cell density, it has been reported that, in bladder cancer, as in tumors in other locations, cell density increases and ADC values fall in higher grade tumors8,12). Various studies in the past have reported that ADC values are significantly correlated with histological grade and T factor4,7,14,15). In those studies, it was reported that increases in grade and T factor were associated with lower ADC values. Funatsu et al.27) also reported a correlation between ADC values and recurrence following TUR; the ADC was significantly lower in the recurrence group. Because tumor grade and T factor are elements forming the system for scoring recurrence and progression following TUR, it was surmised that the ADC, which appeared to be correlated to them, could potentially have a certain correlation to the score, beyond just a correlation to histological grade.
In the present study, there were significant correlations between the recurrence/progression scores and ADC values, as well as between the recurrence/progression risk groups and ADC values. ADC values on MRI prior to TUR could potentially serve as a useful measure for estimating recurrence/progression scores in primary bladder cancer. ADC values may also be useful to a certain extent in distinguishing recurrence/progression risk groups, and it appeared that this in itself could serve as an independent prognosticator for recurrence/progression. In this regard, it will be necessary to study whether the ADC is an independent predictor, but the present results suggest that evaluation of ADC values in combination with the system for scoring recurrence and progression may permit more accurate stratification of the risk for recurrence or progression and could help in deciding on treatment strategies. The ADC is also a non-invasive measure that can be obtained on MRI and appears to be a potentially useful measure for generally estimating recurrence/progression scores using the current results of linear regression analysis as a non-invasive way to assess the risks of recurrence and progression in the future. Furthermore, there was a significant difference between the presence or absence of actual recurrence and the ADC. This suggests that ADC may be an indicator of recurrence after TUR of non-muscle-invasive cancers. However, there was no significant difference between the presence or absence of actual progression and the ADC (P=0.068). About this, we thought that the number of small cases is one cause. Re-research with more cases is expected.
In addition, in this study, there were cases in which the ADC value was remarkably low even in the group without actual recurrence or progression.
About this, we considered the possibility that ADC would show significantly lower values if necrosis or abscess formation occurred inside the cancer. In the next study, we considered that more detailed pathology confirmation of bladder cancer is necessary for this point.
The present study has a few limitations. First of all, it was a retrospective study. Second, only cases of initial bladder cancer were studied, and the study data were thus collected in a limited population. The EAU score is originally a scoring system for populations that not only include initial cancer but that also include recurrent non-muscle-invasive cancers. The population in the present study did not include recurrent cases, resulting in a study population in which the recurrence score was assumed to be negative 2 or 4 points and the progression score was assumed to be negative 4 points.
A third limitation is that quantitative assessment of diffusion-weighted images and ADC values is not very prevalent in medical facilities today. A fourth limitation is that ADC values are calculated on the basis of only two b values; more accurate evaluation requires confirmation with more b values.
Conclusions
In cases of initial non-muscle-invasive bladder cancer, ADC values were significantly correlated to recurrence/progression scores following TUR and to risk groups classified on the basis of these scores, and ADC values could potentially be useful as a measurement for the non-invasive estimation of such scores and for the prediction of the risks for recurrence and progression to muscle-invasive cancer.
Acknowledgments
My heartfelt appreciation goes to Assoc. prof. Aya Goto who provided carefully considered feedback in the statistical methods of this study and valuable comments in. Special thanks also go to Prof. Hiroyuki Yaginuma who gave me invaluable comments and warm encouragements.
Conflict of interest statement
The authors declare no conflict of interest.
References
- 1.Ferlay J, Steliarova-Foucher E, Lortet-Tieulent J, et al. Cancer incidence and mortality pattern in Europe: Estimates for 40 countries in 2012. Eur J Cancer, 49: 1374-1403, 2013. [DOI] [PubMed] [Google Scholar]
- 2.Sylvester RJ, van der Meijden APM, Oosterlinck W, et al. Predicting Recurrence and Progression in Individual Patients with Stage Ta T1 Bladder Cancer Using EORTC Risk Tables: A Combined Analysis of 2596 Patients from Seven EORTC Trials. Eur Urol, 49: 466-477, 2006. [DOI] [PubMed] [Google Scholar]
- 3.Matsuki M, Inada Y, Tatshgami F, Tanikake M, Narabayashi I & Katsuoka Y. Diffusion-weighted MR imaging for urinary bladder carcinoma: initial results. Eur Radiol, 17: 201-204, 2007. [DOI] [PubMed] [Google Scholar]
- 4.El-Assmy A, Abou-El-Ghar ME, Mosbah A, et al. Bladder tumor staging: comparison of diffusion- and T2-weighted MR imaging. Eur Radiol, 19: 1575-1581, 2009. [DOI] [PubMed] [Google Scholar]
- 5.El-Assmy A, Abou-El-Ghar ME, Refaie HF, Mosbah A & El-Diasty T. Diffusion-weighted magnetic resonance imaging in follow-up of superficial urinary bladder carcinoma after transurethral resection: initial experience. BJUI, 110: E622-E627, 2012. [DOI] [PubMed] [Google Scholar]
- 6.El-Assmy A, Abou-El-Ghar ME, Refaie HF, Mosbah A & El-Diasty T. Diffusion-Weighted MR Imaging in Diagnosis of Superficial and Invasive Urinary Bladder Carcinoma: A Preliminary Prospective Study. The Scientific World Journal, 8: 364-370, 2008. [DOI] [PMC free article] [PubMed] [Google Scholar]
- 7.Yoshimitsu K, Kiyoshima K, Irie H, et al. Usefulness of Apparent Diffusion Coefficient Map in Diagnosing Prostate Carcinoma: Correlation with Stepwise Histopathology. JMRI, 27: 132-139, 2008. [DOI] [PubMed] [Google Scholar]
- 8.Takeuchi M, Sasaki S, Ito M, et al. Urinary Bladder Cancer: Diffusion-weighted MR Imaging—Accuracy for Diagnosing T Stage and Estimating Histologic Grade. Radiology, 51: 112-121, 2009. [DOI] [PubMed] [Google Scholar]
- 9.Babjuk M, Oosterlinck W, Sylvester R, et al. EAU Guidelines on Non-Muscle-Invasive Urothelial Carcinoma of the Bladder, the 2011 Update. Eur Urol, 59: 997-1008, 2011. [DOI] [PubMed] [Google Scholar]
- 10.Tweedle MF. Physicochemical Properties of Gadoteridol and Other Magnetic Resonance Contrast Agents. Investigative Radiology, 27: S2-S6, 1992. [PubMed] [Google Scholar]
- 11.Alavi A, Lakhani P, Mavi A, Kung JW & Zhuang H. PET: a revolution in medical imaging. Radiol Clin North Am, 42: 983-1001, 2004 [DOI] [PubMed] [Google Scholar]
- 12.kibei AS, Dehdashti F, Katz MD, et al. Prospective study of [18F]fluorodeoxyglucose positron emission tomography/computedtomography for staging of muscle-invasive bladder carcinoma. J Clin Oncol, 27: 4314-4320, 2009. [DOI] [PMC free article] [PubMed] [Google Scholar]
- 13.Jadver H, Quan V, Henderson RW, Conti PS. [F-18]Fluorodeoxyglucose PET and PET-CT in diagnostic imaging evaluation of locally recurrent and metastatic bladder transitional cell carcinoma. Int J Clin Oncol, 13: 42-47, 2008. [DOI] [PMC free article] [PubMed] [Google Scholar]
- 14.Drieskens O, Oyen R, Van Poppel H, Vankan Y, Flamen P & Mortelmans L. FDG-PET for preoperative staging of bladder cancer. Eur J Nucl Med Mol Imaging, 32: 1412-1417, 2005. [DOI] [PubMed] [Google Scholar]
- 15.Zhao L, Sukstanskii AL, Kroenke CD, et al. Interacellular water specific MR of microbread-adherent cells: Hela cell intracellular water diffusion. Magn Reson Med, 59: 79-84, 2008. [DOI] [PMC free article] [PubMed] [Google Scholar]
- 16.Gauvain KM, McKinstry RC, Mukherjee P et al. Evaluating pediatric brain tumor cellularity with diffusion-tensor imaging, 177: 449-454, 2001. [DOI] [PubMed] [Google Scholar]
- 17.Guo AC, Cummings TJ, Dash RC, Provenzale JM. Lumphomas and high-grade astrocytomas: comparison of water diffusibility and histologic characteristics. Radiology, 224: 177-183, 2002. [DOI] [PubMed] [Google Scholar]
- 18.Kof DM, Collins DJ. Diffusion-weighted MRI in the body: applications and challenges in oncology. Am J Roentgenol, 188: 1622-1635, 2007 [DOI] [PubMed] [Google Scholar]
- 19.Garcia-Perez AI, Lopez-Beltran EA, Kluner P, et al. Molecular crowding and viscosity as determinants of translational diffusion of metabolites in subcellular organelles. Arch biochem biophys, 362: 329-338, 1999. [DOI] [PubMed] [Google Scholar]
- 20.Hafner C, Knuechel R, Stoehr R, Hartmann A. Clonality of Multifocal Urothelial Carcinomas: 10 Years of Molecular Genetic Studies. Int J Cancer, 101: 1-6, 2002. [DOI] [PubMed] [Google Scholar]
- 21.Kobayashi S, Koga F, Yoshida S, et al. Diagnostic performance of diffusion-weighted magnetic resonance imaging in bladder cancer: potential utility of apparent diffusion coefficient values as a biomarker to predict clinical aggressiveness. Eur Radiol, 21: 2178-2186, 2011. [DOI] [PubMed] [Google Scholar]
- 22.Rosenkrantz AB, Niver EN, Fitzgerald EF, Babb JS, Chandarana H & Melamed J. Utility of the Apparent Diffusion Coefficient for Distinguishing Clear Cell Renal Cell Carcinoma of Low and High Nuclear Grade. Am J Roentgenol, 195: W344-W351, 2010. [DOI] [PubMed] [Google Scholar]
- 23.Manenti G, Roma DM, Mancino S, et al. Malignant renal neoplasms: correlation between ADC values and cellularity in diffusion weighted magnetic resonance imaging at 3T. Radiol Med, 113: 199-213, 2008. [DOI] [PubMed] [Google Scholar]
- 24.Daggulli M, Onur MR, Firdolas F, Onur R, Kocaloc E & Orhan I. Role of Diffusion MRI and Apparent Diffusion Coefficient Measurement in the Diagnosis, Staging and Pathological Classification of Bladder Tumors. Urol Int, 87: 346-352, 2011. [DOI] [PubMed] [Google Scholar]
- 25.Higano S, Ynn X, Kumabe T, et al. Malignant astrocytic tumors: clinical importance of apparent diffusion coefficient in prediction of grade and prognosis. Radiology, 241: 839-846, 2006. [DOI] [PubMed] [Google Scholar]
- 26.Murakami R, Sugahara T, Nakamura H, et al. Malignant supra-tentorial astrocytoma treated with postoperative radiation therapy: prognostic value of pretreatment quantitative diffusion weighted MR imaging. Radiology, 243: 493-499, 2007. [DOI] [PubMed] [Google Scholar]
- 27.Funatsu H, Imamura A, Takano H, Ueda T & Uno T. Can pretreatment ADC values predict recurrence of bladder cancer after transurethral resection ? Eur J Radiol, 81: 3115-3119, 2012. [DOI] [PubMed] [Google Scholar]


