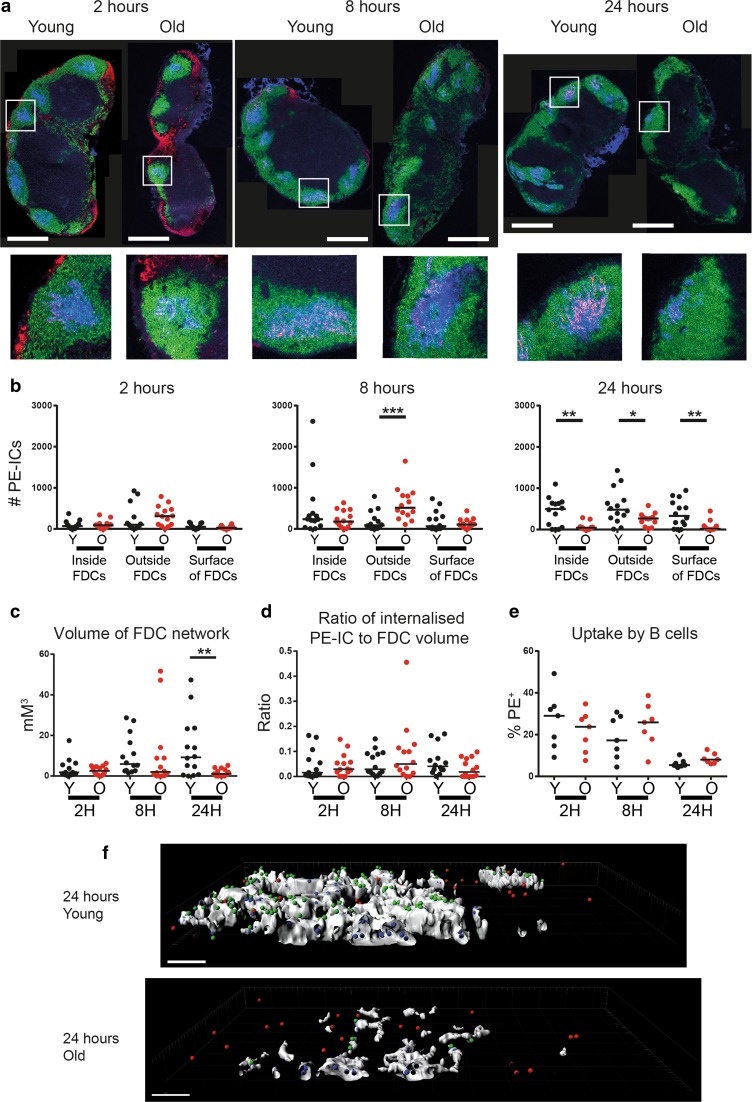
Fig. 4.
Decreased FDC size impairs immune complex uptake. Young and aged mice were given polyclonal anti-phycoerythrin intraperitoneally 16 h before phycoerytherin was given subcutaneously into each side of the flank, as adapted from a previously published protocol (Phan et al. 2007). Mice were culled 2, 8 and 24 h after phycoerytherin injection and inguinal LN collected for immunostaining. This allowed tracking of phycoerytherin immune complexes (PE-ICs) from their uptake by SCSM, their transference onto B cells, and through to deposition onto FDCs. a Immunofluorescent staining of LN from young and aged mice 2, 8 and 24 h post-injection displays PE-ICs (red), B cells (B220+ green) and FDCs (CD35+ blue) and shows decreased PE-IC localisation to the FDC region at 24 h. Scale bars represent 500 µM. b There is a decrease number of PE-ICs inside, on the surface and more than 1 µM away from the surface (outside) of FDCs in aged lymph nodes when compared to young lymph nodes at 24 h, as determined via Imaris analysis of z-stack immunostaining. c Total volume of FDC networks in the z-stacks imaged at the time points indicated in young and aged mice as determined by Imaris analysis. d The ratio of PE-IC complexes inside the FDCs to the FDC volume at the time points indicated shows no difference between young and aged mice. This demonstrates that the decreased FDC volume in aged lymph nodes impedes PE-IC uptake. e There was no difference in the uptake of immune complexes between young and old B cells at the time points studied, as determined via flow cytometry. f Cross-section representative images of z-stacks post-imaris analysis are shown for young and old mice at 24 h. FDC networks are shown in white. PE-IC complexes inside the FDC network are in blue, outside the FDC network in red and on the surface of FDC in green. Scale bars represent 10 µM. Results were analysed via Mann–Whitney U test and are pooled from two separate experiments, totalling seven mice per group. P < 0 0.001 = ***, P < 0.01 = **, P < 0.05 = *. Features of this figure are reproduced from (Turner and Mabbott 2017b) under the terms of the CC-BY-NC Creative Commons Attribution Licence 4.0 (Turner and Mabbott 2017b)

