

Abstract
Wild giant pandas use different parts of bamboo (shoots, leaves and stems) and different bamboo species at different times of the year. Their usage of bamboo can be classified temporally into a distinct leaf stage, shoot stage and transition stage. An association between this usage pattern and variation in the giant panda gut microbiome remains unknown. Here, we found associations using a gut metagenomic approach and nutritional analyses whereby diversity of the gut microbial community in the leaf and shoot stages was significantly different. Functional metagenomic analysis showed that in the leaf stage, bacteria species over-represented genes involved in raw fibre utilization and cell cycle control. Thus, raw fibre utilization by the gut microbiome was guaranteed during the nutrient-deficient leaf stage by reinforcing gut microbiome robustness. During the protein-abundant shoot stage, the functional capacity of the gut microbiome expanded to include prokaryotic secretion and signal transduction activity, suggesting active interactions between the gut microbiome and host. These results illustrate that seasonal nutrient variation in wild giant pandas substantially influences gut microbiome composition and function. Nutritional interactions between gut microbiomes and hosts appear to be complex and further work is needed.
Keywords: nutrition utilization, gut microbiome, giant panda
1. Introduction
It has long been known that the animal alimentary canal is colonized by microbial flora. This kind of colonization, or symbiosis, is essential to the host and microbiota [1]. In the past decade, an explosion in metagenomic techniques has enabled us to explore the complicated microbiota inhabiting micro-environments within the gastrointestinal tract [2–4]. Evidence has accumulated to show the gut microbiome is critical in disease, nutrition, immune responses and development of the host [5,6]. In humans, the temporal dynamics of gut microbiomes observed are strongly influenced by changes in dietary intake [7,8]. In wild animals, reproducible dietary changes represent a kind of seasonal dietary shift and these also influence the gut microbiome composition. Some early investigations in wild black howler monkeys (Alouatta pigra) found that temporal changes in the relative abundance of individual bacterial taxa were strongly correlated with changes in host diet [9]. Similar results were obtained for wild wood mice (Apodemus sylvaticus) [10] and free-ranging Tibetan macaques (Macaca thibetana) [11]. Research has also attempted to introduce metabolome approaches to understand relationships between diet and gut microbiome function in lowland and mountain gorillas (Gorilla spp.) [12].
The giant panda (Ailuropoda melanoleuca) is a specialized bamboo-eating animal in the order Carnivora [13]. Giant pandas forage on different bamboo species and different parts of the bamboo plant in different seasons [13,14]. For example, in Wolong Nature Reserve, Sichuan, giant pandas forage on new shoots of arrow bamboo (Fargesia spathacea) from April to June, bamboo leaves from July to October, and old shoots, stems and leaves from November to March [14]; a similar pattern has been recorded in Changqing Nature Reserve, Shaanxi [15]. Studies on bamboo nutrition, energy utilization and ingestion have been conducted since the 1980s and show that protein, fat, sugar and fibre vary significantly in different bamboo parts [16,17]. Recent metagenomic research revealed that the gut microbiome contributed to the digestion of fibre in giant pandas [18,19]. However, it remains unknown whether seasonal variation in bamboo diet shapes nutritional utilization via alterations in the structure and function of gut microbiomes in wild giant pandas. To address this, we examined seasonal nutritional variation in bamboo diets and changes in gut microbiomes in wild giant pandas in the Qinling Mountains.
2. Material and methods
(a). Faecal sample collection
Our research was conducted in Foping Nature Reserve, Qinling Mountains where we have monitored seven GPS-collared wild giant pandas for over 10 years [20] (figure 1a). Faecal samples were collected by tracking GPS-collared giant pandas in 2012 and 2013. To ensure sample quality for metagenome sequencing, we tracked collared animals so that fresh faeces could be collected. Faeces were collected immediately after defaecation snap-frozen in liquid nitrogen and shipped to the laboratory on dry ice. Faecal surfaces in contact with soil were excluded. Based on feeding behaviour and diet, three forage stages were identified: a leaf stage, shoot stage and transition stage. The leaf stage was September to April when giant pandas eat Bashania fargesii (abbreviated as Bfa hereafter) leaves; the shoot stage was from May to July when pandas eat Bfa shoots and Fargesia qinlingensis (abbreviated as Fqi hereafter) shoots; and the transition stage was from August when they eat Fqi leaves mixed with Bfa leaves.
Figure 1.

Sampling of fresh faeces from giant pandas and nutritional analyses of bamboo. (a) The location of Sanguanmiao, Foping National Reserve, China is emphasized with a black curve, where samples were collected. (b) Partition of three stages and four food categories during 1 year. Above the time line is the four food categories. Below the time line is the three stages, in which the leaf, shoot and transition stages are shown in green, orange and grey, respectively. (c) Contents of five nutrients in the three stages. The colours of the stages are the same as in (b). Significantly high differences in content are indicated with asterisks between stages, where *p < 0.05, **p < 0.01 and ***p < 0.001.
(b). Bamboo sample collection and nutritional analyses
Fresh bamboo samples were collected in the same reserve from 2012 to 2013. Samples were dried at 70°C, ground and then stored in 4°C for further analysis. The wet and dry weights were measured before and after dry treatment to obtain water content. Protein content was obtained using the Kjeldah method [21]. Raw fat content was measured using Soxlhet extraction [22]. The Van Soest washing method was used to measure raw fibre content, including cellulose, semi-cellulose and lignin [23]. Soluble sugar content was measured using anthrone colorimetry [24].
(c). DNA extraction and 16S rRNA-targeted metagenomic sequencing
DNA was extracted from faecal samples using the Qiagen QIAamp DNA Stool Mini Kit according to the protocol for isolation of DNA for pathogen detection. DNA was eluted in a final volume of 250 µl using elution buffer and then stored at −20°C.
DNA pyrosequencing was performed at MajorBio Tech (Shanghai, China) via the 454 Life Sciences/Roche GS FLX Titanium platform. The V1–V3 region of the bacterial 16S ribosomal RNA gene was amplified using TransStart Fastpfu DNA Polymerase and the following primers: 27F 5′-AGAGTTTGATCCTGGCTCAG-3′ and 533R 5′-ATTACCGCGGCTGCTGGCA-3′. The 30-μl PCR reactions were prepared with a 20 µl mixture containing 4 µl of 5 × FastPfu Buffer, 2 µl of 2.5 mM dNTPs, 0.8 µl of each primer (5 µM), 0.4 µl of FastPfu Polymerase and 10 ng of template DNA. PCR cycles included 95°C for 2 min, followed by 25 cycles at 95°C for 30 s, 55°C for 30 s and 72°C for 30 s and a final extension step at 72°C for 5 min. Following purification (AxyPrep DNA Gel Extraction Kit, Axygen Biosciences, Union City, CA, USA) and quantification (QuantiFluor™-ST, Promega, USA), amplicon mixtures were sequenced by pyrosequencing using the 454 platform according to standard protocols.
Sequencing reads were processed and analysed using the standalone platforms Usearch (v. 8.1) and QIIME (v. 1.9.1). Low-quality reads and reads lower than 200 bp, singleton and chimaera, were filtered with the Usearch/UCHIME program in Usearch. Clean reads were then used to assign an operational taxonomic unit (OTU) at a similarity cut-off value of 97% [18] using the UCLUST program in Usearch. The OTU rarefaction curve, OTU network, principal coordinates analysis (PCoA) and neighbour joining (NJ) phylogenetic tree were generated using QIIME. LEfSe analyses were used to identify statistically different gut microbial features between groups [25].
(d). Metagenomic shotgun sequencing
Sequencing and general data analyses were performed by Shanghai Majorbio Bio-pharm Biotechnology (Shanghai, China). A library composed of 350 bp clone inserts was generated for associated samples. Illumina Genome Analyzer was used for metagenomic shotgun sequencing. The 100 bp raw short reads were filtered with host genome data to facilitate the removal of the host sequence. The generated clean reads were assembled to generate long contig sequences with the SOAPdenovo assembler [26]. Several k-mer frequencies were applied to generate different assembly results, and N50 lengths were used to obtain optimal assembly results.
Public data used for taxonomic analysis and gene functional classification included the integrated NCBI-NR database [27], COG database [28] and KEGG database [29] (release 58.1, 1 June 2011). BLASTX in NCBI-BLAST (v. 2.2.31+) was used for alignment with E-values < 0.001 to search the NCBI-NR protein database. A significant-matches set was retained to distinguish taxonomic groups. The taxonomic classification of predicted gene sequences was determined using MEGAN5 (v. 5.1). We predicted gene function by searching query protein sequences of genes against COG and KEGG databases using BLASTX with E-values < 0.001. Using the COG database, genes were classified into COG categories, whereas genes were assigned to KEGG pathways and genes following the use of the KEGG database. The results were processed with default parameters using MEGAN5 to generate functional profiles for each sample. We applied the Goodall-normalized distance metric option in MEGAN5 (v. 5.1) to the KEGG functional data to obtain PCoA coordinates for comparison among all samples pertaining to different diets. Significant difference tests for putative pathways in gut microbial metabolism were performed as follows. The Kruskal–Wallis H-test was used to test for each gene function and statistical differences across the three dietary stages. In order to determine whether the dataset was normally distributed, we performed a test for normality for genes showing significant differences. For the dataset of genes with positive normality test results, Levene's and t-tests were used to determine differences between the leaf and shoot stages. Alternatively, rank-sum tests were used. Genes of significant difference were mapped to pathways and those pathways essential to metagenomic function were picked up as mentioned in the Results section. The statistical analysis of metagenomic data was performed using Python scripts (v.n 2.7.10). All test functions used in significance testing were performed using the Python Statistical package scipy.stats (v. 0.18.1), including the scipy.stats.kruskal module for the Kruskal–Wallis test, scipy.stats.normaltest for normality testing, scipy.stats.levene for Levene's tests, scipy.stats.ttest_ind for t-tests and scipy.stats.ranksums for Wilcoxon's rank-sum test.
3. Results and discussion
(a). Seasonal diet and nutrient content
Seasonal dietary shifts by giant pandas have been observed in Foping Reserve, Qinling Mountains (figure 1a,b). From January to May, giant pandas feed on Bfa leaves at low elevations. From May to July, they switch to Bfa shoots. In the middle of July, when Bfa shoots grow too crude, giant pandas feed on Fqi shoots at higher elevations. For a short period in August, they eat Fqi leaves, then descend to feed on Bfa leaves again until December. This pattern can be summarized as three stages: (i) a leaf stage when pandas eat Bfa leaves from September to April; (ii) a shoot stage when they eat Bfa and Fqi shoots from May to July and (iii) a transition stage when they eat Fqi leaves mixed with Bfa leaves in August (figure 1b). We collected 31 faecal samples, of which 13 were collected during the leaf stage, 11 in the shoot stage and seven in the transition stage. The sample sizes of the three stages are not even. To avoid underestimating variation within the leaf stage, we used the Kruskal–Wallis H-test to look for differences among the three stages.
We examined and compared five main nutritional components across these three stages: crude fibre (cellulose and hemicellulose), raw protein, soluble sugar (carbohydrate) and fat (figure 1c). We collected 76 bamboo samples, including 37 samples during the leaf stage, 28 during the shoot stage and 11 during the transition stage. We found higher concentrations of cellulose (p < 0.001), hemicellulose (p < 0.001) and soluble sugar (p < 0.05) in the leaf stage compared with the shoot stage. In the shoot stage, we found higher protein (p < 0.001) compared to the leaf stage. The concentration of fat did not differ between the shoot and leaf stages.
(b). Changes in gut microbiome diversity and nutrition
Sixteen Svedberg rRNA-targeted metagenome sequencing resulted in a total of 274 605 raw reads from 30 faecal DNA samples. One faecal sample yielded DNA of insufficient quality and was excluded from sequencing. After quality control and denoizing, 19 480 high-quality unique reads were obtained with an average of 590 reads per sample (range 425–1208). These reads were assigned to 156 operational taxonomic units (OTUs) in terms of taxa sharing greater than or equal to 97% 16S rRNA sequence similarity, without random sub-sampling. Taxonomic analysis assigned these OTUs to 88 genera and nine phyla. At the phylum level, the overwhelming majority of gut microbiomes belonged to the phyla Firmicutes and Proteobacteria (figure 2a; electronic supplementary material, figure S1a). At the genus level, major genera included Clostridium, Escherichia-Shigella, Turicibacter and Streptococcus (electronic supplementary material, figure S1b). These results are consistent with previous studies in wild and captive giant pandas [17,30].
Figure 2.

Diversity of the gut microbiome across different foraging stages. (a) Gut microbiota composition of the three stages at the phylum level. (b) Gut microbiota composition at the genus level. (c) PCoA results with Bray–Curtis distance definition, indicating samples of the shoot stage as orange squares and leaf stage as green triangles with transition stage as grey circles. (d) NJ tree of the samples, clearly indicating two branches of the shoot stage and leaf stage connected with the root branch highlighted with a black arrow. (e) Shannon index of the three stages, the significant difference between shoot stage and leaf stage is marked with an asterisk. (f) Although the observed OTU number was higher in the shoot stage than leaf stage, the difference is not significant.
A substantial effect of seasonal nutrient variation on gut microbiome composition was observed at the phylum (figure 2a) and genus levels (figure 2b). Samples from the leaf and shoot stages clearly clustered into two groups in the PCoA (figure 2c) and NJ tree analyses (figure 2d), despite some sporadic data points. Samples from the transition stage occur in two clusters, suggesting a mixed pattern during this bamboo diet shift. The gut microbiome during the shoot stage was always richer and more diverse than in the leaf stage (figure 2e,f; electronic supplementary material, figure S1). Differences in the alpha diversity index (Shannon index) were statistically significant between the shoot and leaf stages (shoot average = 2.078, leaf average = 1.195, p < 0.05). High gut microbiome diversity could be related to a high protein content, and could be more explicit to the function of the gut microbiome during the shoot stage. Further LEfSe analysis identified three OTUs with significant disparate representation between the shoot and leaf stages (p < 0.05; figure 3). Of the three OTUs, OTU15 and 137 were higher in the leaf stage and OTU39 was higher in the shoot stage. OTU15 belongs to the genus Clostridium sensu stricto 1, whose average ratio in the shoot versus leaf stages was 0.0103 versus 0.0477; OTU137 embodies an unknown genus in the order Clostridiales (average of representation 0.0035 in shoot versus 0.0287 in leaf). Both of these OTUs belong to the phylum Firmicutes. OTU39 belongs to the genus Escherichia-Shigella in the phylum Proteobacteria, with an average of representation of 0.0532 in the shoot stage and 0.0038 in the leaf stage.
Figure 3.

OTUs showing significant differences between shoot and leaf stages. (a) Three differentially represented OTUs and the LDA score. Panels (b–d) indicate details of the over- and under-representation of the three OTUs in each sample respectively. Genera in each OTU are shown in each panel. A list of the sample names are in the electronic supplementary material, table S2.
(c). Function of raw fibre utilization of the gut microbiome in the leaf stage
From metagenomic DNA isolated in 27 faecal samples, about 169.6 Gb of gut microbial metagenome sequencing data were obtained (electronic supplementary material, table S1) once some low-quality samples were excluded. Genome assembly resulted in 616 Mbp of assembled data. Gene prediction procedures identified an average of 32 109 protein coding genes for each sample. For gene annotation, an average of 70 910 gene function items were annotated for each sample in the COG database [28] and 4944 enzymes were annotated in 296 pathways in the KEGG database [29].
A total of 426 protein coding genes were identified with significantly different representation in gut microbiomes in the shoot and leaf stages (FDR q-value < 0.05). The distinctiveness of gut microbiomes in the shoot and leaf stages was revealed across a series of metabolic pathways within KEGG databases. Enzymes distinctively over-represented in the shoot stage were involved in two groups of pathways: the first group were pathways for cellulose and hemicellulose degradation involving raw fibre digestion and utilization (figure 4a); and the second group included seven pathways involving bacterial cell cycle control (figure 4b), all of which contribute to the most critical processes of maintaining correct transfer of genetic information to progeny.
Figure 4.

Reinforcement of raw fibre digestion and robustness of bacteria related to function in the leaf stage. (a) Over-represented gene involved in the pathways of cellulose/hemicellulose digestion and utilization. (b). Genes related to pathways of bacterial cell cycle control. The green circle is divided into six sectors to denote the six genes. For each sector, arcs of different colours show existence of this gene in the seven pathways. Alongside each sector is the representation of the gene in three stages in the bar figure. Note that only six genes existing in at least two pathways are shown here. The full 10 genes are shown in the electronic supplementary material, figures S2–S11. (c) Coexistence of genes for raw fibre digestion and genes for bacterial cell cycle control in 12 bacterial species. The two ellipses in the left denote the two genes for raw fibre digestion in (a). The six ellipses in the right denote the six genes in bacterial cell cycle control in (b). The 12 colour blocks in the middle denote the 12 bacterial species. The coloured lines connecting ellipses and blocks denote the existence of genes in the bacterial species.
Detecting genes related to cellulose degradation verifies our previous work on enzymes contributing to raw fibre degradation and utilization [18]. The average of representation was 290.50 ± 139.46 for cellulase (EC3.2.1.4), 1767.41 ± 1070.37 for beta-glucosidase (blgX, EC3.2.1.21) and 561.68 ± 378.61 for xylan 1,4-beta-xylosidase (xynB, EC3.2.1.37). Based on these results, seasonal variation in raw fibre degradation and utilization was intensively investigated and summarized in the first group of pathways mentioned earlier. This group, involving digestion of cellulose and hemicellulose, included beta-glucosidase (blgX, EC3.2.1.21) with relative over-representation of 1162.90 in the shoot stage versus 2403.27 in the leaf stage and xylan 1,4-beta-xylosidase (xynB, EC3.2.1.37) with relative over-representation of 329.41 in the shoot stage versus 820.33 in the leaf stage. Cellulase (EC3.2.1.4) was not differentially represented, illustrating that it is the step of cellodextrin to glucose instead of cellulose to cellodextrin that was over-represented in leaf stage.
This difference can be explained because of the two steps in cellulose digestion. The first step from cellulose to cellodextrin aims to break the bamboo cell wall and release intracellular nutritional components. The second step from cellodextrin to d-glucose creates the final digestive product to be directly used as energy. Considering that the intracellular content of bamboo shoots is a good nutritional source, the first step of digestion is sufficient and it is therefore non-economic and unnecessary to completely degrade cellodextrin into the monosaccharide d-glucose. By contrast, bamboo leaves are a poor nutritional source and the utilization of degradation products in the second step is necessary so the gut microbiome tends to use monosaccharides from the second step in order to fully process this nutrient.
In the second group, seven pathways involved in DNA replication (ko03030), base excision repair (ko03410), nucleotide excision repair (ko03420), mismatch repair (ko03430), homologous recombination (ko03440), purine metabolism (ko00230) and pyrimidine metabolism (ko00240) were identified. There were 10 over-represented genes involved in the seven pathways, among which six genes existed in at least two pathways (figure 4b; electronic supplementary material, figures S2–S11). Since the processes of cell cycle control have been proved in cultured bacteria to be substantially influenced by nutrient availability, we infer that gut microbiome cell cycle control may also be influenced in this way.
It is interesting that the majority of genes in these two groups of pathways coexisted in the same 12 bacteria species within the leaf stage gut microbiome (figure 4c). These species belong to seven genera: Clostridium (four species), Klebsiella (two species), Rahnella (two species), Escherichia (one species), Lactococcus (one species), Enterococcus (one species) and Streptococcus (one species). This suggests that gut microbiomes tend to ensure survival of the bacteria needed to drive raw fibre nutritional utilization and here we introduce the concept of ecological robustness, or ecological resilience, to explain this. Ecological resilience, having been introduced four decades ago [31], denotes the amount of disturbance that an ecosystem can withstand without changing self-organized processes and structures (defined as alternative stable states) [31–33]. The concept has been widely applied to explain the stability or renewal of ecosystems over large spatial–temporal scales, such as marine ecosystems [34], agroecosystems [35] or global hydroclimatic conditions [36]. The role of ecological robustness has also been suggested to apply to gut microbiota [37], but research has focused on health [38,39] and not the influence of diet, and is limited to humans [38,39] or experimental model animals [40]. We posit that the coexistence of the two groups of pathways identified here is required as a kind of reinforcement to secure related bacteria species responsible for raw fibre digestion and utilization, and therefore maintains the adaptive capacities of gut microbiomes to nutrient scarcity during the leaf stage.
(d). Interactions between the gut microbiome and gut environment in the shoot stage
Functional metagenomic analysis revealed distinctive functions over-represented in the shoot stage, consistent with the high protein content of bamboo during this stage. As expected, the KEGG pathways of amino acid transportation in ABC transporters (ko02010) and aminoacyl-tRNA biosynthesis (ko00970) were found to have only genes over-represented in the shoot stage (figure 5a). Regarding amino acid transportation, over-represented genes include artI and artQ for arginine, GltJ for acidic amino acids, glnP for glutamine and MetQ for methonine (electronic supplementary material, figure S12). Regarding aminoacyl-tRNA biosynthesis, over-represented genes include l-isoleucyl-tRNA synthetase (EC:6.1.1.5) and l-lysyl-tRNA synthetase (EC:6.1.1.6) (electronic supplementary material, figure S13). A similar phenomenon was found in the fatty acid degradation pathway (figure 5a; electronic supplementary material, figure S14), suggesting the energy source of the protein synthesis pathway. This could be directly explained by increasing protein biosynthesis in the gut microbiome. Active gut microbiota may have more interactions with hosts via the gut environment. The three pathways (two-component system (ko02020), protein export (ko03060) and bacterial secretion system (ko03070)) have more over-represented genes in the shoot stage (figure 5b; electronic supplementary material, figure S15). Of the three pathways, the two-component system is a system for a bacterial cell in the gut microbiome to sense and respond to changes in the gut environment, involved in the communication of information between the gut microbiome and its environment. The latter two pathways are involved in material exchange between the gut microbiota and gut environment. These results suggest an active host–symbiont interaction via material and information, probably in accordance with the high nutritional content of protein found in bamboo shoots.
Figure 5.
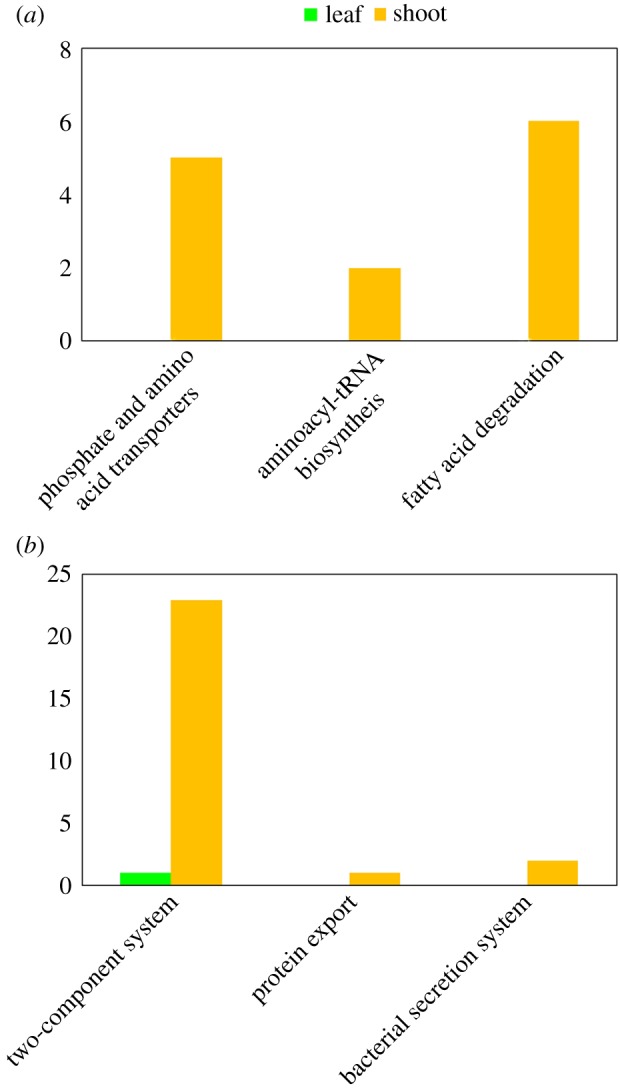
The reinforcement of protein synthesis and related interactions between gut microbiome and gut environment. (a) Expansion of pathways involved in protein biosynthesis, all of which have genes only significantly over-represented in the shoot stage. (b) Pathways related to interactions between the gut microbiome and environment. Most genes with significant over-representation (FDR q-value < 0.05) in these pathways were in the shoot stage.
4. Conclusion
Wild giant pandas seasonally forage on the leaves and shoots of different bamboo species. Using nutritional and metagenomic analysis, we offer evidence that the structure and function of giant panda gut microbiomes are shaped by variation in nutritional utilization and seasonal dietary shifts. A more diverse gut microbiome was observed during the bamboo shoot stage than leaf stage. In the leaf stage, genes for cell cycle control were over-represented within bacteria species over-representing genes for raw fibre utilization. This may guarantee raw fibre utilization by reinforcing gut microbiome robustness during the nutrient-deficient leaf stage. In the high protein shoot stage, prokaryotic secretion and signal transduction activity was higher, suggesting active interactions between gut microbiome and host. For the two steps of cellulose digestion, seasonal variation was only found in the second step, suggesting that the gut microbiomes of the giant panda digest raw fibre by breaking the bamboo cell wall and releasing intracellular nutrients instead of direct utilization. For the first time, these results provide nutritional insight into how seasonal dietary shifts affect the structure and function of gut microbiomes in wild animals.
An old and intriguing question is why the giant panda forages on bamboo when it is a member of the Carnivora. In recent decades, a series of studies have unravelled the evolutionary adaptations to their bamboo diet (refer to reviews: [13,41,42]), spanning morphology [14,15,43], behaviour [17,20], ecology [13,16], physiology [44], genetics and genomics [13,45]. The giant panda's gut microbiome contributes to the digestion of raw fibre [18] and this study offers further insights as to how the gut microbiome reinforces the utilization of nutrients despite seasonal changes in bamboo quality and forage. We suggest that the gut microbiome plays an essential role in nutrition utilization in the giant panda, and that this forms yet another adaptation to their exclusive bamboo diet.
Supplementary Material
Acknowledgements
We thank Foping Nature Reserve.
Data accessibility
Reads of the sequence data have been deposited in the GSA database (http://bigd.big.ac.cn/) under bioproject accession no. PRJCA000366.
Authors' contributions
F.W. designed the research and interpreted data. Q.W., Y.N., Y.H. and X.W. prepared samples. Q.W., Y.H., Y.D., X.W. and L.Z. performed metagenomic research. Y.N., W.W. and X.W. performed nutritional analyses. Q.W., Y.H., Y.D., S.M., W.W., X.W. and L.Y. analysed and interpreted data. Q.W. and F.W. wrote the manuscript. L.Z., Y.N. and Y.H. revised the manuscript.
Competing interests
We declare we have no competing interests.
Funding
This project was supported by grants from the Strategic Priority Research Program of the Chinese Academy of Sciences (grant no. XDPB0202), the National Key Program of Research and Development, Ministry of Science and Technology (grant no. 2016YFC0503200), the National Natural Science Foundation of China (grant nos. 31372222 and 31471992) and the Chinese Academy of Sciences (QYZDB-SSW-SMC047).
References
- 1.Savage C. 1986. Gastrointestinal microflora in mammalian nutrition. Annu. Rev. Nutr. 6, 155–178. ( 10.1146/annurev.nu.06.070186.001103) [DOI] [PubMed] [Google Scholar]
- 2.Handelsman J, Rondon R, Brady F, Clardy J, Goodman M. 1998. Molecular biological access to the chemistry of unknown soil microbes: a new frontier for natural products. Chem. Biol. 5, R245–R249. ( 10.1016/S1074-5521(98)90108-9) [DOI] [PubMed] [Google Scholar]
- 3.Handelsman J. 2004. Metagenomics: application of genomics to uncultured microorganisms. Microbiol. Mol. Biol. Rev. 68, 669–685. ( 10.1128/MMBR.68.4.669-685.2004) [DOI] [PMC free article] [PubMed] [Google Scholar]
- 4.Muegge BD, Kuczynski J, Knights D, Clemente JC, González A, Fontana L, Henrissat B, Knight R, Gordon JI. 2011. Diet drives convergence in gut microbiome functions across mammalian phylogeny and within humans. Science 332, 970–974. ( 10.1126/science.1198719) [DOI] [PMC free article] [PubMed] [Google Scholar]
- 5.Guarner F, Malagelada R. 2003. Gut flora in health and disease. Lancet 361, 512–519. ( 10.1016/S0140-6736(03)12489-0) [DOI] [PubMed] [Google Scholar]
- 6.Versalovic J, Relman D. 2006. How bacterial communities expand functional repertoires. PLoS Biol. 4, e430 ( 10.1371/journal.pbio.0040430) [DOI] [PMC free article] [PubMed] [Google Scholar]
- 7.David LA, et al. 2014. Diet rapidly and reproducibly alters the human gut microbiome. Nature 505, 559–563. ( 10.1038/nature12820) [DOI] [PMC free article] [PubMed] [Google Scholar]
- 8.Wu GD, et al. 2011. Linking long-term dietary patterns with gut microbial enterotypes. Science 334, 105–108. ( 10.1126/science.1208344) [DOI] [PMC free article] [PubMed] [Google Scholar]
- 9.Amato KR, et al. 2015. The gut microbiota appears to compensate for seasonal diet variation in the wild black howler monkey (Alouatta pigra). Microb. Ecol. 69, 434–443. ( 10.1007/s00248-014-0554-7) [DOI] [PubMed] [Google Scholar]
- 10.Maurice CF, Knowles SC, Ladau J, Pollard KS, Fenton A, Pedersen AB.. 2015. Marked seasonal variation in the wild mouse gut microbiota. ISME J. 9, 2423–2434. ( 10.1038/ismej.2015.53) [DOI] [PMC free article] [PubMed] [Google Scholar]
- 11.Sun B, Wang X, Bernstein S, Huffman MA, Xia DP, Gu Z. 2016. Marked variation between winter and spring gut microbiota in free-ranging Tibetan Macaques (Macaca thibetana). Sci. Rep. 6, 26035 ( 10.1038/srep26035) [DOI] [PMC free article] [PubMed] [Google Scholar]
- 12.Gomez A, Rothman M, Petrzelkova K, Yeoman J, Vlckova K. 2015. Temporal variation selects for diet–microbe co-metabolic traits in the gut of Gorilla spp. ISME J. 10, 514–526. ( 10.1038/ismej.2015.146) [DOI] [PMC free article] [PubMed] [Google Scholar]
- 13.Wei FW, Hu Y, Yan L, Nie Y, Wu Q, Zhang Z. 2015. Giant pandas are not an evolutionary cul-de-sac: evidence from multidisciplinary research. Mol. Biol. Evol. 32, 4–12. ( 10.1093/molbev/msu278) [DOI] [PubMed] [Google Scholar]
- 14.Schaller B, Hu J, Pan W, Zhu J. 1985. The giant pandas of Wolong, 1st edn Chicago, IL: University of Chicago Press. [Google Scholar]
- 15.Pan W, Lu Z, Zhu X, Wang D, Wang H, Long Y, Fu D, Zhou XA. 2014. A chance for lasting survival. Washington, DC: Smithsonian Institution Scholarly Press. [Google Scholar]
- 16.Nie Y, Zhang Z, Raubenheimer D, Elser JJ, Wei W, Wei F. 2015. Obligate herbivory in an ancestrally carnivorous lineage: the giant panda and bamboo from the perspective of nutritional geometry. Funct. Ecol. 29, 26–34. ( 10.1111/1365-2435.12302) [DOI] [Google Scholar]
- 17.Wei W, Nie Y, Zhang Z, Hu Y, Yan L, Qi D, Li X, Wei F. 2015. Hunting bamboo: foraging patch selection and utilization by giant pandas and implications for conservation. Biol. Conserv. 186, 260–267. ( 10.1016/j.biocon.2015.03.023) [DOI] [Google Scholar]
- 18.Zhu L, Wu Q, Dai J, Zhang S, Wei FW. 2011. Evidence of cellulose metabolism by the giant panda gut microbiome. Proc. Natl. Acad. Sci. USA 108, 17 714–17 719. ( 10.1073/pnas.1017956108) [DOI] [PMC free article] [PubMed] [Google Scholar]
- 19.Wei FW, Wang X, Wu Q. 2015. The giant panda gut microbiome. Trends Microbiol. 23, 450–452. ( 10.1016/j.tim.2015.06.004) [DOI] [PubMed] [Google Scholar]
- 20.Zhang Z, Sheppard JK, Swaisgood RR, Wang G, Nie Y, Wei W, Zhao N, Wei F. 2014. Ecological scale and seasonal heterogeneity in the spatial behaviors of giant pandas. Integr. Zool. 9, 46–60. ( 10.1111/1749-4877.12030) [DOI] [PubMed] [Google Scholar]
- 21.Bremner J. 1996. Nitrogen—total. In Methods of soil analysis. Part 3: chemical methods (eds Sparks D, et al.), pp. 1085–1123. Madison, WI: Soil Science Society of America and American Society of Agronomy. [Google Scholar]
- 22.AOAC International. 1980. Official methods of analysis: method 16193, Semimicro-Kjeldahl. Washington, DC: Association of Official Analytical Chemists. [Google Scholar]
- 23.Van Soest J, Robertson B, Lewis A. 1991. Methods for dietary fiber, neutral detergent fiber, and nonstarch polysaccharides in relation to animal nutrition. J. Dairy Sci. 74, 3583–3597. ( 10.3168/jds.S0022-0302(91)78551-2) [DOI] [PubMed] [Google Scholar]
- 24.Rondel C, Marcato-Romain E, Girbal-Neuhauser E. 2013. Development and validation of a colorimetric assay for simultaneous quantification of neutral and uronic sugars. Water Res. 47, 2901–2908. ( 10.1016/j.watres.2013.03.010) [DOI] [PubMed] [Google Scholar]
- 25.Segata N, Izard J, Waldron L, Gevers D, Miropolsky L, Garrett WS, Huttenhower C.. 2011. Metagenomic biomarker discovery and explanation. Genome Biol. 12, R60 ( 10.1186/gb-2011-12-6-r60) [DOI] [PMC free article] [PubMed] [Google Scholar]
- 26.Luo R, et al. 2012. SOAPdenovo2: an empirically improved memory-efficient short-read de novo assembler. GigaScience 1, 18 ( 10.1186/2047-217X-1-18) [DOI] [PMC free article] [PubMed] [Google Scholar]
- 27.O'Leary NA, et al. 2016. Reference sequence (RefSeq) database at NCBI: current status, taxonomic expansion, and functional annotation. Nucleic Acids Res. 44, D733–D745. ( 10.1093/nar/gkv1189) [DOI] [PMC free article] [PubMed] [Google Scholar]
- 28.Huerta-Cepas J, et al. 2015. eggNOG 4.5: a hierarchical orthology framework with improved functional annotations for eukaryotic, prokaryotic and viral sequences. Nucleic Acids Res. 44, D286–D293. ( 10.1093/nar/gkv1248) [DOI] [PMC free article] [PubMed] [Google Scholar]
- 29.Kanehisa M, Furumichi M, Tanabe M, Sato Y, Morishima K. 2017. KEGG: new perspectives on genomes, pathways, diseases and drugs. Nucleic Acids Res. 45, D353–D361. ( 10.1093/nar/gkw1092) [DOI] [PMC free article] [PubMed] [Google Scholar]
- 30.Xue Z, et al. 2015. The bamboo-eating giant panda harbors a carnivore-like gut microbiota, with excessive seasonal variations. MBio 6, e00022-15 ( 10.1128/mBio.00022-15) [DOI] [PMC free article] [PubMed] [Google Scholar]
- 31.Holling S. 1973. Resilience and stability of ecological systems. Ann. Rev. Ecol. Syst. 4, 1–23. ( 10.1146/annurev.es.04.110173.000245) [DOI] [Google Scholar]
- 32.Gunderson H. 2000. Ecological resilience—in theory and application. Ann. Rev. Ecol. Syst. 31, 425–439. ( 10.1146/annurev.ecolsys.31.1.425) [DOI] [Google Scholar]
- 33.Elmqvist T, Folke C, Nyström M, Peterson G, Bengtsson J, Walker B, Norberg J. 2003. Response diversity, ecosystem change, and resilience. Front. Ecol. Environ. 1, 488–494. ( 10.1890/1540-9295(2003)001%5B0488:RDECAR%5D2.0.CO;2) [DOI] [Google Scholar]
- 34.Levin SA, Lubchenco J. 2008. Resilience, robustness, and marine ecosystem-based management. Bioscience 58, 27–32. ( 10.1641/B580107) [DOI] [Google Scholar]
- 35.Pocock MJ, Evans DM, Memmott J. 2012. The robustness and restoration of a network of ecological networks. Science 335, 973–977. ( 10.1126/science.1214915) [DOI] [PubMed] [Google Scholar]
- 36.Ponce-Campos GE, et al. 2013. Ecosystem resilience despite large-scale altered hydroclimatic conditions. Nature 494, 349–352. ( 10.1038/nature11836) [DOI] [PubMed] [Google Scholar]
- 37.Relman A. 2012. The human microbiome: ecosystem resilience and health. Nutr. Rev. 70(Suppl. 1), S2–S9. ( 10.1111/j.1753-4887.2012.00489.x) [DOI] [PMC free article] [PubMed] [Google Scholar]
- 38.Kim SW, Suda W, Kim S, Oshima K, Fukuda S, Ohno H, Morita H, Hattori M. 2013. Robustness of gut microbiota of healthy adults in response to probiotic intervention revealed by high-throughput pyrosequencing. DNA Res. 20, 241–253. ( 10.1093/dnares/dst006) [DOI] [PMC free article] [PubMed] [Google Scholar]
- 39.Thiemann S, Smit N, Strowig T. 2016. Antibiotics and the intestinal microbiomeintestinal microbiome: individual responses, resilience of the ecosystem, and the susceptibility to infections. Curr. Top. Microbiol. Immunol. 398, 123–146. ( 10.1007/82_2016_504) [DOI] [PubMed] [Google Scholar]
- 40.Zhang C, et al. 2016. Ecological robustness of the gut microbiota in response to ingestion of transient food-borne microbes. ISME J. 10, 2235–2245. ( 10.1038/ismej.2016.13) [DOI] [PMC free article] [PubMed] [Google Scholar]
- 41.Wei FW, Swaisgood RR, Hu YB, Nie YG, Yan L, Zhang ZJ, Qi D, Zhu L. 2015. Progress in the ecology and conservation of giant pandas. Conserv. Biol. 29, 1497–1507. ( 10.1111/cobi.12582) [DOI] [PubMed] [Google Scholar]
- 42.Wei FW, Hu YB, Zhu LF, Bruford MW, Zhan XJ, Zhang L. 2012. Black and white and read all over: the past, present and future of giant panda genetics. Mol. Ecol. 21, 5660–5674. ( 10.1111/mec.12096) [DOI] [PubMed] [Google Scholar]
- 43.Hu Y, et al. 2017. Comparative genomics reveals convergent evolution between the bamboo-eating giant and red pandas. Proc. Natl. Acad. Sci. USA 114, 1081–1086. ( 10.1073/pnas.1613870114) [DOI] [PMC free article] [PubMed] [Google Scholar]
- 44.Nie Y, et al. 2015. Exceptionally low daily energy expenditure in the bamboo-eating giant panda. Science 349, 171–174. ( 10.1126/science.aab2413) [DOI] [PubMed] [Google Scholar]
- 45.Zhao S, et al. 2013. Whole-genome sequencing of giant pandas provides insights into demographic history and local adaptation. Nat. Genet. 45, 67–71. ( 10.1038/ng.2494) [DOI] [PubMed] [Google Scholar]
Associated Data
This section collects any data citations, data availability statements, or supplementary materials included in this article.
Supplementary Materials
Data Availability Statement
Reads of the sequence data have been deposited in the GSA database (http://bigd.big.ac.cn/) under bioproject accession no. PRJCA000366.