

Abstract
Human presence in Southeast Asia dates back to at least 40,000 years ago, when the current islands formed a continental shelf called Sundaland. In the Philippine Islands, Peninsular Malaysia, and Andaman Islands, there exist indigenous groups collectively called Negritos whose ancestry can be traced to the “First Sundaland People.” To understand the relationship between these Negrito groups and their demographic histories, we generated genome-wide single nucleotide polymorphism data in the Philippine Negritos and compared them with existing data from other populations. Phylogenetic tree analyses show that Negritos are basal to other East and Southeast Asians, and that they diverged from West Eurasians at least 38,000 years ago. We also found relatively high traces of Denisovan admixture in the Philippine Negritos, but not in the Malaysian and Andamanese groups, suggesting independent introgression and/or parallel losses involving Denisovan introgressed regions. Shared genetic loci between all three Negrito groups could be related to skin pigmentation, height, facial morphology and malarial resistance. These results show the unique status of Negrito groups as descended from the First Sundaland People.
Keywords: Negritos, Southeast Asia, admixture, population genetics, Denisovan
Introduction
The question of how and when anatomically modern humans made the journey out of Africa and into all corners of the world has been of great interest. It is widely acknowledged that humans have been in Southeast Asia (SEA) at least 40–50 thousand years ago (ka). Indeed, human remains found in Niah Cave in Borneo (Barker et al. 2007), Callao Cave in the Philippines (Mijares et al. 2010) and Tam Pa Ling in Laos (Demeter et al. 2012) were dated to approximately that time period. Then, the current islands of Sumatra, Java and Borneo were connected with the Asian mainland, forming the landmass known as Sundaland. A cluster of islands separate Sundaland from another landmass called Sahul, made up of what is now New Guinea and Australia.
There are several human populations scattered throughout SEA that are thought to be descendants of the “First Sundaland People.” They are collectively known as Negritos and are currently found in the Andaman Islands, Malay Peninsula and several islands in the Philippines. They have been traditionally associated with a hunter-gathering lifestyle, and also exhibit physical features that are distinct from their non-Negrito neighbors, namely short stature, frizzy hair, and dark skin (Barrows 1910; Radcliffe-Brown 1922; Evans 1937). These observations led to the idea that the Negritos might be closely related to African Pygmies who also exhibit similar phenotypes (Howells 1973). Alternatively, the similar phenotypes may have arisen due to adaptation to relatively similar environmental conditions in Africa and Southeast Asia (Coon 1965), namely convergent evolution.
Early genetic studies that utilized various red blood cell enzymes and serum proteins, led by one of us (K.O.), found that Philippine Negritos have closer affinities to Asia-Pacific populations than to African Pygmies (Omoto et al. 1978, 1981; Matsumoto et al. 1979; Horai et al. 1981). Later studies of mitochondrial DNA (mtDNA) reported basal lineages in Andamanese and Malaysian Negritos that date back to the earliest migrations to SEA (Thangaraj et al. 2005; Hill et al. 2006; Jinam et al. 2012). Genome-wide Single Nucleotide Polymorphisms (SNPs) studies added further insight to the genetic diversity of Negritos. Using ∼50k SNPs, the HUGO Pan-Asian SNP Consortium proposed a single wave of migration into SEA, with the Malaysian and Philippine Negritos as the forerunners (The HUGO Pan-Asian SNP Consortium 2009). Subsequent studies reported various demographic and evolutionary factors that affected their genetic diversity. These included admixture (Jinam et al. 2013), long term isolation and bottlenecks (Deng et al. 2014; Aghakhanian et al. 2015), and adaptation to malaria (Liu et al. 2015). However, compared with Malaysian Negritos, genome-wide studies involving the Philippine Negritos are relatively limited.
Here we generated approximately 1 million genome-wide SNPs in four Negrito (Aeta, Agta, Batak, and Mamanwa) and three non-Negrito groups (Tagalog, Visayan, and Manobo) from the Philippines. By combining this newly generated SNP data with previously published data of Andamanese and Malaysian Negritos, as well as other neighboring populations in SEA, we sought to obtain a deeper view of the demographic events that shaped the genetic diversity of the Negritos. Specifically, we would like to find out when these populations diverged; are there any genetic similarities among the Negrito groups; and did admixture with archaic humans have any impact on their genetic diversity?
Materials and Methods
Sample Information
Peripheral blood samples from the Philippines were collected by the Japanese–Philippine joint study team headed by one of us (K. O.), from 1975 to 1985. The DNA were extracted and purified using the phenol–chloroform method, and were preserved in freezers; now stored at Department of Integrated Biosciences, Graduate School of Frontier Sciences, the University of Tokyo. A total of 150 individual samples from four Negrito groups and three non-Negrito groups were selected for genome-wide SNP typing using the Affymetrix 6.0 array. The sample information is listed in supplementary table S1 in the Supplementary Material online. The geographical locations of these populations are depicted in supplementary figure S1 in the Supplementary Material online. This study has been approved by the ethics committee of the University of Tokyo (15-223) and the National Institute of Genetics, Japan.
Data Quality Checks
The SNP genotypes, typed at Department of Human Genetics, Graduate School of Medicine, the University of Tokyo, were called using Affymetrix Birdseed v2 algorithm, with a more stringent confidence score cutoff of 0.1 instead of the default 0.5. In total, genotypes for 868,261 autosomal SNPs were obtained. Further SNP quality filtering was done using PLINK software (Purcell et al. 2007) to omit SNPs with <95% genotyping call rate. SNPs that deviated from the Hardy–Weinberg equilibrium (P < 1×10⁻¹⁰) were also removed from each population separately, before merging the data again.
Closely related pairs of individuals were identified in each population using KING software (Manichaikul et al. 2010). To keep as many individuals as possible, only one individual from each pair that had first degree relations (estimated kinship coefficient >0.25) were removed; in total 25 individuals were omitted.
Merging with Other Samples
The resulting 782,966 autosomal SNP from the Philippines were merged with five populations from Malaysia and the Philippines which were also genotyped using Affymetrix 6.0 arrays (Reich et al. 2011), including two Negrito groups (Jehai and Mamanwa) and three non-Negrito Austronesian populations (Manobo, Bidayuh, and Temuan). In addition, three HapMap (International HapMap Consortium 2005) populations (Han Chinese (CHB), Caucasians (CEU) and Yorubans (YRI)) that were genotyped using Affymetrix 6.0 arrays were merged with the Philippine and Malaysian data sets, resulting in a total of 519,832 SNPs.
The above data set was further merged with two Andamanese groups (Jarawa and Onge) (Basu et al. 2015) and two Malaysian Negrito groups (Bateq and Kintaq) (Aghakhanian et al. 2015). The number of overlapping SNP loci was 112,845. We further merged the data with the Human Genome Diversity Panel (HGDP) SNP data generated with the Affymetrix Human Origins array (Patterson et al. 2012). The number of available SNPs after merging was 44,960. The various data sets used for subsequent analyses are listed in supplementary table S2 in the Supplementary Material online.
Data Analysis
Principal Component Analysis (PCA) was performed using the smartpca program from the EIGENSOFT package (Patterson et al. 2006) to infer relationships at the individual level. In addition, ADMIXTURE analysis (Alexander et al. 2009) was done to assess population substructure and admixture within individuals. We also performed population level phylogenetic analysis by constructing Neighbor Joining trees (Saitou and Nei 1987) from Nei’s standard genetic distances (Nei 1972) computed using PHYLIP (http://evolution.genetics.washington.edu/phylip.html). One thousand bootstrap replicates of the input data were generated to assess the robustness of the tree branching patterns. Networks were constructed using the Neighbor-Net algorithm (Bryant and Moulton 2004) implemented in Splitstree software (Huson and Bryant 2006). To assess possible geneflow events between populations, we used the treemix software (Pickrell and Pritchard 2012). The robustness of treemix estimates was tested using 1,000 bootstrap replicates of the input data, generated using perl scripts developed and used for Jomon ancient genome analysis (Kanzawa-Kiriyama et al. 2017).
We also performed a formal test for admixture using the D-statistics method from the Admixtools software package (Patterson et al. 2012). The f4 ratio test from the same software package was used to estimate the proportion of Denisovan admixture in the various Negrito groups, assuming the tree topology in supplementary figure S2 in the Supplementary Material online. We further applied the RD(x) statistic (Qin and Stoneking 2015) to verify Denisovan introgression, taking into account Neanderthal ancestry in various Southeast Asian populations. The RD(x) statistics is defined as the ratio of two f4 (or D) statistics: f4(Yoruban, Denisovan; French, x)/f4(Yoruban, Neanderthal; French, x), where x is the test population. Values >1 imply Denisovan ancestry in population x.
Pairwise allele sharing distances (ASD) (Gao and Martin 2009) were calculated from the genome sequences of Denisovan (Meyer et al. 2012), Altai Neanderthal (Prüfer et al. 2014), a Papuan individual (Green et al. 2010), an Australian Aborigine (Rasmussen et al. 2011), three Aeta (Philippine Negrito) individuals (Pagani et al. 2016) and five Han Chinese (The 1000 Genomes Project Consortium 2015), using a perl script. The position of the three Aeta individuals from Pagani et al. (2016) in the PCA plot (supplementary fig. S3, Supplementary Material online) suggests that they may be more admixed than some Aeta individuals from our data set. SNP loci with missing genotypes were omitted and the total number of SNPs used for this analysis was 753,276. We defined allele sharing (AS) as 1−ASD and calculated this statistic for nonoverlapping blocks of 1,000 SNPs. For each block, we took the ratio of ASDenisovan/ASNeanderthal in Papuan, Australian Aborigine, and Aeta separately. Blocks with ratios >1 are putatively enriched with Denisovan ancestry while the rest are set to zero AS with Denisovan. We further subtracted ASDenisovan-CHB values from each putative Denisovan shared block to get a clearer signal of Denisovan ancestry.
To estimate divergence times between pairs of populations, we used the R-package NeON (Mezzavilla and Ghirotto 2015) which implements a method based on patterns of LD and allele frequencies in the genome (McEvoy et al. 2011). From the resulting pairwise estimates of divergence times, we constructed phylogenetic trees using the UPGMA method (Sokal and Michener 1958; see Saitou 2013 for the algorithm), because by definition divergence time estimates should follow a constant rate of evolution.
In order to identify genetic loci that may be shared among Negrito groups, we calculated pairwise Fst (Weir and Cockerham 1984) between Andamanese, Malaysian and Philippine Negritos and Han Chinese. We then identified SNP sites that have low Fst among the three Negrito groups (Fst from 0 to 0.05) but high Fst between Negritos and Han Chinese (>10-fold difference in Fst). The possible functions of these SNPs were examined using the Panther Gene Ontology (Thomas et al. 2003).
Results
Population Structure and Admixture
We first investigated the relationship between individuals by PCA. Figure 1A shows that the first two principal components (PCs) separates the Andamanese, Malaysian Negritos and Philippine Negritos into distinct clusters. If Papuans and Melanesians were included (supplementary fig. S4A, Supplementary Material online), the Philippine Negritos were located between the Papuans and Malaysian Negritos along PC2. When the Andamanese individuals were omitted, PC1 separates the Aeta, Agta, and Batak from the other populations whereas PC2 separates the Mamanwa and Jehai from other groups (fig. 1B). The Agta, Aeta, and Batak individuals form a comet-like pattern along PC1, which may indicate admixture events. Similarly, the Mamanwa also showed the comet-like pattern along PC2. The PCA plot without Agta and Aeta (supplementary fig. S4B, Supplementary Material online) places the Batak close to the non-Negrito Philippine groups, suggesting a high proportion of admixture. The Manobo and Mamanwa, both living in northern Mindanao, have a high affinity as several Manobo individuals clustered with the Mamanwa (fig. 1B and supplementary fig. S4B, Supplementary Material online).
Fig. 1.
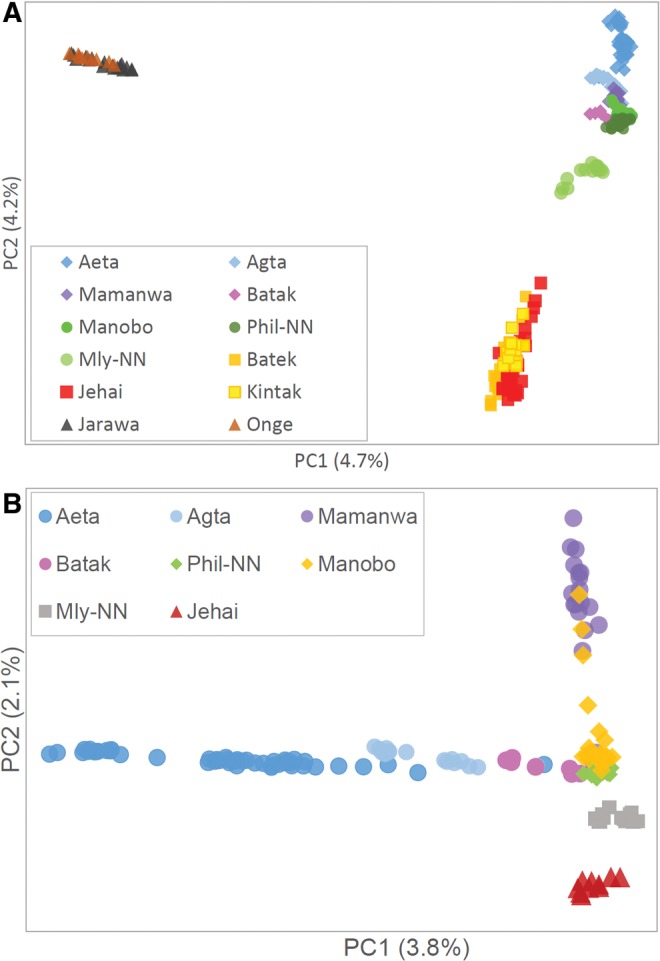
—Principal component analysis plot of (A) Andamanese (Jarawa and Onge), Malaysian Negritos (Batek, Jehai, and Kintak), and Philippine Negritos (Aeta, Agta, Mamanwa, and Batak) with non-Negrito Southeast Asians; (B) Malaysian and Philippine populations. Mly-NN, Malaysian non-Negritos (Temuan and Bidayuh); Phil-NN, Philippine non-Negritos (Tagalog and Visayan; Manobo was treated separately).
The results of ADMIXTURE analysis from k = 2–7 are shown in figure 2. The cross-validation error assuming k = 1 to k = 9 number of clusters shows that k = 7 has the lowest error (supplementary fig. S5, Supplementary Material online). The orange-colored component is highest in the Austronesian-speaking non-Negrito groups, with varying proportions in the four Philippine Negritos, suggesting admixture. Among the Philippine Negrito groups, the Batak have the highest proportion of this orange component, corresponding well to their close proximity to the non-Negritos in the PCA plot (fig. 1B). From k = 6, the Mamanwa have their own genetic component (white), and at k = 7, the Batek were differentiated from other populations (yellow). These observations suggest that the Mamanwa and Batek have experienced a substantial amount of long-term genetic drift. To verify the presence of admixture, we used the D-statistic (Patterson et al. 2012). The results for D(Philippine Negrito, Andamanese; French, x), are shown in supplementary figure S6 in the Supplementary Material online. A negative Z-score implies gene flow between the Philippine Negritos and population x; highly negative Z-scores were observed for Philippine Negritos and Philippine non-Negritos, suggesting gene flow tended to involve groups that are geographically close. We classified individuals from Aeta, Mamanwa and Manobo groups who have less than 60% of their corresponding ancestral component proportion based on ADMIXURE result at k = 6 as highly admixed. In total, 22 individuals were omitted from subsequent population-based analyses.
Fig. 2.

—Results of ADMIXTURE assuming k = 2 to k = 7. Each vertical line represents an individual and the different colors represent various ancestry components. Negrito group labels are indicated in red text.
Phylogenetic Relationships
To investigate the relationships among Negritos, we constructed a Neighbor-Joining (NJ) tree (fig. 3A). This tree shows that following the split from Europeans, the Papuans/Melanesians, Andamanese, Malaysian, and Philippine Negritos all appear basal to other Southeast and East Asian populations, in that branching order. The Neighbor-Net network in supplementary figure S7 in the Supplementary Material online shows a relatively long split (in blue color) that groups the Andamanese and Malaysian Negritos while a short split (in red color) groups the Andamanese and Philippine Negritos together. There is another split that separates all three groups of Negritos (except Batak) from the remaining populations. These splits suggest some shared genetic components that may not be immediately evident from other methods such as phylogenetic trees or PCA.
Fig. 3.

—(A) Neighbor-joining tree constructed from Nei’s standard genetic distance. (B) Maximum-likelihood tree generated using Treemix, assuming five geneflow events, with only three shown for clarity. Numbers in red and blue text represent average migration weights and bootstrap supports for branches out of 1,000 bootstrap replicates, respectively. Only bootstrap values >50% are shown.
The treemix result assuming five gene flow events is shown in figure 3B. For visual clarity, only three gene flow events are shown. The gene flow from Denisovan to Papuan was observed 811 times out of 1,000 bootstrap replicates, and is consistent with previous reports (Reich et al. 2011; Meyer et al. 2012; Malaspinas et al. 2016). Interestingly, a separate gene flow event from Denisovan to some Philippine Negritos (Agta and Aeta) was also inferred. Out of 1,000 bootstrap replicates, this gene flow event was observed 733 times. Assuming the migration weight is analogous to gene flow proportion, the estimated gene flow from Denisovan to Papuan and from Denisovan to Philippine Negritos were 4.6% and 1.4%, respectively. The gene flow event with the highest migration weight was from the Malaysian non-Negritos to the Malaysian Negritos, at 47%. However, it was only observed 69 times out of 1,000 bootstrap replicates. In the remaining bootstrap replicates, the gene flow directions were from various positions along the internal branches of the Southeast/East Asian cluster towards Malaysian Negritos. Other inferred events involved gene flows from the French to Cambodians and from Malaysian Negritos to non-Negrito Southeast Asians and Han Chinese (supplementary fig. S8, Supplementary Material online). The topology of the treemix output was different from the NJ tree which assumed no gene flow (fig. 3A). The low bootstrap probabilities suggest that the treemix tree topology may not be reliable.
Denisovan Introgression
We estimated the proportion of the Denisovan ancestry in SEA populations using the f4 ratio test, assuming the tree topology in supplementary figure S2A in the Supplementary Material online. If the positions of Han Chinese and Denisovan are swapped (supplementary fig. S2B, Supplementary Material online), the estimated Denisovan ancestry proportion remains the same, but the Z-scores were very high (supplementary table S3, Supplementary Material online). In either case, our results show that the Papuans have the highest Denisovan genetic component, consistent with a previous result (Meyer et al. 2012). Philippine Negritos also show a substantial proportion of Denisovan components, particularly in the Aeta (fig. 4). We further applied the RD(x) test (Qin and Stoneking 2015) to confirm the presence of Denisovan introgression, taking into account possible Neanderthal introgression (see “Materials and Methods” section). Populations with RD(x) values >1 possibly carry Denisovan ancestry and supplementary figure S9 in the Supplementary Material online shows that the Papuans, Melanesians, and Philippine Negritos (Aeta) may indeed have experienced Denisovan gene flow.
Fig. 4.
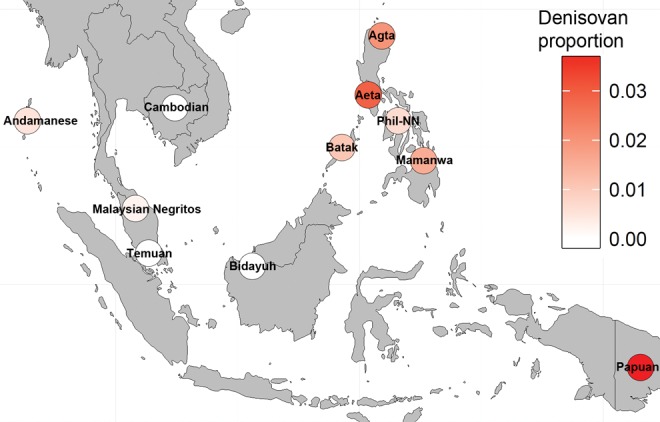
—Estimation of Denisovan ancestry in Southeast Asians using the f4 ratio test. Proportion of Denisovan ancestry is represented by colored circles. Phil-NN, Philippine non-Negritos (Tagalog, Visayan, and Manobo).
To investigate whether these high proportions of Denisovan ancestry in the Papuans and Aeta were at the same genetic loci, we calculated Denisovan allele sharing within nonoverlapping blocks of 1,000 SNPs. The distribution of those blocks shows that the highest allele sharing with Denisovans was in the Australian Aborigine, followed by Papuan and Aeta (fig. 5A). If only Papuans and Aeta are considered, 45.7% of those blocks are present in both groups, while 40% and 14.3% are found only in Papuans and Aeta, respectively. The distribution of blocks in chromosome 3 is an example of the different patterns of Denisovan allele sharing in Papuans and Aeta (fig. 5B).
Fig. 5.

—(A) Distribution of Denisovan allele-sharing in Papuan, Australian Aborigine, and Aeta (Philippine Negrito) published genome sequences, calculated in 1,000 SNP blocks and (B) Example of Denisovan allele-sharing patterns in chromosome 3 for Papuan and Aeta.
Divergence Time Estimates
We estimated divergence times using three data sets with different number of SNPs: 110k, 290k and 480k (supplementary table S2, Supplementary Material online) as increasing the number of loci (L) decreases the number of populations for which individuals sampled from the populations have on these L loci. Assuming a generation time of 30 years (Fenner 2005), the pairwise divergence times using three data sets are listed in supplementary table S4 in the Supplementary Material online and the UPGMA tree representing the 480k SNP data is shown in supplementary figure S10 in the Supplementary Material online. The topology of the UPGMA tree is similar to the NJ tree in figure 3A, with the Negritos basal to other Southeast and East Asians. The Negritos diverged from Europeans ∼30–38 ka, whereas the split time of Malaysian and Philippine Negritos was 13–15 ka, depending on the SNP data set used.
Shared Genetic Loci among the Negritos
In order to investigate shared genetic loci among the Andamanese, Malaysian and Philippine Negritos, we identified SNP loci that have low Fst values among the three Negrito groups, but high Fst values between Negritos and non-Negritos (Han Chinese). Of the 112,845 SNPs, 4,313 met the cutoff values (see “Materials and Methods” section). Of these, 41% are located within genes. The biological processes that are associated with those genes are listed in supplementary table S5 in the Supplementary Material online. Interestingly, some of those genes were associated with certain phenotypes identified from genome-wide association studies. OCA2 and SLC45A2 were associated with skin pigmentation (Stokowski et al. 2007), ACAN and ADAMTS17 with height variation (Wood et al. 2014), and PAX3, PREP, and GRID1 were associated with facial and scalp features (Adhikari et al. 2016). Details of those SNPs are listed in supplementary table S6 in the Supplementary Material online.
Discussion
This study presents an encompassing view of early human migrations into Southeast Asia (SEA) by analyzing genomic data of Negrito groups from three geographical regions. Although most of these Negrito groups currently reside in rural and sometimes inaccessible areas, they are far from being genetic isolates, as shown by PCA, ADMIXTURE, and D-statistics analyses. A clear difference was observed between the Mamanwa individuals from this sampling and the ones collected fairly recently (<10 years ago) on the Neighbor-Net network (supplementary fig. S11, Supplementary Material online). Recently sampled Mamanwa were closer to the Manobo, a non-Negrito group. This suggests admixture has been and probably still is occurring between the Mamanwa and Manobo. Alternatively it may imply a bias in sampling of individuals that represent a population. The consequence of this admixture is also reflected in mtDNA and Y-chromosomal diversity of the Philippine Negritos (Delfin et al. 2011, 2014).
An early study in the 1980s based on classic genetic markers hypothesized a dual origin of the Philippine Negrito populations. Genetic distance and phylogenetic analyses indicated that the Mamanwa were distinct from the Aeta and other populations. Together with the fact that the mean stature of Mamanwas was taller than the Aeta, it was postulated that while the Aeta originated from Sundaland, the Mamanwa had roots in Wallacea, south of Mindanao (Omoto 1984). In this study, however, this hypothesis was not substantiated by the genome-wide phylogenetic analyses.
Divergence time estimates using an LD based method yielded similar results even when using different SNP data sets. However, our divergence time estimates might possibly be underestimated. In equations Ne = 1/(4c) * [(1/r2)−2] and T = 2Ne*Fst (24), where Ne is effective population size, c is recombination distance between loci, r2 is the measure of LD, and T is divergence time in generations, the estimate of T decreases with increasing LD (r2). However, large blocks of SNPs in high LD in populations that have experienced extreme genetic drift from severe bottlenecks and/or recent admixture, may lead to an underestimation of T. Indeed our results suggest that Malaysian and Philippine Negritos did experience admixture with their neighboring non-Negrito populations (figs. 1 and 2; supplementary fig. 6, Supplementary Material online). We tried to mitigate the effects of recent admixture by filtering out admixed individuals based on PCA and ADMIXTURE results.
Both our NJ (fig. 3A) and UPGMA (supplementary fig. S10, Supplementary Material online) trees show that after divergence from Europeans, the ancestral Asians subsequently split into Papuans, Negritos and East Asians, implying a one-wave colonization of Asia. This is in agreement with a previous survey using a less dense SNP microarray (HUGO Pan-Asian SNP Consortium 2009) and another study using genome sequences of Andamanese individuals (Mondal et al. 2016). This is in contrast to the study based on whole genome sequences that suggested Australian Aboriginal/Papuan first split from European/East Asians 60 ka, and later Europeans and East Asians diverged 40 ka (Malaspinas et al. 2016). This implies a two-wave migration into Asia (Reich et al. 2011), and other studies using uniparental loci and HLA genes also seem to support that idea (Oppenheimer 2012; Di et al. 2015). Although our results appear to support the single-wave model, care should be taken in interpreting the NJ and UPGMA trees, because they do not assume gene flow after population differentiation. It may be possible that East Asians and Negritos appear close in the phylogenetic tree as a result of a long-term admixture. The method applied in the treemix software (Pickrell and Pritchard 2012) may be suitable for inferring gene flow events within a phylogenetic tree, but the tree topology assuming gene flow has very low bootstrap support (fig. 3B).
We did not observe any direct links between the different Negrito groups and the African Pygmies (Biaka) (fig. 3B and supplementary fig. S12, Supplementary Material online). This is in agreement with previous results (Omoto et al. 1978, 1981; Basu et al. 2015) and suggests that observed morphological similarities among the Negritos and African pygmies are more likely due to convergent evolution. The Neighbor-Net network (supplementary fig. S7, Supplementary Material online) suggests possible common links among all three Negrito groups (except highly admixed Batak in the Palawan Island), which are not obvious in methods like PCA and ADMIXTURE (figs. 1 and 2). Previous SNP analyses suggested a link between the Andamanese and Malaysian Negritos (Chaubey and Endicott 2013; Aghakhanian et al. 2015), but studies that have shown links among all the three Negrito groups are few (Reich et al. 2011). We identified 4,313 SNPs that could probably represent genomic regions that are shared among the common ancestors of the three Negrito groups. Some of these regions may be related to the common phenotypes—such as skin pigmentation, height, and facial morphology—apparent in all Negritos (Stokowski et al. 2007; Wood et al. 2014; Adhikari et al. 2016). These SNPs are also found in IL4 and CDH13 genes which are related to malarial resistance and were candidates for positive selection in the Malaysian Negritos (Liu et al. 2015). These observed patterns may have resulted from natural selection or alternatively via genetic drift, and further analyses are required to confirm or exclude either case.
Previous studies have reported that Papuans, Melanesians, and Australian Aboriginal retain high proportions of Denisovan ancestry, ranging from 3% to 6% (Reich et al. 2011; Meyer et al. 2012; Malaspinas et al. 2016). Here we report that the Aeta have the highest proportion of Denisovan ancestry among the four Philippine Negrito groups but Andamanese and Malaysian Negritos show very low signals (<1%) of Denisovan introgression. To explain these observations, we propose four possible scenarios of Denisovan introgression (supplementary fig. S13, Supplementary Material online). Two scenarios (differing by invoking either a single wave or two waves of migration to Asia) involve a single introgression event occurred in the common ancestor of Papuans and Negritos, followed by parallel losses in Andamanese, Malaysian Negritos and East Asians (supplementary fig. S13A and B, Supplementary Material online). The differences in the distribution of Denisovan blocks between Papuans and Philippine Negritos (fig. 5) may be attributed to genetic drift or subsequent gene flow from populations that initially lacked Denisovan ancestry, such as non-Negrito Austronesian-speaking groups (supplementary fig. S6, Supplementary Material online).
Alternatively, independent episodes of Denisovan admixture may have occurred in Papuan and Philippine Negrito lineages (supplementary fig. S13C and D, Supplementary Material online). If the Denisovan admixture took place in the common ancestor of Papuans and Aeta, it must have occurred after 50 ka, which is our estimate of Papuan-European divergence. Indeed, Malaspinas et al. (2016) estimated that the Denisovan admixture happened 44 ka in the Papuan/Australian Aborigine common ancestor. Although multiple episodes of Denisovan introgression appears to be the most parsimonious model, parallel loss of Denisovan ancestry in multiple lineages could also occur via genetic drift or purifying selection if the Denisovan genetic components are deleterious, as has been argued for Neanderthal introgression (Sankararaman et al. 2014).
In summary, we demonstrated that the Negritos of Andaman Islands, Malay Peninsula, and Philippine Islands represent one of the earliest branches of anatomically modern humans to have reached SEA, befitting the term the “First Sundaland People” instead of “Negritos.” The interactions they had with the environment, the pre-existing archaic humans in the region, and much later with agriculturalist migrants from the Asian mainland have all shaped their current genetic and cultural diversity.
Supplementary Material
Supplementary data are available at Genome Biology and Evolution online.
Supplementary Material
Acknowledgments
This study was supported by JSPS KAKENHI Grant number 15K18622 awarded to T.A.J. and Grant-in-Aid (Grant no. 23247040) from JSPS to K.T. and to N.S. M.E.P. acknowledges the Ministry of Science, Technology and Innovations, Malaysia for research grant 100-RM1 Biotek 16/6/2B and Monash University Malaysia for TMBG grant. M.S. acknowledges support from the Max Planck Society. P.P.M. expresses gratitude to the Department of Biotechnology, Government of India, for financial support. We also thank Shogo Misawa and Momoki Hirai for blood sampling in the Philippines, Masako Mizuguchi for preparing perl scripts, and all the participants who provided samples and information for this study. We also thank Asian DNA Repository Consortium for agreeing the use of these precious DNA samples. The SNP genotype data used in this study are available upon request to the corresponding author, along with an appropriate approval of human genomic DNA research ethics committee of institutions to which researchers involved in the data analyses belong.
Literature Cited
- Adhikari K, et al. 2016. A genome-wide association scan in admixed Latin Americans identifies loci influencing facial and scalp hair features. Nat Commun. 7:10815.. [DOI] [PMC free article] [PubMed] [Google Scholar]
- Aghakhanian F, et al. 2015. Unravelling the genetic history of negritos and indigenous populations of southeast Asia. Genome Biol Evol. 7:1206–1215. [DOI] [PMC free article] [PubMed] [Google Scholar]
- Alexander DH, Novembre J, Lange K.. 2009. Fast model-based estimation of ancestry in unrelated individuals. Genome Res. 19:1655–1664. [DOI] [PMC free article] [PubMed] [Google Scholar]
- Barker G, et al. 2007. The ‘human revolution’ in lowland tropical Southeast Asia: the antiquity and behavior of anatomically modern humans at Niah Cave (Sarawak, Borneo). J Hum Evol. 52:243–261. [DOI] [PubMed] [Google Scholar]
- Barrows DP. 1910. The Negrito and allied types in the Philippines. Am Anthropol. 12:358–376. [Google Scholar]
- Basu A, Sarkar-Roy N, Majumder PP.. 2015. Genomic reconstruction of the history of extant populations of India reveals five distinct ancestral components and a complex structure. Proc Natl Acad Sci U S A. 113:1594–1599. [DOI] [PMC free article] [PubMed] [Google Scholar]
- Bryant D, Moulton V.. 2004. Neighbor-net: an agglomerative method for the construction of phylogenetic networks. Mol Biol Evol. 21:255–265. [DOI] [PubMed] [Google Scholar]
- Chaubey G, Endicott P.. 2013. The Andaman Islanders in a regional genetic context: reexamining the evidence for an early peopling of the archipelago from South Asia. Hum Biol. 85:153–172. [DOI] [PubMed] [Google Scholar]
- Coon CS. 1965. The living races of man. New York: Knopf. [Google Scholar]
- Delfin F, et al. 2011. The Y-chromosome landscape of the Philippines: extensive heterogeneity and varying genetic affinities of Negrito and non-Negrito groups. Eur J Hum Genet. 19:224–230. [DOI] [PMC free article] [PubMed] [Google Scholar]
- Delfin F, et al. 2014. Complete mtDNA genomes of Filipino ethnolinguistic groups: a melting pot of recent and ancient lineages in the Asia-Pacific region. Eur J Hum Genet. 22:228–237. [DOI] [PMC free article] [PubMed] [Google Scholar]
- Demeter F, et al. 2012. Anatomically modern human in Southeast Asia (Laos) by 46 ka. Proc Natl Acad Sci U S A. 109:14375–14380. [DOI] [PMC free article] [PubMed] [Google Scholar]
- Deng L, et al. 2014. The population genomic landscape of human genetic structure, admixture history and local adaptation in Peninsular Malaysia. Hum Genet. 1169–1185. [DOI] [PubMed] [Google Scholar]
- Di D, Sanchez-Mazas A, Currat M.. 2015. Computer simulation of human leukocyte antigen genes supports two main routes of colonization by human populations in East Asia. BMC Evol. Biol. 15:240. doi: 10.1186/s12862-015-0512-0. [DOI] [PMC free article] [PubMed]
- Evans IHN. 1937. The Negritos of Malaya. Cambridge University Press. Cambridge. [Google Scholar]
- Gao X, Martin ER.. 2009. Using allele sharing distance for detecting human population stratification. Hum Hered. 68:182–191. [DOI] [PMC free article] [PubMed] [Google Scholar]
- Green RE, et al. 2010. A draft sequence of the Neandertal genome. Science 328:710–722. [DOI] [PMC free article] [PubMed] [Google Scholar]
- Hill C, et al. 2006. Phylogeography and ethnogenesis of aboriginal Southeast Asians. Mol Biol Evol. 23:2480–2491. [DOI] [PubMed] [Google Scholar]
- Horai S, et al. 1981. The HLA antigens of two Negrito populations in the Philippines. Tissue Antigens 17:343–348. [DOI] [PubMed] [Google Scholar]
- Howells WW. 1973. Cranial variation in man. Papers of the Peabody Museum of Archaeology and Ethnology. Cambridge (MA).
- Huson DH, Bryant D.. 2006. Application of phylogenetic networks in evolutionary studies. Mol Biol Evol. 23:254–267. [DOI] [PubMed] [Google Scholar]
- Jinam TA, et al. 2012. Evolutionary history of continental southeast asians: early train hypothesis based on genetic analysis of mitochondrial and autosomal DNA data. Mol Biol Evol. 29:3513–3527. [DOI] [PubMed] [Google Scholar]
- Jinam TA, Phipps ME, Saitou N.. 2013. Admixture patterns and genetic differentiation in negrito groups from West Malaysia estimated from genome-wide SNP data. Hum Biol. 85:173–188. [DOI] [PubMed] [Google Scholar]
- Kanzawa-Kiriyama H, et al. 2017. A partial nuclear genome of the Jomons who lived 3000 years ago in Fukushima, Japan. J. Hum. Genet. 62:213–221. [DOI] [PMC free article] [PubMed] [Google Scholar]
- Liu X, et al. 2015. Differential positive selection of malaria resistance genes in three indigenous populations of Peninsular Malaysia. Hum Genet. 134:375–392. [DOI] [PubMed] [Google Scholar]
- Malaspinas AS, et al. 2016. A genomic history of Aboriginal Australia. Nature 538:207–214. [DOI] [PMC free article] [PubMed] [Google Scholar]
- Manichaikul A, et al. 2010. Robust relationship inference in genome-wide association studies. Bioinformatics 26:2867–2873. [DOI] [PMC free article] [PubMed] [Google Scholar]
- Matsumoto H, et al. 1979. Population genetic studies of the Philippine Negritos. II. gm and km allotypes of three population groups. Am J Hum Genet. 31:70–76. [PMC free article] [PubMed] [Google Scholar]
- McEvoy BP, Powell JE, Goddard ME, Visscher PM.. 2011. Human population dispersal ‘Out of Africa’ estimated from linkage disequilibrium and allele frequencies of SNPs. Genome Res. 21:821–829. [DOI] [PMC free article] [PubMed] [Google Scholar]
- Meyer M, et al. 2012. A high-coverage genome sequence from an archaic Denisovan individual. Science 338:222–226. [DOI] [PMC free article] [PubMed] [Google Scholar]
- Mezzavilla M, Ghirotto S.. 2015. Neon: an R package to estimate human effective population size and divergence time from patterns of linkage disequilibrium between SNPs. J Comput Sci Syst Biol. 8:37–44. [Google Scholar]
- Mijares AS, et al. 2010. New evidence for a 67,000-year-old human presence at Callao Cave, Luzon, Philippines. J Hum Evol. 59:123–132. [DOI] [PubMed] [Google Scholar]
- Mondal M, et al. 2016. Genomic analysis of Andamanese provides insights into ancient human migration into Asia and adaptation. Nat Genet. 48:1066–1070. [DOI] [PubMed] [Google Scholar]
- Nei M. 1972. Genetic distance between populations. Am Nat. 106:283–292. [Google Scholar]
- Omoto K, et al. 1978. Population genetic studies of the Philippine Negritos. I. A pilot survey of red cell enzyme and serum protein groups. Am J Hum Genet. 30:190–201. [PMC free article] [PubMed] [Google Scholar]
- Omoto K, et al. 1981. Population genetic studies of the Philippine Negritos. III. Identification of the carbonic anhydrase-1 variant with CA1 Guam. Am J Hum Genet. 33:105–111. [PMC free article] [PubMed] [Google Scholar]
- Omoto K. 1984. The Negritos: genetic origins and microevolution. Acta Anthropogenet. 8:137–147. [PubMed] [Google Scholar]
- Oppenheimer S. 2012. Out-of-Africa, the peopling of continents and islands: tracing uniparental gene trees across the map. Philos Trans R Soc Lond B Biol Sci. 367:770–784. [DOI] [PMC free article] [PubMed] [Google Scholar]
- Pagani L, et al. 2016. Genomic analyses inform on migration events during the peopling of Eurasia. Nature 538:238–242. [DOI] [PMC free article] [PubMed] [Google Scholar]
- Patterson N, et al. 2012. Ancient admixture in human history. Genetics 192:1065–1093. [DOI] [PMC free article] [PubMed] [Google Scholar]
- Patterson N, Price AL, Reich D.. 2006. Population structure and eigenanalysis. PLoS Genet. 2:2074–2093. [DOI] [PMC free article] [PubMed] [Google Scholar]
- Pickrell JK, Pritchard JK.. 2012. Inference of population splits and mixtures from genome-wide allele frequency data. PLoS Genet. 8:e1002967.. [DOI] [PMC free article] [PubMed] [Google Scholar]
- Prüfer K, et al. 2014. The complete genome sequence of a Neanderthal from the Altai Mountains. Nature 505:43–49. [DOI] [PMC free article] [PubMed] [Google Scholar]
- Purcell S, et al. 2007. PLINK: a tool set for whole-genome association and population-based linkage analyses. Am J Hum Genet. 81:559–575. [DOI] [PMC free article] [PubMed] [Google Scholar]
- Qin P, Stoneking M.. 2015. Denisovan ancestry in East Eurasian and Native American populations. Mol Biol Evol. 32:2665–2674. [DOI] [PubMed] [Google Scholar]
- Radcliffe-Brown AR. 1922. The Andaman islanders: a study in social anthropology. Cambridge University Press: Cambridge. [Google Scholar]
- Rasmussen M, et al. 2011. An Aboriginal Australian genome reveals separate human dispersals into Asia. Science. 334(6052):94–98. [DOI] [PMC free article] [PubMed] [Google Scholar]
- Reich D, et al. 2011. Denisova admixture and the first modern human dispersals into Southeast Asia and Oceania. Am J Hum Genet. 89:516–528. [DOI] [PMC free article] [PubMed] [Google Scholar]
- Saitou N. 2014. Introduction to Evolutionary Genomics. Springer: London [Google Scholar]
- Saitou N, Nei M.. 1987. The neighbor-joining method: a new method for reconstructing phylogenetic trees. Mol Biol Evol. 4:406–425. [DOI] [PubMed] [Google Scholar]
- Sankararaman S, et al. 2014. The genomic landscape of Neanderthal ancestry in present-day humans. Nature 507:354–357. [DOI] [PMC free article] [PubMed] [Google Scholar]
- Sokal R, Michener CD.. 1958. A statistical method for evaluating systematic relationship. Univ. Kans. Sci. Bull. 38:409–1438.
- Stokowski RP, et al. 2007. A genomewide association study of skin pigmentation in a South Asian population. Am J Hum Genet. 81:1119–1132. [DOI] [PMC free article] [PubMed] [Google Scholar]
- Thangaraj K, et al. 2005. Reconstructing the origin of Andaman Islanders. Science 308:996.. [DOI] [PubMed] [Google Scholar]
- The 1000 Genomes Project Consortium. 2015. A global reference for human genetic variation. Nature 526:68–74. [DOI] [PMC free article] [PubMed] [Google Scholar]
- The HUGO Pan-Asian SNP Consortium. 2009. Mapping human genetic diversity in Asia. Science 326:1541–1545. [DOI] [PubMed] [Google Scholar]
- The International HapMap Consortium. 2005. A haplotype map of the human genome. Nature 437:1299–1320. [DOI] [PMC free article] [PubMed] [Google Scholar]
- Thomas PD, et al. 2003. PANTHER: a library of protein families and subfamilies indexed by function. Genome Res. 13:2129–2141. [DOI] [PMC free article] [PubMed] [Google Scholar]
- Weir B, Cockerham C.. 1984. Estimating F-Statistics for the analysis of population structure. Evolution 38:1358–1370. [DOI] [PubMed] [Google Scholar]
- Wood AR, et al. 2014. Defining the role of common variation in the genomic and biological architecture of adult human height. Nat Genet. 46:1173–1186. [DOI] [PMC free article] [PubMed] [Google Scholar]
Associated Data
This section collects any data citations, data availability statements, or supplementary materials included in this article.