

Abstract
Vertebrate hearing organs manifest cellular asymmetries across the radial axis that underlie afferent versus efferent circuits between the inner ear and the brain. Therefore, understanding the molecular control of patterning across this axis has important functional implications. Radial axis patterning begins before the cells become postmitotic and is likely linked to the onset of asymmetric expression of secreted factors adjacent to the sensory primordium. This study explores one such asymmetrically expressed gene, Wnt9a, which becomes restricted to the neural edge of the avian auditory organ, the basilar papilla, by embryonic day 5 (E5). Radial patterning is disrupted when Wnt9a is overexpressed throughout the prosensory domain beginning on E3. Sexes were pooled for analysis and sex differences were not studied. Analysis of gene expression and afferent innervation on E6 suggests that ectopic Wnt9a expands the neural-side fate, possibly by re-specifying the abneural fate. RNA sequencing reveals quantitative changes, not only in Wnt-pathway genes, but also in genes involved in axon guidance and cytoskeletal remodeling. By E18, these early patterning effects are manifest as profound changes in cell fates [short hair cells (HCs) are missing], ribbon synapse numbers, outward ionic currents, and efferent innervation. These observations suggest that Wnt9a may be one of the molecules responsible for breaking symmetry across the radial axis of the avian auditory organ. Indirectly, Wnt9a can regulate the mature phenotype whereby afferent axons predominantly innervate neural-side tall HCs, resulting in more ribbon synapses per HC compared with abneural-side short HCs with few ribbons and large efferent synapses.
SIGNIFICANCE STATEMENT Wnts are a class of secreted factors that are best known for stimulating cell division in development and cancer. However, in certain contexts during development, Wnt-expressing cells can direct neighboring cells to take on specific fates. This study suggests that the Wnt9a ligand may play such a role in the developing hearing organ of the bird cochlea. This was shown through patterning defects that occur in response to the overexpression of Wnt9a. This manipulation increased one type of sensory hair cell (tall HCs) at the expense of another (short HCs) that is usually located furthest from the Wnt9a source. The extraneous tall HCs that replaced short HCs showed some physiological properties and neuronal connections consistent with a fate switch.
Keywords: axon guidance, cochlea, hair cells, patterning, Wnt
Introduction
Vertebrate hearing organs show tremendous variability over the course of evolution (Manley, 2017) while also sharing mechanosensory hair cells (HCs) as their primary receptors. Despite their variability, significant organizational homologies remain. The auditory organs of birds and mammals show similar specializations across the radial axis (Fuchs, 1992). The bird basilar papilla (BP) is populated by tall HCs (THCs) and short HCs (SHCs), although some gradation in size is apparent. THCs and the inner HCs (IHCs) of mammals are each positioned on the “neural” side of the organ, so called because of its proximity to the auditory ganglion (AG). These HCs make many afferent synapses with the peripheral processes of the auditory/spiral ganglion neurons, thereby alerting the brain to sound stimuli. SHCs and the outer HCs (OHCs) of mammals each reside on the “abneural” side and primarily receive efferent synaptic input from the brain (Tanaka and Smith, 1978; Fischer, 1992). In addition, small efferent terminals interact with THCs and some afferents contact SHCs.
The acquisition of different cell fates and connectivity across the organ likely requires the action of secreted ligands during embryogenesis. Asymmetric expression of Wnts and other signaling molecules (Fgfs, Bmps) influences radial patterning of the mammalian cochlea (Groves and Fekete, 2012). Likewise, in the BP on embryonic days 5 and 6 (E5–E6), before the first prosensory cells cease dividing, Wnt7b is expressed by abneural sensory cells, whereas Wnt7a and Wnt9a are present in a neural-side nonsensory domain (Sienknecht and Fekete, 2008). Wnt responsiveness and Wnt effects on cochlear proliferation have been explored in cultured chicken cochleas (Jacques et al., 2014). In addition to boosting proliferation, the regulation of cell patterning by Wnts (and Bmp) signaling was demonstrated using mouse cochlea organ cultures: the neural (IHC) compartment was enlarged and specification of the abneural (OHC) compartment was inhibited by Wnt activators (Munnamalai and Fekete, 2016). Both approaches involved pharmacological manipulations of the canonical Wnt-β-catenin signaling pathway. Potential problems with this approach are teasing apart off-target effects, activation of genes downstream of several potential Wnt ligands, bypassing the roles of Wnt receptors and secreted Wnt inhibitors, and a recognition that the involvement of β-catenin does not necessarily equate to a requirement for a Wnt ligand because β-catenin can interplay with other pathways (Itasaki and Hoppler, 2010; Collu et al., 2014). Morever, pharmacological approaches preclude being able to pinpoint the effects of an individual Wnt ligand. Finally, the organ cultures did not include the ganglion or brainstem and thus could not address changes in afferent and efferent innervation when confronted with alterations in cell types within the sensory epithelium. The current study was performed in vivo to address some of these questions.
One way to assess the bioactivity of a specific ligand is to misexpress a candidate molecule before specific cellular phenotypes manifest and look for phenotypic transformations. This approach was used to reveal a role for Bmp7 and retinoic acid in patterning HC size and sterociliarly morphology along the longitudinal (tonotopic) axis of the BP (Mann et al., 2014; Thiede et al., 2014). Here, we explore the molecular basis of patterning the organ's orthogonal axis, focusing on Wnt9a. We hypothesized that an asymmetric source of Wnt9a might endow neighboring sensory cells with neural-side identities. To test this idea, we overexpressed Wnt9a in the otocyst using retrovirus-mediated gene transfer. This created a wider BP with greatly expanded neural-side identity based on gene expression, neurite projections, and HC anatomy and physiology. THCs differentiated across the entire organ, whereas SHCs were missing. In summary, Wnt9a has the appropriate spatiotemporal expression in the normal avian cochlea to influence its radial patterning and, indeed, when overexpressed, it can change the local identity, cell fates, and innervation of the auditory sensory organ.
Materials and Methods
Virus injection.
Avian retrovirus encoding full-length chicken Wnt9a (formerly Wnt14) was generated by transfecting UMNSAH/DF-1 chicken embryo fibroblasts (ATCC #CRL-12203) with pRCAS(A)/Wnt9a plasmid DNA (Hartmann and Tabin, 2001). Growth and titration of virus on UMNSAH/DF-1 cells were performed as described previously (Morgan and Fekete, 1996). Specific pathogen-free G. gallus eggs (Charles River Laboratories) were windowed on E2, incubated at 38°C, and injected with concentrated RCAS(A)-derived viruses (1–2 × 10⁹ infectious units/ml) into the E2 otic mesenchyme or E3 otic vesicle, as described previously (Stevens et al., 2003). Embryos were incubated in ovo until harvest. No sex determination was performed and all male and female embryos were pooled together. A total of 268 Wnt9a-overexpression (Wnt9a-OE) embryos and 18 RCAS(A) embryos from 28 batches survived the injection procedure to be analyzed histologically between E6 and E19. In all experiments, the left uninjected control BP was compared with the right Wnt9a-injected BP unless specified otherwise. An additional nine Wnt9a-OE embryos and five RCAS(A) embryos from six injection batches were subjected to electrophysiological analysis on E18–E20. For RNA sequencing, 6 injection batches were used to obtain 144 right BPs 3 d after injection of virus into the right E3 otocyst, with half Wnt9a-OE injected and half RCAS(A) injected.
Histology and transmission electron microscopy.
Embryos were fixed in 4% paraformaldehyde in PBS either by immersion or by transcardiac perfusion. For cryosectioning, BPs were processed through graded sucrose solutions and frozen in either 7.5% sucrose/15% gelatin/PBS or TFM tissue freezing medium (TBS). Other BPs were processed as whole mounts after fixation. For immunolabeling studies, primary antibodies from the Developmental Studies Hybridoma Bank (DSHB) were as follows: otoferlin/HCS-1 (antibody registry-AB_10804296; DSHB #HCS-1; 1:50; Goodyear et al., 2010), 3A10 (AB_531874; #3A10; 1:50; Sienknecht and Fekete, 2008), and AMV-3C2 (AB_528098; #AMV-3C2; 1:40; Potts et al., 1987). Ribbon synapses were immunolabeled with anti-CtBP2 (BD Transduction Laboratories #612044; 1:300; Khimich et al., 2005; Wahlin et al., 2008). Samples were processed for diaminobenzidine (DAB) colorimetric staining according to manufacturer's protocol (Vector Laboratories), or with fluorescent secondary antibodies (1:500; Invitrogen). For TEM studies, an E18 embryo was harvested and the inner ear epithelium exposed, after which the head was immersed in 2% paraformaldehyde/2% glutaraldehyde in 0.1 m cacodylate buffer (CB), pH 7.4, overnight at 4°C. Isolated BPs were washed 3 times in 0.1 m CB, postfixed with 1% OsO4/0.1 m CB for 1 h before washing in CB and water. Samples were dehydrated in an ascending ethanol series and once in propylene oxide (PO). Samples were infiltrated with sequential PO:Epon solutions (3:1, 1:1, 1:3 overnight) and then 100% Epon for 6 h. Semithin sections were stained with toluidine blue. Thin sections were collected and imaged on an FEI/Philips CM-10 transmission electron microscope using an accelerating voltage of 80 kV.
HC morphometric analysis.
Dissected BPs of a series of embryos ranging from E10 to posthatch day 35 were fixed in 4% paraformaldehyde/1% glutaraldehyde in PBS and postfixed in 2% OsO4 in PBS before Durcupan (EMS) embedding. A series of BP cross-sections (5 μm) were stained with toluidine blue (Sigma-Aldrich). HC height and widths were measured in radial cross-sections at 30%, 50%, 70%, and 90% locations from the proximal end using the Soft Imaging System (SIS; Olympus). A third-order polynomial line was fitted to visualize the trend of HC measurement distributions (see Fig. 1).
Figure 1.

Changes in HC morphometrics from E12 to E18 in the BP. Top row, Spatiotemporal divergence of HC phenotypes was visualized by plotted height (diamond) and width (triangle) measurements of HC bodies across the radial axis of the BP at 30%, 50%, 70% and 90% distance from the proximal end (the base). The cell bodies of HCs are 2–3 times as tall as they are wide along most of the organ, although abneural HCs appear shorter in the proximal BP on E12 (left column, n = 116 cells). At E18, throughout at least the proximal 70% of the BP, we now observe taller HCs on the neural side and wider HCs on the abneural side; this reflects the ongoing maturation of THCs and SHCs (right column, n = 143 cells). These examples represent the analysis of n = 1 for E12 and n = 7 embryos for E18. Bottom row, Distribution of height (diamond) and width (triangle) measurements of each HC at the 50% positions shows a clear dichotomy of THCs and SHCs on E18 compared with E12.
HC counts were performed on single 15 μm cryostat sections that were immunostained for HCS-1 and axons (3A10); HCS-1-positive cells from all focal planes were included in the counts when a clearly identified nucleus surrounded by HCS-1 immunoreactivity was observed in the HC layer.
Efferent labeling.
NeuroVue red-plus nylon filters coated with lipophilic dye (Molecular Targeting Technologies) were used to trace the BP efferents. After perfusion–fixation on E17–E19, the cerebellum was removed to reveal the brainstem. Filter strips of ∼0.5 × 4 mm size were inserted bilaterally below the vestibular nuclei with their long axis aligned with the anterior posterior dimension and their short axis angled at 35–45° from the midline (dorsal nearer to the midline than ventral). This targets the cell bodies of the octavolateral efferents (Rasmussen, 1946; Whitehead and Morest, 1981; Zidanic and Fuchs, 1995). Because contralaterally projecting efferent axons would be cut near the dorsal midline when the filters are inserted and pushed ventrally, this method is expected to label only ipsilateral efferents. The heads were incubated in 4% paraformaldehyde at 37°C for 3–4 weeks, after which the AGs and BPs were isolated and imaged.
Statistical analysis.
Tests were selected after confirming normal distributions of the data. Statistical significance was determined based on the test used and p-values are listed in the figure legends. A blinding protocol was not used in these analyses. Statistical tests and estimates of variance were performed using the following statistical software: Prism (GraphPad), JMP (SAS Institute), and SAS (SAS Institute). To quantify HCs and CtBP2 foci, high resolution z-stack images were acquired with the 60× objective on the neural and abneural edges at the 33–40% and 60–66% positions along the longitudinal axis of the BP with 0% at the proximal end. Each rectangular sample area was parallel to the long edge of the BP offset from the edge by the width of one sample area (∼60 μm) and encompassed 10,350 μm2, which is more than twice the length of the areas shown in Figure 3B. CtBP2 foci were counted manually through z-stacks visualized with the Nikon NIS elements image processing software. The number of ribbon foci per HC was quantified based on the superimposition of CtBP2-positive puncta with HCS-1 cytoplasmic labeling of individual HCs. Statistical significance was determined with a two-tailed t test with Bonferroni adjustment (α = 0.05/12 = 0.0042).
Figure 3.
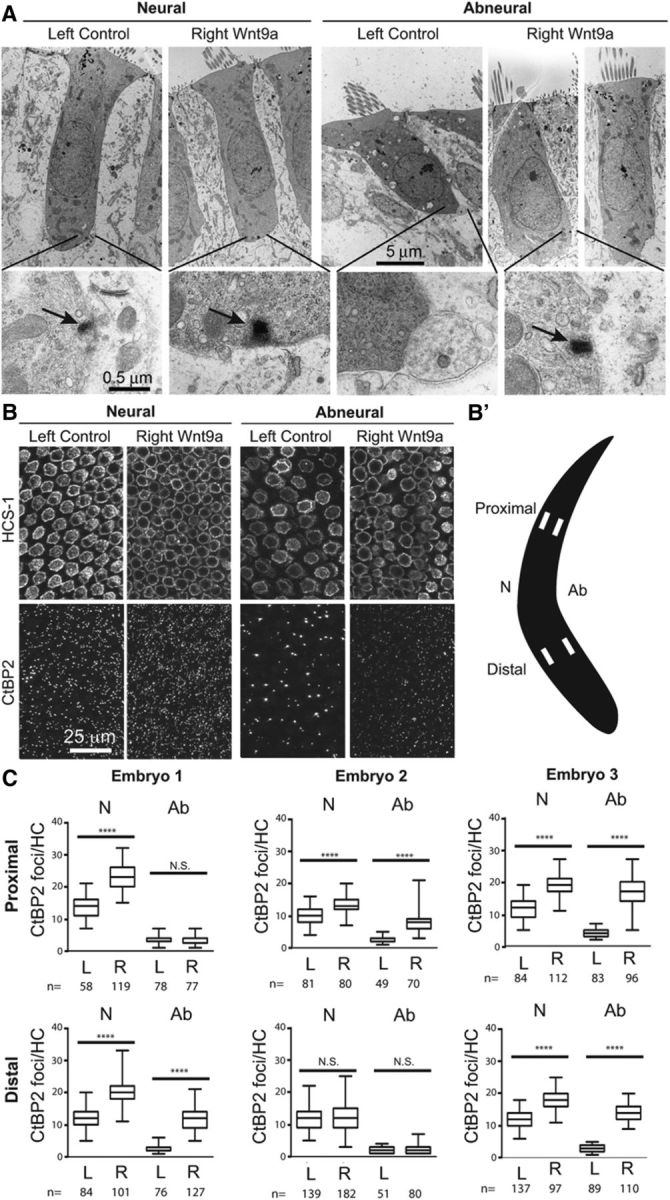
Wnt9a-OE alters HC morphology and increases ribbon foci on E18. A, On the neural side, THCs in a left control BP are compared with the right Wnt9a-OE BP shown with presynaptic ribbon (arrows, insets). On the abneural side, the SHCs are strikingly shorter and wider in the left control BP than the THC-like cells in the Wnt9a-OE BP. These images are from 50% longitudinal positions. (n = 1 embryo). B, Neural and abneural domains were sampled from the distal third (66% position from the base) of the left and right BPs of Embryo 1. In the left BP, CtBP2-positive ribbons per HC were higher for THCs on the neural side than for SHCs on the abneural side. The number of ribbons was higher in Wnt9a-OE neural THCs than in control neural THCs. For the abneural THC-like cells of Wnt9a-OE BPs, the number of ribbons increased to levels similar to those of neural THCs on the left BP. B′, Schematic of sampled areas for ribbon quantification. C, Numbers of CtBP2 puncta per HC were quantified from three different embryos at four locations per BP in response to Wnt9a-OE (right sides, R) and compared with controls (left sides, L). Distributions are indicated as median (bar), 25–50% and 50–75% quartiles (boxes) and range (whiskers). Statistical analysis was performed with a two-tailed t test. ****p < 0.0001 (n = number of cells; n = 3 embryos). For Embryo 1, there was a significant increase in the number of CtBP2 puncta per HC (left vs right) at the proximal–neural location (14 ± 0.4 vs 23 ± 0.4; df = 175), but not the proximal abneural location (3.5 ± 0.2 vs 3.4 ± 0.1; df = 155). Ribbons per HC increased at the distal–neural (12 ± 0.3 vs 20 ± 0.4; df = 183) and distal abneural (2.4 ± 0.1 vs 12 ± 0.3; df = 160) locations (B). For Embryo 2, the number of ribbons per HC increased at the proximal neural (10 ± 0.3 vs 13 ± 0.3; df = 159) and proximal abneural (2.7 ± 0.1 vs 8.2 ± 0.4; df = 83) locations, but not at the distal neural (12 ± 0.3 vs 13 ± 0.3; df = 319) or distal abneural (2.1 ± 0.2 vs 2.1 ± 0.2; df = 129) locations. For Embryo 3, the number of ribbons per HC increased at the proximal neural (12 ± 0.4 vs 19 ± 0.3; df = 194), proximal abneural (4.1 ± 0.1 vs 17 ± 0.5; df = 108), distal neural (12 ± 0.2 vs 18 ± 0.3; df = 232), and distal abneural (2.9 ± 0.1 vs 14 ± 0.2; df = 158) locations. L, Left control BP; R, right Wnt9a-OE.
BP width measurements were quantified on ImageJ at each percentage position along the longitudinal axis and significance was determined with a one-tailed paired t test with Bonferroni adjustment (α = 0.05/8 = 0.006). Widths were measured by outlining the natural curvature of apical edge of the BPs (i.e., the sensory region only) from the neural to abneural side.
PH3+ cells were counted (within the sensory region only) from every third section through the BP and analyzed based on stage of development. A generalized linear mixed model with a least-squares method to fit the linear regression and a random embryo effect was used to evaluate side (left/right; represents treatment condition), stage of development, and their interactions. The analysis takes into account repeated measures on embryos (independence between embryos but dependence within an embryo). Post hoc Tukey's multiple-comparisons analysis was used to determine significance.
Whole-cell voltage-clamp electrophysiology.
HC physiology was assessed by recordings from semi-intact BPs from embryos between E18 and E20, as described previously (Li et al., 2009). Temporal bones were extracted into extracellular fluid (ECF) consisting of the following (in mm): 154 NaCl, 6 KCl, 5 CaCl2, 2 MgCl2, and 5 HEPES, pH 7.4, and the BPs were placed into ECF with 0.01% protease (type XXIV; Sigma-Aldrich) for 1–5 min. Segments of the sensory epithelium, ∼1 mm in length, were excised from a region between 50% and 75% distance from the basal end of the BP and mounted in a recording chamber containing ECF such that recordings could be made from HCs lining the neural or abneural edge. Current–voltage relationships were generated for four experimental groups: neural and abneural HCs from Wnt9a-OE and left BPs. Recordings from Wnt9a-OE BPs were limited to only those exhibiting morphological evidence of Wnt9a activity (i.e., increased width or presence of ectopic otoconia), although sampling regions were selected from longitudinal positions devoid of otoconia. Data were acquired with a Multiclamp 700B and Digidata 1440A under pCLAMP software control (Molecular Devices). Glass electrodes were filled with an internal solution containing the following (in mm): 112 KCl, 0.1 CaCl2, 2 MgCl2, 11 EGTA, 10 HEPES, 5 Na2ATP, 15 4-aminopyridine, and 8 glucose, buffered to pH 7.2 with KOH. To isolate calcium-sensitive currents, preparations were locally perfused with ECF constructed without CaCl2. All recordings were made at 21–24°C. Leak currents were subtracted offline. Voltages were not corrected for junction potentials.
In situ hybridization.
For whole mounts, embryos were harvested on E7 (stage 30–31) and BPs were dissected in sterile HBSS (Sigma-Aldrich). Both the left and the right BPs were dissected and processed together for in situ hybridization. They were fixed with 4% paraformaldehyde in PBS and subjected to an ethanol dehydration series of 50%, 70%, 90%, and 100% ethanol, followed by brief washes with xylene and then 100% ethanol washes. Digoxigenin (DIG)-labeled antisense probes were synthesized with DIG-RNA labeling mix (Roche). Whole mounts were hybridized with 1 μg antisense probes to Wnt9a or Ser1, transcribed from plasmid templates, for 2 d at 70°C. Samples were incubated overnight at 4°C with alkaline phosphatase (AP)-conjugated anti-DIG antibody (Roche) and washed with Tris buffer, pH 9.5. The AP reaction was developed with nitroblue tetrazolium/5-bromo-4chloro-3-indolyl-phosphate or BM purple (Roche) and postfixed with 4% paraformaldehyde. In situ hybridization protocols and probes for Wnt9a, Ser1, Fzd10, Sfrp2, Wnt7b, and Wnt5b were described previously (Sienknecht and Fekete, 2008, 2009). The Sema3D probe was made using published primers (Jin et al., 2006).
RNA sequencing.
The right otocyst was injected with RCAS(A) parent virus for controls and with RCAS(A)-Wnt9a for experimental subjects. Both groups were killed on E6 (stage 28–30) and the infected right BP was separated from the lagena macula, saccular macula, and the bulk of the AG. Freshly isolated BPs were pooled and homogenized in QIAzol. Three biological samples consisting of a pool of 24 BPs per condition were prepared for sequencing. Total RNA was extracted using the miRNeasy kit (Qiagen). Quality control for total RNA samples with an RNA Integrity Number (RIN) ≥ 8 were validated on an Agilent Technologies Bioanalyzer. cDNA libraries were constructed using the TruSeq Stranded kit (Illumina). The transcriptome was sequenced on an Illumina HiSeq2500 platform with >60 million paired reads per sample. Fragments were aligned to the Galgal4 Ensembl G.gallus genome database version 83.4 using Tophat2 (Kim et al., 2013). DESeq2 (Love et al., 2014) and EdgeR were used to identify differentially expressed genes with a false discovery rate ≤ 0.05 (Robinson et al., 2010). Ingenuity pathway analysis was performed on the Edge R analysis to identify canonical pathways that were overrepresented among the differentially expressed genes. Pathways were considered to be significantly overrepresented if p < 0.05, calculated using Fisher's exact test. The full dataset of differentially expressed genes can be downloaded from the Gene Expression Omnibus database (GEO accession #GSE95295).
Confocal imaging and image processing.
Images of in situ hybridization, dye-labeled AGs, and DAB-stained samples were acquired on a Nikon Eclipse E800 epifluorescence microscope equipped with differential interference contrast optics and a Spot digital camera. Immunolabeled or NeuroVue-labeled whole-mount BPs were imaged on a Nikon Eclipse 90i confocal microscope. Z-stacks of low-magnification images were acquired with a 20×, 0.75 numerical aperture (NA) objective. Z-stacks of high-magnification images were acquired with a 60×, 1.4 NA oil objective. Figures were assembled with Adobe Illustrator and/or Photoshop CS6.
Results
Forced expression of Wnt9a alters radial patterning of the BP
Young HCs are uniformly tall and narrow before diverging into THCs and SHCs by the third week in ovo. Between E12 and E18, abneural HCs become progressively shorter and wider, whereas the neural HCs maintain their shape (Fig. 1) (Fischer, 1992). Long before HC morphologies diverge, radial asymmetries within the BP are present by E6 in cell birthdates (Katayama and Corwin, 1989) and gene expression patterns (Sienknecht and Fekete, 2008). This suggests that secreted factors may orchestrate radial asymmetries on or before E6. We first considered Wnt9a as a candidate ligand for this function based on the timing and distribution of its transcripts and the simultaneous presence of six different Wnt receptors. Wnt9a is localized to the neural half of the BP on E4.5 and, on E5, it withdraws from the sensory organ and is confined to a neural-side nonsensory domain that will become the homogene cells (Sienknecht and Fekete, 2008). It extends along the entire longitudinal axis on E6 (Fig. 2A, arrowhead) and remains there through E10 (data not shown). Therefore, the prosensory domain is poised for Wnt responsiveness before HCs and their associated supporting cells are born.
Figure 2.
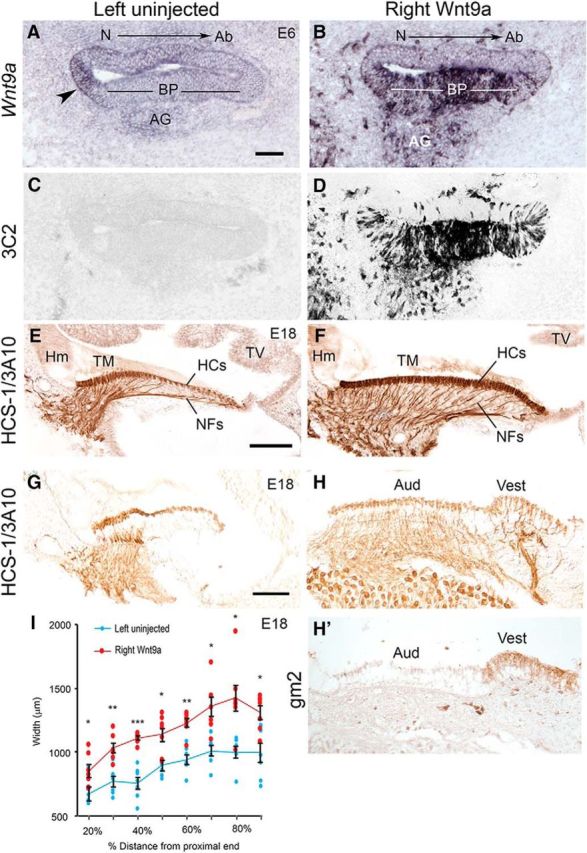
Viral-mediated Wnt9a-OE alters radial patterning of the BP. A, Left control BP showing endogenous Wnt9a in a neural-side nonsensory domain (arrowhead) that will become the homogene cells. B, Right BP showing overexpression of Wnt9a transcripts on E6 that is comparable to 3C2 labeling of the viral gag protein (D), which is absent in the left BP (C). E, Control E18 BP immunolabeled for HCs (HCS-1) and axons (3A10) at 70% along longitudinal axis. F, Right BP showing increased numbers of THCs and innervation across the sensory domain at 70% along longitudinal axis. G–H′, In some Wnt9a-OE specimens, ectopic patches of otoconia were present along the abneural edge; beneath these ectopic otoconia, the BP was positive for gm2, a further indication of vestibular organ identity (30% along longitudinal axis). I, Pairwise (left vs right) comparison of BP width measurements (across the radial axis) at 10% longitudinal intervals from the proximal end on E18 (stage 39.5–45; n = 7 embryos). Blue circles (left uninjected) and red circles (right Wnt9a-OE BPs) came from the same set of embryos. Calculated widths (mean ± SEM) at each longitudinal position (%) for left versus right sides, respectively, are as follows: 20% (670 ± 53 vs 847 ± 49), 30% (766 ± 39 vs 1028 ± 38), 40% (755 ± 48 vs 1104 ± 15), 50% (892 ± 42 vs 1136 ± 49), 60% (938 ± 38 vs 1225 ± 33), 70% 1008 ± 43 vs 1355 ± 75), 80% (998 ± 44 vs 1422 ± 104), and 90% (993 ± 76 vs 1309 ± 52). The difference between left and right mean widths was statistically significant at each location using a one-tailed paired t test. *p < 0.006, **p < 0.001, ***p < 0.000006, df = 6. Ab, abneural; Hm, homogene cells; N, neural side; NFs, neurofilaments; TM, tectorial membrane; TV, tegmentum vasculosum. Scale bar, 100 μm.
To test whether exposure to Wnt9a could influence the acquisition of distinct radial cell fates, we used the RCAS(A) retroviral vector to overexpress Wnt9a in the developing otocyst by viral injections on E3. Three days after injection, ectopic Wnt9a transcripts were widely distributed across the BP with a labeling pattern resembling the RCAS viral gag epitope recognized by the 3C2 antibody compared with left controls (Fig. 2B–D). An initial batch of embryos received RCAS(A) parent virus inoculum into the right periotic mesenchyme on E2 (stage 11.5–14) (Hamburger and Hamilton, 1951), followed by injection of RCAS(A)-Wnt9a virus into the lumen of the right otocyst the next day (stage 16–18). This approach should confine Wnt9a-bioactive virus primarily to the otic epithelium (Stevens et al., 2003). Embryos surviving to E18 (7/23) varied between stages 39.5 and 45, indicating developmental delays in some specimens. BPs with Wnt9a overexpression (Wnt9a-OE) were more heavily innervated compared with the left sides (Fig. 2E,F). Strikingly, differentiated HCs appeared to be tall and narrow across the width of the BP after Wnt9a-OE and this was consistent throughout the entire longitudinal axis. This manipulation also produced another qualitatively distinct phenotype in a subset of samples: ectopic vestibular sensory patches. When present, ectopic otoconia were located along the extreme abneural edge of the BP. In one sample, the vestibular identity of a patch underlying these ectopic otoconia was confirmed with an anti-gm2 antibody that labels vestibular but not auditory supporting cells (Fig. 2G,H′; Goodyear et al., 1994). Pre-infection of the mesenchyme with parent virus reduced the incidence of ectopic otoconia from 18% to 7% in Wnt9a-OE BPs. Because vestibular conversion was a relatively modest effect and was reported previously in response to overexpression of activated β-catenin (Stevens et al., 2003), this report is focused instead on the cell fate changes arising within the bulk of the BP that retains an auditory identity.
By E18, Wnt9a-OE BPs were significantly wider throughout all longitudinal positions, with an average increase in width of 36% (Fig. 2I). These wider BPs accommodate a larger number of cells. HC counts were taken from single sections at the 50% longitudinal position through the same BPs quantified in Figure 2I. More HCs were present in the right Wnt9a-OE BPs compared with the uninjected left BPs with a right/left ratio of 1.43 ± 0.25 (mean±SD; n = 7). This difference was statistically significant (one-tailed paired t test, p < 0.001).
HCs differentiate with an increased number of presynaptic ribbons in response to Wnt9a-OE
Because all HCs start out tall and narrow, the apparent absence of the SHC phenotype might simply reflect a developmental delay in response to Wnt9a-OE. To further assess HC differentiation by transmission electron microscopy, we selected a specimen pair in which the right (Wnt9a-OE) BP was obviously wider than the left. Semi-thin cross-sections through the BP at approximately the 50% longitudinal position confirmed the presence of SHCs only on the left side. Nearby thin sections taken from the same blocks showed well developed HCs across the width of both BPs (Fig. 3A). HCs contained electron-dense cytoplasm, a centrally located nucleus, enrichment of mitochondria above the nucleus, and an elongated stereociliary bundle that terminated in a defined cuticular plate. Control SHCs received an efferent terminal. Ribbon foci were identified near the plasma membrane of both neural and abneural HCs. However, a ribbon found in an abneural Wnt9a-OE HC faced a supporting cell rather than an afferent terminal, suggesting the presence of a hemisynapse (Fig. 3A, abneural, right Wnt9a-OE). On the abneural half of infected organs, HCs were indistinguishable from the THCs on the neural side of either the same (right) BP or the opposite (left) BP. Because differentiated THC-like cells were present abneurally and the SHC phenotype was missing, it is possible that high Wnt9a exposure imposed a neural-side fate throughout the organ, with the THC morphology being one obvious readout of this identity shift.
THCs are more densely packed and normally form significantly more presynaptic ribbons than SHCs. These features extended to the abneurally located THC-like cells in Wnt9a-OE BPs. Both neural THCs and abneural THC-like cells contained excess ribbons, identified by immunostaining for CtBP2 (Fig. 3B). Figure 3B′ indicates schematically the sampling regions used for quantitative analysis of ribbon numbers from the BPs of three embryos. Two of three embryos sampled at the 66% position from the base (distal) showed statistically significant increases in the number of ribbons per HC on both the neural and abneural sides (Fig. 3C); this includes Embryo 1 with a portion of the distal sample regions shown in Figure 3B. Likewise, at a more proximal (33–40%) position, all three embryos showed increases in the number of ribbons per HC on the neural side, and two of three embryos showed increases on the abneural side (Fig. 3C). In total, only 3 of the 12 left–right comparisons did not show changes in ribbon numbers in reponse to Wnt9a-OE. Because there was no systematic localization of these unresponsive regions, they may reflect insufficient viral infection; this could not be verified due to CtBP2 antibody incompatibility with the 3C2 antibody. The observation that neural-side HCs had more ribbons than normal is notable. This suggests either that Wnt9a-OE created a “super” THC phenotype on the neural side that was perhaps linked to the increased afferents or that synapse maturation was altered. Qualitatively, the numerous ribbon foci that emerged in the Wnt9a-OE condition appeared smaller than in the uninjected controls.
Wnt9a-OE alters outward currents in abneural HCs
Whole-cell patch-clamp recordings of cells from E18 BPs showed that THCs (neural) and SHCs (abneural) exhibited characteristic electrical features in controls. THCs expressed two major outward potassium currents, including a slow delayed rectifier current and a fast, calcium-sensitive potassium current that appears after E18 (Fuchs and Sokolowski, 1990). In contrast, SHCs exhibit an inactivating A-type potassium current. We observed that outward potassium currents from HCs along the neural edge were rapidly activating regardless of treatment condition. Transient A-type currents were found in control abneural HCs. Interestingly, both of these electrical signatures were found among abneural HCs upon Wnt9a-OE (Fig. 4A). Overall, the magnitude and voltage sensitivity of steady-state currents of abneural HCs from Wnt9a-OE BPs were more similar to THCs of either treatment condition (Fig. 4B, left). Steady-state current amplitudes elicited by voltage steps to +20 mV were significantly different across treatment groups (Table 1). Specifically, the average current amplitude at this voltage step was 3.8-fold greater in Wnt9a-OE abneural HCs than in control abneural SHCs, but not significantly different from the control or Wnt9a-OE neural HCs. For the fast-activating potassium current (IKf), the amplitudes in Wnt9a-OE abneural HCs increased by 1.7-fold compared with control abneural SHCs (difference not significant). Interestingly, the fast current amplitudes in Wnt9a-OE abneural THC-like cells were also not significantly different from control neural THCs (Fig. 4B, right; Table 2). Cells were exposed to extracellular solution with and without CaCl2 to further examine acquisition of IKf because this current arises from BK-type potassium channels that are activated by the influx of Ca2+ from voltage-dependent calcium channels (Jiang et al., 1997; Li et al., 2009). Removal of extracellular calcium reduced the amplitude of the outward current and slowed the activation time constant for HCs in Wnt9a-OE BPs located along both the neural and abneural aspects of the BP (Fig. 4C). Therefore, abneural HCs appear to demonstrate intermediate characteristics between normal THCs and SHCs.
Figure 4.

Wnt9a-OE alters the physiological properties of HCs on the abneural side of the BP on E18. A, Voltage-dependent responses of neural and abneural HCs from control and Wnt9a-OE BPs. Currents were elicited by voltage steps from a holding potential of −60 mV with steps ranging from −80 to +40 mV in 5 mV increments (responses to 20 mV increments, bottom left, are shown for clarity). Fast current components were measured 3 ms after the onset of the voltage steps (arrows). Two examples are shown from Wnt9a-OE abneural HCs, one with fast, noninactivating THC-like currents and one with SHC-like inactivating currents. B, Current–voltage relationships at +20 mV for steady-state currents measured at the end of the activation step and for fast current components (IKf) measured 3 ms after the onset of the voltage step. See Tables 1 and 2 for statistical analyses of these data. C, Removal of extracellular Ca2+ reduced the amplitude of the outward current and slowed the activation time constant for HCs in Wnt9a-OE BPs located along the neural and abneural aspects of the BP (n = 3–5 cells; n = 4 embryos).
Table 1.
Steady-state current amplitudes (pA) of HCs at +20 mV holding potential
| Location of HC | Mean ± SEM | No. of cells |
|---|---|---|
| Control | ||
| Neural (CN) | 540 ± 164 | 4 |
| Abneural (CAb) | 115 ± 25 | 7 |
| Wnt9a-OE | ||
| Neural (WN) | 651 ± 159 | 9 |
| Abneural (WAb) | 439 ± 48 | 25 |
| Degrees of freedom | ||
| Between groups | 3 | |
| Within groups | 41 | |
| Comparisons (p-value) | ||
| CAb vs WAb | 0.0016* | |
| CN vs CAb | 0.0073* | |
| CAb vs WN | 0.0109* | |
| WN vs WAb | 0.0950 | |
| CN vs WAb | 0.4650 | |
| CN vs WN | 0.6829 |
*p < 0.05, one-way ANOVA, post hoc Bonferroni–Holm test.
Table 2.
Fast potassium current (IK,f) amplitudes (pA) of HCs at + 20 mV holding potential
| Location of HC | Mean ± SEM | No. of cells |
|---|---|---|
| Control | ||
| Neural (CN) | 541 ± 184 | 3 |
| Abneural (CAb) | 190 ± 31 | 6 |
| Wnt9a-OE | ||
| Neural (WN) | 533 ± 132 | 9 |
| Abneural (WAb) | 327 ± 38 | 24 |
| Degrees of freedom | ||
| Between groups | 3 | |
| Within groups | 38 | |
| Comparisons (p-value) | ||
| CAb vs WAb | 0.0900 | |
| CN vs CAb | 0.0293* | |
| CAb vs WN | 0.0585 | |
| WN vs WAb | 0.0484* | |
| CN vs WAb | 0.0913 | |
| CN vs WN | 0.9752 |
*p < 0.05, one-way ANOVA, post hoc Bonferroni–Holm test.
Wnt9a-OE alters efferent neurite patterning across the radial axis of the BP
To observe efferent innervation, axons were anterogradely labeled by the insertion of lipophilic dyes near their cell bodies (Whitehead and Morest, 1981) on E18 (stages 39.5–45). AGs and BPs were separated for imaging. In controls, efferents traveled longitudinally as a coherent bundle along the abneural edge of the ganglion, split into several major branches, and then turned to penetrate the BP (Fig. 5A; Zidanic, 2002). Efferents were mostly confined to the proximal half of the BP as expected (Fig. 5B). Small-caliber fibers with numerous fine boutons projected into the neural side. Thicker and straighter radial fibers and bundles advanced abneurally (Fig. 5D, arrow). Because our analysis was confined to embryonic stages, we did not observe the large, cup-shaped terminals onto SHCs described for 3-week-old chicks (Zidanic, 2002). To correlate efferent trajectories with HC types, we postprocessed for CtBP2. There was an abrupt change in ribbon density that correlated with the pentration of axons into the BP at the so-called habenula perforata; this obviously segregated the normal BP into two distinct domains: neural and abneural (Fig. 5C,D).
Figure 5.

Wnt9a-OE increased ribbon synapses and decreased efferent branching into the BP on E18. A, Efferent bundle runs longitudinally along the abneural edge of the AG then branches radially toward the habenula perforata. B, Efferent projections within the control BP. C, D, Density of ribbon foci differs markedly on either side of the habenula perforata. High magnification at the 50% longitudinal position reveals fine processes on the neural side and more defined radial bundles (arrow) on the abneural side. E, Shorter efferent secondary branches in the Wnt9a-OE AG turn to penetrate the BP closer to the abneural edge. F, Efferents are more disorganized after entering the BP. G, H, Ribbon density was increased across the entire radial axis. High magnification showed fewer and thinner efferent bundles, some of which were misdirected (arrowhead). n = 8 embryos. I–M, Embryo showing an extreme phenotype: neurite tracings of the efferent bundles in left uninjected AG (I) and right Wnt9a-OE AG (K) show good labeling of both efferent bundles. J, High magnification of efferents in the left BP showing normal radial patterning. L, M, High magnification of efferents in the Wnt9a-OE BP showing sparse innervation on both neural and abneural sides. Neurites were thinner and misdirected (n = 7 embryos). N, Orientation toward the neural side; Ab, abneural; h, habenula perforata.
Wnt9a-OE often reduced the efferent bundle within the SAG and yielded fewer secondary branches that did not extend as far in the neural direction (Fig. 5E). Right BPs showed 3 categories of phenotypic alteration: no change (n = 6), moderate (n = 8), and extreme (n = 7). The habenula perforata in the moderate phenotype was disorganized, broader, and shifted abneurally (Fig. 5F). Higher magnification showed that the BP had fewer radial bundles that were thinner and some of these were misdirected orthogonally (Fig. 5H, arrowhead). Ribbon foci were increased across the radial axis with one marked difference on the neural side: the puncta were smaller (Fig. 5G,H). Compared with the left control sides, BPs with the extreme phenotype had few to no efferents within a widened BP (Fig. 5I–M).
Wnt9a-OE induces changes in gene expression by E6
To begin to understand the mechanisms underlying the changes in cell fates seen near the end of embryogenesis resulting from ectopic Wnt9a delivery, we looked at earlier stages of development. The earliest detected phenotypic change was broader innervation on E6 within 3 d after viral injections (Fig. 6A). This suggests that, by E6, the afferents are already responding to some change in the environment of the Wnt9a-OE BP that now renders the abneural side an attractive target. To reveal changes in gene expression at this time point, RNA sequencing was performed on right BPs isolated from E6 Wnt9a-OE and RCAS(A)-injected animals. A total of 500 differentially regulated genes was found (296 upregulated and 204 downregulated; p < 0.05). Wnt9a transcripts increased significantly, validating the efficacy of gene delivery.
Figure 6.

Wnt9a-OE alters spatial gene expression on E6, E7, and E10. A, Rows 1–2, Adjacent sections through the same E6 embryo to map axonal innervation (3A10 immunolabeling) and Sema3d gene expression. Afferent processes (3A10-positive) are more mostly confined to the neural side on the left, whereas they spread radially across the BP upon Wnt9a-OE. The left BP shows Sema3d expression, which is missing from the right Wnt9a-OE BP (n = 5 embryos). Rows 3–5, Adjacent sections through a different E6 embryo showing three genes with expression patterns that are changed in response to Wnt9a-OE. Left BPs show endogenous Fzd10, Sfrp2, and Ser1 expression patterns. The right infected BP from the same embryo shows the loss of Fzd10 and Sfrp2 from the sensory domain and a wider, more intense signal for Ser1 (n = 3–5 embryos). B, On E7, Ser1 expression was visibly increased compared with the left (n = 3–5 embryos on E7). In whole mounts, Ser1 increased across the radial axis (n = 4 embryos), with a strong hotspot visible on the abneural side (arrow) of an E7 BP. Note that Ser1 expression on the abneural side of the left BP is as strong as that on the neural side of the right BP. C, Viral protein (3C2 antibody) and transcripts were detected from a series of sections through the same embryo on E10. Changes in Wnt7b, Fzd10, Sfrp2, Ser1, and Wnt5b in response to Wnt9a-OE were evident within the sensory BP, whereas the nonsensory expressions of Sfrp2 in homogene cells and Wnt5b in vacuole cells (arrowheads) were unaffected (n = 10 embryos). * denotes the loss of the scala vestibuli in Wnt9a-OE. Tv, Tegmentum vasculosum; ScM, scala media; ScV, scala vestibuli; Hm, homogene cells; Hy, hyaline cells; Va, vacuole cells.
RNA sequencing showed that several axon guidance molecules were among the genes with significant changes in expression on E6. For example, the expression of Sema3d, a repulsive guidance cue, was decreased (Table 3). In adjacent sections, we examined its spatial localization by in situ hybridization; Sema3d was expressed across the prosensory epithelium in control BPs, whereas Sema3d was abolished in Wnt9a-OE BPs (Fig. 6A). We previously found no evidence for a direct outgrowth-promoting effect of Wnt9a on E4 otic neurons using an established in vitro assay (Fantetti, 2011). Nevertheless, several genes linked to cell motility showed level changes, such as RhoA, calcium signaling molecules (Wipf1, Rhpn1, Arpc4, Actc1, Rac3, Pak3, Casq2, Iptr3), and axon guidance molecules (Bdnf, Nrtk2, Sema3d; Table 3). Fgf19 and Bmp7, which promote statoacoustic ganglion outgrowth (Fantetti and Fekete, 2012), were upregulated (Table 3).
Table 3.
Canonical pathways of differentially expressed genes upon Wnt9a-OE on E6
| Canonical pathway | −log (p-value) | Downregulated | Downregulated genes | Upregulated | Upregulated genes |
|---|---|---|---|---|---|
| Axonal guidance signaling | 4.89 | 8/434 (2%) | FZD10, BDNF, MYL1, NTRK2, SEMA3D, WNT7B, GNG5, ARPC4 | 16/434 (4%) | ITSN1, KALRN, PDGFA, WNT9A, SLIT2, ABLIM1, RAC3, ADAM8, PTK2, WIPF1, FZD4, PAK3, BMP7, SRGAP2, RTN4R, PRKD1 |
| Human embryonic stem cell pluripotency | 4.66 | 5/134 (4%) | SOX2, FZD10, NTRK2, BDNF, WNT7B | 7/134 (5%) | FZD4, PDGFA, WNT9A, PDGFRA, SMAD6, LEF1, BMP7 |
| Integrin signaling | 4.56 | 6/207 (3%) | ITGA8, ITGA6, TTN, ITGB6, ACTC1, ARPC4 | 9/207 (4%) | ASAP1, MYLK, RHOJ, RAC3, PTK2, WIPF1, PAK3, RHOU, VCL |
| Ephrin receptor signaling | 4.17 | 4/174 (2%) | ANGPT1, GRIN3A, GNG5, ARPC4 | 9/174 (5%) | ITSN1, KALRN, PDGFA, PTPN13, RAC3, EP300, PTK2, WIPF1, PAK3 |
| Calcium signaling | 4.07 | 10/178 (6%) | HDAC9, TNNC2, TNNT2, MYL1, ATP2B2, GRIN3A, MYH2, TNNI1, ACTC1, CASQ2 | 3/178 (2%) | EP300, ITPR3, HTR3A |
| Regulation of actin-based motility by Rho | 3.96 | 3/91 (3%) | ACTC1, MYL1, ARPC4 | 6/91 (7%) | WIPF1, PAK3, RHOU, RHOJ, MYLK, RAC3 |
| Signaling by Rho family GTPases | 3.42 | 6/234 (3%) | MYL1, PLD1, CDH8, GNG5, ACTC1, ARPC4 | 8/234 (3%) | MYLK, RHOJ, CDH19, PTK2, WIPF1, PAK3, RHOU, ARHGEF3 |
| Actin cytoskeleton signaling | 3.24 | 5/216 (2%) | MYH2, ACTC1, TTN, MYL1, ARPC4 | 8/216 (4%) | PTK2, PAK3, PDGFA, MYLK, VCL, FGF3, RAC3, FGF19 |
| Canonical Wnt signaling | 3.10 | 4/169 (2%) | SOX2, FZD10, SFRP2, WNT7B | 7/169 (4%) | AXIN2, WIF1, FZD4, WNT9A, LEF1, SOX13, EP300 |
| PCP pathway | 2.73 | 3/63 (5%) | RSPO3, FZD10, WNT7B | 3/63 (5%) | CELSR1, FZD4, WNT9A |
| Agrin interactions at neuromuscular junction | 2.53 | 3/69 (4%) | ERBB4, ITGA6, ACTC1 | 3/69 (4%) | PTK2, PAK3, RAC3 |
| Epithelial adherens junction signaling | 2.48 | 4/146 (3%) | MYH2, ACTC1, MYL1, ARPC4 | 5/146 (3%) | YES1, SNAI2, SSX2IP, LEF1, VCL |
| RhoA signaling | 2.42 | 6/122 (5%) | RHPN1, ACTC1, TTN, MYL1, PLD1, ARPC4 | 2/122 (2%) | PTK2, MYLK |
| Paxillin signaling | 2.31 | 4/101 (4%) | ITGA8, ITGA6, ITGB6, ACTC1 | 3/101 (3%) | PTK2, PAK3, VCL |
| Regulation of the epithelial–mesenchymal transition pathway | 2.30 | 2/184 (1%) | FZD10, WNT7B | 8/184 (4%) | PYGO1, SNAI2, FZD4, WNT9A, LEF1, FGF3, HMGA2, FGF19 |
| Clathrin-mediated endocytosis signaling | 2.29 | 4/185 (2%) | APOA1, ITGB6, ACTC1, ARPC4 | 6/185 (3%) | SYNJ1, PDGFA, TFRC, STAM, FGF3, FGF19 |
| PAK signaling | 1.99 | 1/89 (1%) | MYL1 | 5/89 (6%) | PTK2, PAK3, PDGFA, PDGFRA, MYLK |
| Ephrin B signaling | 1.76 | 1/73 (1%) | GNG5 | 4/73 (5%) | PTK2, KALRN, ITSN1, RAC3 |
| Semaphorin signaling in neurons | 1.63 | 0/53 (0%) | 4/53 (8%) | PTK2, PAK3, RHOU, RHOJ | |
| Role of NANOG in mammalian embryonic stem cell pluripotency | 1.56 | 3/111 (3%) | SOX2, FZD10, WNT7B | 3/111 (3%) | FZD4, WNT9A, BMP7 |
| FAK signaling | 1.47 | 1/87 (1%) | ACTC1 | 4/87 (5%) | PTK2, PAK3, ASAP1, VCL |
| Mouse embryonic stem cell pluripotency | 1.33 | 2/95 (2%) | SOX2, FZD10 | 3/95 (3%) | FZD4, LEF1, ID3 |
| Transcriptional regulatory network in embryonic stem cells | 1.31 | 2/40 (5%) | SOX2, ISL1 | 1/40 (3%) | ZFHX3 |
RNA sequencing also revealed several Wnt-related genes that were expressed differentially, including Fzd10, Sfrp2, and Wnt7b (Table 3). In situ hybridization performed on E6 showed that expression of Fzd10, an abneural transcript, was abolished. Sfrp2 is most strongly expressed in the center of the BP and in the future homogene cell region (where Wnt9a is expressed), but was reduced only in the sensory domain. Ser1/Jag1 is a known Wnt target gene, so it serves as a positive control. Ser1 is normally expressed in a gradient across the BP, being stronger on the neural side. Unexpectedly, it was unchanged by Wnt9a-OE in the E6 RNA-sequencing dataset and was only modestly increased by in situ hybridization on E6 (Fig. 6A). An overall increase in Ser1 transcript levels was more obvious on E7 (Fig. 6B). In whole mounts, the signal strength for Ser1 on the Wnt9a-OE abneural side appeared comparable to the neural side of the left BP with isolated patches even stronger (arrow). Nonetheless, a neural-high to abneural-low gradient persisted in the context of strong Wnt9a-OE, suggesting that at least some neural–abneural patterning information was still present in the treated samples on E7.
In situ hybridization was also performed on E10 to determine whether the gene expression changes were maintained at a later stage, but before HC types were morphologically distinguishable (Fig. 6C). The abneural/central genes, Wnt7b, Fzd10, and Sfrp2 were all abolished in the sensory domain in Wnt9a-OE samples, whereas nonsensory expression of Sfrp2 and Wnt5b was unchanged. Ser1 expression was increased, but still displayed a gradient that was highest neurally. Although RNA sequencing showed that Wnt7b transcripts were present on E6 and were downregulated by Wnt9a-OE, they could not be detected using in situ hybridization at earlier stages; however, they were clearly reduced on the treated sides on E10.
Wnt9a-OE increases proliferation during the same time window of differential gene expression
We found that the superfluous cells populating Wnt9a-OE BPs resulted from both enhanced proliferation and a prolonged period of cell division (Fig. 7A). When RCAS(A)-Wnt9a was injected into E3 otocysts (without an E2 preinjection of parent virus) and analyzed on E6–E10, there was a delay of ∼2–3 d in HC differentiation (Fig. 7B). This may be a reflection of the general delay in cell cycle withdrawal, allowing additional time for cell fate reprogramming by Wnt9a.
Figure 7.
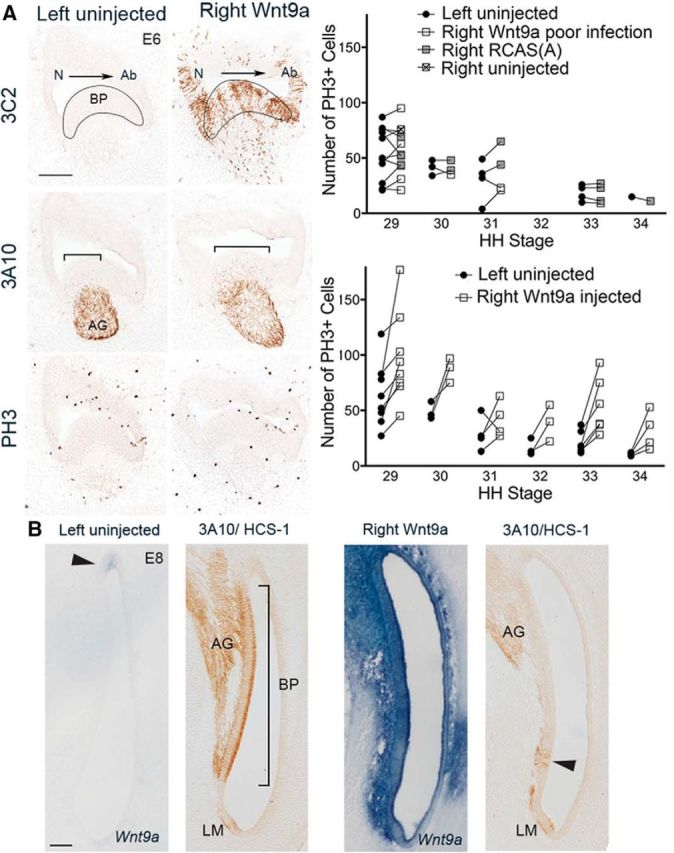
Wnt9a-OE increases afferent innervation and proliferation on the abneural side on E6–E8 while delaying HC formation until E8. A, Wnt9a-OE, marked by the 3C2 antibody, is absent in the left BP but present in the right BP 3 d after viral injection. At the same time, afferent innervation (3A10-positive) was restricted to the neural side of the left BP, but encompassed a broader domain in the right infected BP (brackets). PH3+ cells were found primarily on the abneural half of the sensory BP in both left and right sides, although there were more cells on the right. Top right plot, PH3+ counts from E6–E8 embryos (Hamburger and Hamilton stages 29–34; Hamburger and Hamilton, 1951). PH3+ counts in left BPs are similar to right BPs from uninjected (n = 1), RCAS(A)-injected (n = 13), or poorly infected Wnt9a-OE right ears with fewer than ∼20% of the cells infected (n = 9). Statistical analysis of the pooled data (n = 23) shows an effect for stage (p = 0.001), but not for side (left/right; p = 0.35) and stage*side interaction (p = 0.30; df = 21). Lower right plot, PH3+ counts are higher in right Wnt9a-OE BPs with more than ∼20% of cells infected compared with uninjected left sides. Statistical analysis of these data (n = 28) shows an effect for stage (p = 0.0001), side (p < 0.013), and stage*side interaction (p < 0.003; df = 26). B, Transverse sections through the brainstem cuts the BP along its longitudinal axis, with the proximal end oriented to the top. The left uninjected BP showing endogenous Wnt9a on the neural edge of the BP (arrowhead) and normal HC formation (HCS-1) and neurite innervation (3A10) by E8. The right Wnt9a-OE BP shows an increase in Wnt9a transcripts with HC differentiation just beginning at the distal end of the BP on E8 (arrowhead). The lagena macula appears unchanged. Ab, Abneural; LM, lagena macula; N, neural.
Discussion
The THC-only phenotype resulting from Wnt9a-OE can be interpreted in light of the asymmetric source of Wnt9a mRNA along the neural edge of normal BPs. Via either a short-range signal or dilution of Wnt signaling propogated directionally through dividing cells (Farin et al., 2016), Wnt9a may function to subdivide the BP into neural versus abneural fates. This signaling would directly upregulate Wnt target genes (e.g., Ser1), as was observed by E6 in the BP based on neural–abneural asymmetries in gene expression. The reduction of both central (Sfrp2) and abneural genes (Fzd10 and Wnt7b) on E6, in response to the misexpression of Wnt9a, may reflect the loss of signaling by an abneural inducer or it may simply result from the absence of abneural fates. By E18, the entire organ was populated by THCs and THC-like cells. There is prior evidence for related morphological and transcriptional changes to Wnt-activated embryonic mammalian cochleas: pharmacological activation of the Wnt pathway promotes the specification of the medial domain containing IHCs while suppressing formation of the lateral-domain-containing OHCs (Munnamalai and Fekete, 2016).
Together, results from mouse and chicken suggest some evolutionary conservation for Wnts to control the size and identity of the neural/medial compartment of the cochlea while suppressing the abneural/lateral compartment. This raises the question of how the organs respond to the absence or reduction of a Wnt signal during the critical period when radial asymmetry is being established. Embryonic mouse cochleas cultured in the presence of a Wnt inhibitor (IWR-1) are smaller due to a 40% reduction in the medial compartment (Munnamalai and Fekete, 2016). In chicken, E7.5 BPs cultured with IWR-1 are also smaller (Jacques et al., 2014), although radial identities (THC/SHC fates) were not evaluated and would have required longer culture times to differentiate HC types. Because a pharmacological approach to blocking Wnt signaling is insufficient to reveal the role of a particular Wnt ligand, we attempted to specifically knock down Wnt9a using short-hairpin RNAs encoded in the introns of viral or plasmid vectors. However, we were unable to detect a reduction in Wnt9a. We also examined E18.5 Wnt9a-KO mouse cochleas (gift from Christine Hartmann), but saw no disruptions in cochlear patterning. Low levels of expression of Wnt9a in the embryonic mouse cochlea (Shen et al., 2015) could explain why it is apparently not required for radial patterning in this species. Therefore, birds and mammals have likely diverged as to which Wnt ligands influence radial axis patterning.
The challenge in deciphering whether enhanced Wnt9a signaling was directly responsible for an abneural-to-neural conversion is that Wnt signaling can also stimulate proliferation in developing auditory organs (Jacques et al., 2014; Munnamalai and Fekete, 2016), thus potentially expanding the neural-side population. Indeed, we detected increased proliferation with Wnt9a-OE. However, increasing the size of the organ fails to explain the absence of SHCs. During normal development of the BP, cell cycle exit progresses from neural to abneural and from proximal to distal (Katayama and Corwin, 1989). These directional gradients were unaffected by Wnt9a-OE: this is shown for the radial axis in Figure 7A (dividing cells are mostly confined to the abneural half of the BP, similar to untreated BPs) and was also observed for the longitudinal axis because residual mitotic cells in the BP on E10 were confined to the apex (data not shown, n = 3 samples). It is not known what enforces cell cycle arrest, but it occurs even in the face of enhanced Wnt activity. Several abneural marker genes that are missing in the context of Wnt9a-OE are normally restricted to the abneural side even before those cells pull out of division. This indicates that the neural–abneural fate decision is being made by cycling progenitors rather than postmitotic cells, thus mitigating the relevance of Wnt's proliferative effect. This leads us to posit that Wnt9a promotes neural-side identity directly and/or blocks the acquisition of abneural fates.
We showed previously that overexpression of constitutively active β-catenin in the BP generated ectopic vestibular patches at various locations across its radial axis (Stevens et al., 2003). Wnt9a-OE also stimulated vestibular fates, but only on the extreme abneural side of the BP. The spatial constraints on vestibular conversion in the context of ligand overexpression, but not when intracellular Wnt signaling is enhanced, may be related to the combined spatial expression of Fzd receptors and Wnt inhibitors (Sienknecht and Fekete, 2008, 2009) that will affect the bioavailability of Wnt ligands. Moreover, whereas robust Wnt signaling may first specify vestibular fates, it could be repurposed for radial patterning after commitment of the BP to an auditory fate.
IKf (BK) is a distinguishing feature of THCs and appears after E18, reaching mature levels ∼E19, only days before hatching. Similarly, IA, a transient outward potassium current, is characteristic of SHCs (Fuchs and Sokolowski, 1990; Tan et al., 2013). Interestingly, Wnt9a-OE resulted in an intermediate phenotype for some abneural HCs that exhibited features of both THCs and SHCs. Perhaps this reflects a delay in BK acquisition because we recorded at a stage when BK channels begin to be expressed (E18–E20). Alternatively, Wnt9a-OE may alter the complement of channels appropriate to the tonotopic position. BK macroscopic conduction and activation/deactivation kinetics vary systematically along the longitudinal axis (Pantelias et al., 2001; Duncan and Fuchs, 2003), so differences in calcium sensitivity and amplitude could mask underlying radial fate changes. Conversely, ∼25% of the Wnt9a-infected abneural HCs exhibited A-type currents, clearly demonstrating a SHC phenotype and suggesting that there is a mixed response among the Wnt9a-OE BPs. Indeed, labeling of ribbons in HCs also suggests that not all abneural domains were fully converted in all animals.
Among the changes found when Wnt9a was overexpressed was an increase in THC numbers and, based on ultrastructural morphology, a complete absence of SHCs by E17. Both sides of the BP showed an increased number of ribbons per HC. This implies that excess Wnt9a may convert neural-side THCs into “super” THCs, although effects on ribbon synapse maturation could also underlie these changes. Manipulation of intracellular calcium has been shown to affect the size of ribbon foci in HCs (Sheets et al., 2012) and two differentially expressed genes (Casq2 and Itpr3) may be responsible for increasing intracellular calcium, resulting in smaller ribbons in Wnt9a-OE BPs.
In the normal BP, spatial targeting of afferent axons predominantly to the THC side (Fischer, 1992) is already evident on E6. Upon Wnt9a-OE, the axons spread abneurally by E6. The radial spread of axons is sustained on E18 and mirrored by presynaptic changes (ribbon counts), although the latter may be an independent phenomenon. Increased abneural projections may reflect Wnt9a-induced changes in molecules that stimulate auditory axon outgrowth: FGFs, BMP7, or survival neurotrophins (Garrido et al., 1998; Fantetti and Fekete, 2012). Such genes that are elevated upon Wnt9a-OE include Fgf3, Fgf19, and Bmp7. However, RNA-sequencing data showed a downregulation of both Bdnf and its receptor, Nrtk2, upon Wnt9a-OE. Therefore, this outgrowth of afferent axons is independent of BDNF but perhaps dependent on FGFs (Appler and Goodrich, 2011), BMPs, or other growth factors.
Several of the genes differentially regulated by Wnt9a-OE are involved in axon guidance, calcium signaling, F-actin cytoskeletal remodeling, or other cellular processes that correlate with axon outgrowth. Sema3d downregulation was notable because, in the mammalian cochlea, type I afferents that explore the OHC region undergo retraction and become restricted to the neural side due in part to Sema3f-mediated repulsion (Coate et al., 2015; Druckenbrod and Goodrich, 2015). Consistent with this, afferents spread into abneural territory when Sema3d expression was abolished by Wnt9a-OE. However, we found that Sema3d transcripts are normally present across the width of the BP on E6 even at locations where afferents are present; this is inconsistent with a repulsive effect on afferents at this age. Several genes that are components of RhoA-mediated axonal steering were also downregulated. These could be downstream of a loss in Semaphorin-mediated growth cone repulsion. Alternatively, these genes may be regulated directly by the Wnt pathway in afferent neurons, leading to select neurites losing the ability to steer away from the abneural half. Another possibility is that some of these F-actin-remodeling proteins are required for afferent axon pruning. In the chicken, excess branches are pruned as synapses mature (Whitehead and Morest, 1985a). In mammals, the retraction of afferents from immature OHCs coincides with the arrival of efferent neurites (Pujol, 1986).
At present, we are lacking a mechanistic understanding of why efferent trajectories are abnormal after Wnt9a-OE. The proposed abneural-to-neural fate switch may alter an efferent guidance cue or the efferents may arrive on schedule but subsequently retract in the absence of their normal SHC target cells. During normal development, processes that innervate the abneural edge traverse enlarged extracellular spaces, which provide a pathway for axons to reach SHCs (Whitehead and Morest, 1985a, 1985b). Further investigation will be necessary to determine whether overcrowding the target tissue with cells and afferents resists the penetration of efferents into the epithelium.
In summary, this study shows that ectopic Wnt9a-mediated signaling not only increases cell proliferation, but also influences the specification of radial identities in the BP at a time when many HCs and supporting cells are still proliferating. This imposition of regional identity is associated with changes in spatial gene expression and can affect axonal projections and later differentiation of HCs into two distinct types. This is the first study to identify a specific Wnt ligand that can have such a profound effect on radial identity in the developing cochlea.
Footnotes
This work was supported by the Collaborative Core for Cancer Bioinformatics, the Purdue Statistical Consultant Services (Department of Statistics), the Purdue University Center for Cancer Research [National Institutes of Health (NIH) Grant P30CA023168], the Indiana University Simon Cancer Center (NIH Grant P30CA082709), the Walther Foundation, the Purdue Bioinformatics Core, the National Institute on Deafness and Other Communication Disorders (Grant R01DC002756 to D.M.F. and Grant P30DC005188 to R.K.D.), and the Deutsche Forschungsgemeinschaft (Grant SPP1608 SI823/3-1 to U.J.S.). We thank Christine Hartmann for providing mouse Wnt9a-KO cochleas and Lisa Goodrich for critiquing an earlier version of this manuscript and Qing Zhou, Pin-Chao Liao, and Kyle Patton for technical assistance.
The authors declare no competing financial interests.
References
- Appler JM, Goodrich LV (2011) Connecting the ear to the brain: Molecular mechanisms of auditory circuit assembly. Prog Neurobiol 93:488–508. 10.1016/j.pneurobio.2011.01.004 [DOI] [PMC free article] [PubMed] [Google Scholar]
- Coate TM, Spita NA, Zhang KD, Isgrig KT, Kelley MW (2015) Neuropilin-2/Semaphorin-3F-mediated repulsion promotes inner hair cell innervation by spiral ganglion neurons. Elife 4. [DOI] [PMC free article] [PubMed] [Google Scholar]
- Collu GM, Hidalgo-Sastre A, Brennan K (2014) Wnt-Notch signalling crosstalk in development and disease. Cell Mol Life Sci 71:3553–3567. 10.1007/s00018-014-1644-x [DOI] [PMC free article] [PubMed] [Google Scholar]
- Druckenbrod NR, Goodrich LV (2015) Sequential retraction segregates SGN processes during target selection in the cochlea. J Neurosci 35:16221–16235. 10.1523/JNEUROSCI.2236-15.2015 [DOI] [PMC free article] [PubMed] [Google Scholar]
- Duncan RK, Fuchs PA (2003) Variation in large-conductance, calcium-activated potassium channels from hair cells along the chicken basilar papilla. J Physiol 547:357–371. 10.1113/jphysiol.2002.029785 [DOI] [PMC free article] [PubMed] [Google Scholar]
- Fantetti KN. (2011) Responsiveness of chick statoacoustic ganglion neurons to morphogens ProQuest Dissertations and Theses Global (1015397608; No. 3507329).
- Fantetti KN, Fekete DM (2012) Members of the BMP, Shh, and FGF morphogen families promote chicken statoacoustic ganglion neurite outgrowth and neuron survival in vitro. Dev Neurobiol 72:1213–1228. 10.1002/dneu.20988 [DOI] [PMC free article] [PubMed] [Google Scholar]
- Farin HF, Jordens I, Mosa MH, Basak O, Korving J, Tauriello DV, de Punder K, Angers S, Peters PJ, Maurice MM, Clevers H (2016) Visualization of a short-range Wnt gradient in the intestinal stem-cell niche. Nature 530:340–343. 10.1038/nature16937 [DOI] [PubMed] [Google Scholar]
- Fischer FP. (1992) Quantitative analysis of the innervation of the chicken basilar papilla. Hear Res 61:167–178. 10.1016/0378-5955(92)90048-R [DOI] [PubMed] [Google Scholar]
- Fuchs PA. (1992) Ionic currents in cochlear hair cells. Prog Neurobiol 39:493–505. 10.1016/0301-0082(92)90003-W [DOI] [PubMed] [Google Scholar]
- Fuchs PA, Sokolowski BH (1990) The acquisition during development of Ca-activated potassium currents by cochlear hair cells of the chick. Proc Biol Sci 241:122–126. 10.1098/rspb.1990.0075 [DOI] [PubMed] [Google Scholar]
- Garrido JJ, Alonso MT, Lim F, Carnicero E, Giraldez F, Schimmang T (1998) Defining responsiveness of avian cochlear neurons to brain-derived neurotrophic factor and nerve growth factor by HSV-1-mediated gene transfer. J Neurochem 70:2336–2346. [DOI] [PubMed] [Google Scholar]
- Goodyear RJ, Legan PK, Christiansen JR, Xia B, Korchagina J, Gale JE, Warchol ME, Corwin JT, Richardson GP (2010) Identification of the hair cell soma-1 antigen, HCS-1, as otoferlin. J Assoc Res Otolaryngol 11:573–586. 10.1007/s10162-010-0231-6 [DOI] [PMC free article] [PubMed] [Google Scholar]
- Goodyear R, Holley M, Richardson G (1994) Visualisation of domains in the avian tectorial and otolithic membranes with monoclonal antibodies. Hear Res 80:93–104. 10.1016/0378-5955(94)90013-2 [DOI] [PubMed] [Google Scholar]
- Groves AK, Fekete DM (2012) Shaping sound in space: the regulation of inner ear patterning. Development 139:245–257. 10.1242/dev.067074 [DOI] [PMC free article] [PubMed] [Google Scholar]
- Hamburger V, Hamilton HL (1951) A series of normal stages in the development of the chick embryo. J Morphol 88:49–92. 10.1002/jmor.1050880104 [DOI] [PubMed] [Google Scholar]
- Hartmann C, Tabin CJ (2001) Wnt-14 plays a pivotal role in inducing synovial joint formation in the developing appendicular skeleton. Cell 104:341–351. 10.1016/S0092-8674(01)00222-7 [DOI] [PubMed] [Google Scholar]
- Itasaki N, Hoppler S (2010) Crosstalk between Wnt and bone morphogenic protein signaling: a turbulent relationship. Dev Dyn 239:16–33. 10.1002/dvdy.22009 [DOI] [PubMed] [Google Scholar]
- Jacques BE, Montgomery WH 4th, Uribe PM, Yatteau A, Asuncion JD, Resendiz G, Matsui JI, Dabdoub A (2014) The role of Wnt/beta-catenin signaling in proliferation and regeneration of the developing basilar papilla and lateral line. Dev Neurobiol 74:438–456. 10.1002/dneu.22134 [DOI] [PubMed] [Google Scholar]
- Jiang GJ, Zidanic M, Michaels RL, Michael TH, Griguer C, Fuchs PA (1997) CSlo encodes calcium-activated potassium channels in the chick's cochlea. Proc Biol Sci 264:731–737. 10.1098/rspb.1997.0104 [DOI] [PMC free article] [PubMed] [Google Scholar]
- Jin Z, Chau MD, Bao ZZ (2006) Sema3D, Sema3F, and Sema5A are expressed in overlapping and distinct patterns in chick embryonic heart. Dev Dyn 235:163–169. 10.1002/dvdy.20614 [DOI] [PMC free article] [PubMed] [Google Scholar]
- Katayama A, Corwin JT (1989) Cell production in the chicken cochlea. J Comp Neurol 281:129–135. 10.1002/cne.902810110 [DOI] [PubMed] [Google Scholar]
- Khimich D, Nouvian R, Pujol R, Tom Dieck S, Egner A, Gundelfinger ED, Moser T (2005) Hair cell synaptic ribbons are essential for synchronous auditory signalling. Nature 434:889–894. 10.1038/nature03418 [DOI] [PubMed] [Google Scholar]
- Kim D, Pertea G, Trapnell C, Pimentel H, Kelley R, Salzberg SL (2013) TopHat2: accurate alignment of transcriptomes in the presence of insertions, deletions and gene fusions. Genome Biol 14:R36. 10.1186/gb-2013-14-4-r36 [DOI] [PMC free article] [PubMed] [Google Scholar]
- Li Y, Atkin GM, Morales MM, Liu LQ, Tong M, Duncan RK (2009) Developmental expression of BK channels in chick cochlear hair cells. BMC Dev Biol 9:67. 10.1186/1471-213X-9-67 [DOI] [PMC free article] [PubMed] [Google Scholar]
- Love MI, Huber W, Anders S (2014) Moderated estimation of fold change and dispersion for RNA-seq data with DESeq2. Genome Biol 15:550. 10.1186/s13059-014-0550-8 [DOI] [PMC free article] [PubMed] [Google Scholar]
- Manley GA. (2017) Comparative auditory neuroscience: understanding the evolution and function of ears. J Assoc Res Otolaryngol 18:1–24. 10.1007/s10162-016-0579-3 [DOI] [PMC free article] [PubMed] [Google Scholar]
- Mann ZF, Thiede BR, Chang W, Shin JB, May-Simera HL, Lovett M, Corwin JT, Kelley MW (2014) A gradient of Bmp7 specifies the tonotopic axis in the developing inner ear. Nat Commun 5:3839. 10.1038/ncomms4839 [DOI] [PMC free article] [PubMed] [Google Scholar]
- Morgan BA, Fekete DM (1996) Manipulating gene expression with replication-competent retroviruses. Methods Cell Biol 51:185–218. 10.1016/S0091-679X(08)60629-9 [DOI] [PubMed] [Google Scholar]
- Munnamalai V, Fekete DM (2016) Notch-Wnt-Bmp crosstalk regulates radial patterning in the mouse cochlea in a spatiotemporal manner. Development 143:4003–4015. 10.1242/dev.139469 [DOI] [PMC free article] [PubMed] [Google Scholar]
- Pantelias AA, Monsivais P, Rubel EW (2001) Tonotopic map of potassium currents in chick auditory hair cells using an intact basilar papilla. Hear Res 156:81–94. 10.1016/S0378-5955(01)00269-6 [DOI] [PubMed] [Google Scholar]
- Potts WM, Olsen M, Boettiger D, Vogt VM (1987) Epitope mapping of monoclonal antibodies to gag protein p19 of avian sarcoma and leukaemia viruses. J Gen Virol 68:3177–3182. 10.1099/0022-1317-68-12-3177 [DOI] [PubMed] [Google Scholar]
- Pujol R. (1986) Synaptic plasticity in the developing cochlea. In: The Biology of Change in Otolaryngology (Ruben R, Van Der Water TR, eds), 47–54. New York: Elsevier. [Google Scholar]
- Rasmussen GL. (1946) The olivary peduncle and other fiber projections of the superior olivary complex. J Comp Neurol 84:141–219. 10.1002/cne.900840204 [DOI] [PubMed] [Google Scholar]
- Robinson MD, McCarthy DJ, Smyth GK (2010) edgeR: a Bioconductor package for differential expression analysis of digital gene expression data. Bioinformatics 26:139–140. 10.1093/bioinformatics/btp616 [DOI] [PMC free article] [PubMed] [Google Scholar]
- Sheets L, Kindt KS, Nicolson T (2012) Presynaptic CaV1.3 channels regulate synaptic ribbon size and are required for synaptic maintenance in sensory hair cells. J Neurosci 32:17273–17286. 10.1523/JNEUROSCI.3005-12.2012 [DOI] [PMC free article] [PubMed] [Google Scholar]
- Shen J, Scheffer DI, Kwan KY, Corey DP (2015) SHIELD: an integrative gene expression database for inner ear research. Database (Oxford) 2015:bav071. 10.1093/database/bav071 [DOI] [PMC free article] [PubMed] [Google Scholar]
- Sienknecht UJ, Fekete DM (2008) Comprehensive Wnt-related gene expression during cochlear duct development in chicken. J Comp Neurol 510:378–395. 10.1002/cne.21791 [DOI] [PMC free article] [PubMed] [Google Scholar]
- Sienknecht UJ, Fekete DM (2009) Mapping of Wnt, frizzled, and Wnt inhibitor gene expression domains in the avian otic primordium. J Comp Neurol 517:751–764. 10.1002/cne.22169 [DOI] [PMC free article] [PubMed] [Google Scholar]
- Stevens CB, Davies AL, Battista S, Lewis JH, Fekete DM (2003) Forced activation of Wnt signaling alters morphogenesis and sensory organ identity in the chicken inner ear. Dev Biol 261:149–164. 10.1016/S0012-1606(03)00297-5 [DOI] [PubMed] [Google Scholar]
- Tanaka K, Smith CA (1978) Structure of the chicken's inner ear: SEM and TEM study. Am J Anat 153:251–271. 10.1002/aja.1001530206 [DOI] [PubMed] [Google Scholar]
- Tan X, Beurg M, Hackney C, Mahendrasingam S, Fettiplace R (2013) Electrical tuning and transduction in short hair cells of the chicken auditory papilla. J Neurophysiol 109:2007–2020. 10.1152/jn.01028.2012 [DOI] [PMC free article] [PubMed] [Google Scholar]
- Thiede BR, Mann ZF, Chang W, Ku YC, Son YK, Lovett M, Kelley MW, Corwin JT (2014) Retinoic acid signalling regulates the development of tonotopically patterned hair cells in the chicken cochlea. Nat Commun 5:3840. 10.1038/ncomms4840 [DOI] [PMC free article] [PubMed] [Google Scholar]
- Wahlin KJ, Moreira EF, Huang H, Yu N, Adler R (2008) Molecular dynamics of photoreceptor synapse formation in the developing chick retina. J Comp Neurol 506:822–837. 10.1002/cne.21582 [DOI] [PubMed] [Google Scholar]
- Whitehead MC, Morest DK (1981) Dual populations of efferent and afferent cochlear axons in the chicken. Neuroscience 6:2351–2365. 10.1016/0306-4522(81)90022-1 [DOI] [PubMed] [Google Scholar]
- Whitehead MC, Morest DK (1985a) The development of innervation patterns in the avian cochlea. Neuroscience 14:255–276. 10.1016/0306-4522(85)90177-0 [DOI] [PubMed] [Google Scholar]
- Whitehead MC, Morest DK (1985b) The growth of cochlear fibers and the formation of their synaptic endings in the avian inner ear: a study with the electron microscope. Neuroscience 14:277–300. 10.1016/0306-4522(85)90178-2 [DOI] [PubMed] [Google Scholar]
- Zidanic M. (2002) Cholinergic innervation of the chick basilar papilla. J Comp Neurol 445:159–175. 10.1002/cne.10160 [DOI] [PubMed] [Google Scholar]
- Zidanic M, Fuchs PA (1995) Kinetic analysis of barium currents in chick cochlear hair cells. Biophys J 68:1323–1336. 10.1016/S0006-3495(95)80305-X [DOI] [PMC free article] [PubMed] [Google Scholar]